Strategic priorities: organic farming and livestock The Plan recognizes the importance of organic farming to contribute to the achievement of all environmental objectives; indeed, the sector is allocated about 2.5 billion euro in the five-year period within the rural development. The allocation already foreseen by rural development (1.5 billion euros) is in fact integrated with […]
Our Works
GROWTH - 28 May 2015
The CAP: the most cost-effective EU policy for Finance ministers
Scope and Aims:
The scope of this Farm Europe policy paper is intentionally confined to the purely budgetary aspects of the EC’s three main policies for Member States. Drawing on figures from the previous budget negotiations, it offers a reading of the positions that Finance Ministers/Ministries from the 28 Member States will be tempted to defend in the preparatory discussions to the review of the EU’s MFF framework.
Background:
In many Member States, Finance and Agriculture Ministers do not necessarily share the same political or strategic approaches to the CAP and how it might evolve. Agriculture ministers are more sensitive to the fact that by investing in agriculture the European Union is not only investing to meet its economic and local development needs, but is also creating public goods that are essential to society as a whole. If agriculture Ministers focused their efforts to put in place policy tools that are as finely tuned as possible to their country’s specific needs, Finance Ministers have been working to preserve national drawdown and transfer spending responsibilities from national budgets to the Community budget – with, uppermost in their minds throughout their deliberations, a need for budgetary discipline.
In this paper we discuss the financial leverage effects of European policy budgets for each Member State in terms of what a Euro invested (paid in) to fund the overall Community budget leverages back in EU funding. We analyse the leverage effect of:
- all EU policies taken as a whole;
- the CAP;
- EU regional policy;
- the EU’s strategy for growth and jobs.
Our examination of the leverage ratios between the national contributions to the EU budget and payments received from the EU (all sources), shows that Member States (MS) fall into 2 main groups and 5 subgroups:
A group of net contributors: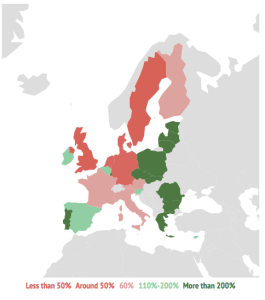
- MS that receive less than 50% of the amount they contribute), i.e. the UK and Sweden;
- MS that receive about half of the amount they contribute): the Netherlands, Germany and Denmark;
- The other net contributors that receive 60% or more of the amount they contribute): Austria, France, Finland and Italy.
A group of net beneficiaries:
- The MS that receive between 110 % and 200 % of what they contribute): Cyprus, Spain, Ireland, Belgium, Slovenia;
- The MS that receive over 200% of what they contribute – up to 534 % for Hungary): Malta, Slovakia, The Czech Republic, Greece, Portugal, Romania, Poland, Luxembourg, Latvia, Estonia, Lithuania, Hungary.
Analysis of the net contributor group of MS
During the last European budget negotiations, the positions of the net contributor group not only reflected these different net budgetary costs, but also reflected their role in furthering a vision of Europe not as a mere trading block but as a political entity. Although the UK and Sweden made their customary calls for a smaller Community budget and smaller contributions, Germany and the Netherlands called not only for budgetary discipline (no increase in European spending) but also for a stronger more united European Union with policies resolutely focused on achieving growth. The latter countries were also keen to ensure that not only those Member States with strong economies would be called upon to increase their contributions if needed
The negotiating priorities of the different Member States in relation to the distribution of the EU budget between the Union’s three main policy areas can be read, to a large extent, as a consequence of the specific performance (i.e. the leverage or return on contributions) of each policy area compared with the Member State’s overall performance. In the case of Austria for example, while overall performance stands at 0.59 (0.59 Euros received for 1 Euro paid in) the performance in individual policy areas stand at 0.92 for the CAP, 0.58 for growth and jobs policies and 0.28 for regional policies.
Calculated in such terms, and for each of the net contributor group of Member States – except the UK, Sweden, the Netherlands and Italy -, we observe that the CAP is the most ‘profitable’ policy, albeit to varying degrees :
- the CAP is by far the most profitable investment for Denmark (with a performance of 0.84 for the CAP against 0.50 overall performance), Austria, France (0.95 against 0.60) and Finland (0.93 against 0.66).
- It is also true, although to a lesser degree, for Germany (0.58 against 0.49).
- The CAP’s performance against overall performance is also higher for the UK (0.57 against 0.39) Sweden (0.55 against 0.42) and Italy (0.74 against 0.72). However, for the latter 3 MS, the ratio is better, respectively, for growth and employment policies (0.67 for both the UK and Sweden) and for regional in the case of Italy (0.83).
Only in the case of the Netherlands is the CAP’s performance lower (marginally) than the overall performance (0.43 against 0.45), although at 0.98 growth policies offer much higher relative performance.
With the exception of Denmark, Member State governments’ enthusiasm in budget discussions for the different policy areas is in line with their comparative performance.
However, we find interesting to note that all MS in the net contributor group are also now net contributors to each of the three main policy areas considered individually. In other words, the CAP, regional policy and growth policies each constitute a net cost for the net contributor group of Member States.
This point should be noted and taken into account in future discussions on the desirable (or not) degrees of subsidiarity (that Lember States might benefit from under the CAP) and their deeper long-term implications. This issue will be discussed in a policy briefing to come.
Analysis of the net beneficiary group of MS
Turning to the net beneficiary group of Member States, with the exception of Luxembourg, Belgium, Malta and Cyprus for which the performance of the CAP is less than 1, all the other MS have rates that are greater than 1 (that is, for each Euro contributed to the CAP budget, they receive more than 1 Euro from the CAP in return).
- For these MS, it is noteworthy that the performance of regional policy is double, and sometimes three times that of the CAP, with the notable exception of Ireland.
- The performance of the CAP for Ireland is greater than 2.4 against a figure for EU funding overall of 1.32 (and performance rates for regional policy and growth policies of 0.17 and 0.99 respectively.
- In the cases of Spain and Romania, the CAP’s performance is higher than the overall performance, but by very little. For Spain, the CAP offers the highest performance of the three main policy areas.
Closing remarks
The recent budget negotiations for the 2014-2020 period did nothing to modify substantially these equilibria and underlying negotiating rationales. If anything, they led to an, albeit marginal, accentuation. And little is likely to change for the MS Finance Ministries, irrespective of policy discourse, when preliminary discussions on the next budgetary period begin.
As a result agriculture decision-makers could take advantage of the fact that the CAP is in the end a “good investment” for financial ministers – at least from the point of view of their capacity to deliver a good budgetary negotiation for their country. AGRI-ministers could then keep aside for a moment at-least budgetary pressure not to restrict their actions on budgetary justification but also on policy efficiency and economic ambition. Even if at proposal stage, the European Commission way of tabling financial proposals automatically put pressure on the CAP budget – a topic to be address in another policy briefing.
| Financial leverage ratios of the CAP expressed as rates. | Financial leverage of regional Policies | Financial leverage of Growth Policies | Financial leverage ratios (all policies) | 2013 Data |
| 2.46 | 0.17 | 0.99 | 1.32 | Ireland |
| 0.84 | 0.06 | 0.67 | 0.50 | Denmark |
| 0.92 | 0.24 | 0.58 | 0.59 | Austria |
| 0.95 | 0.28 | 0.49 | 0.60 | France |
| 0.57 | 0.10 | 0.67 | 0.39 | United Kingdom |
| 0.93 | 0.40 | 0.59 | 0.66 | Finland |
| 0.55 | 0.18 | 0.67 | 0.42 | Sweden |
| 0.58 | 0.44 | 0.44 | 0.49 | Germany |
| 1.37 | 1.23 | 0.61 | 1.17 | Spain |
| 4.95 | 4.95 | 1.60 | 4.28 | Bulgaria |
| 0.74 | 0.83 | 0.38 | 0.72 | Italy |
| 3.70 | 4.97 | 0.27 | 3.65 | Romania |
| 0.43 | 0.21 | 0.98 | 0.45 | Netherlands |
| 2.80 | 4.97 | 0.74 | 3.28 | Greece |
| 0.88 | 1.33 | 0.93 | 1.12 | Cyprus |
| 3.41 | 7.66 | 1.08 | 4.80 | Latvia |
| 3.97 | 7.79 | 2.35 | 5.23 | Lithuania |
| 2.69 | 6.24 | 0.28 | 3.68 | Poland |
| 3.79 | 9.06 | 1.20 | 5.34 | Hungary |
| 1.70 | 4.48 | 0.58 | 2.56 | Slovakia |
| 1.73 | 5.60 | 0.45 | 2.98 | Czech Republic |
| 1.95 | 6.31 | 0.51 | 3.41 | Portugal |
| 2.76 | 9.29 | 1.16 | 5.16 | Estonia |
| 1.10 | 3.42 | 0.91 | 2.01 | Slovenia |
| 0.38 | 0.30 | 1.86 | 1.66 | Belgium |
| 0.49 | 4.18 | 1.16 | 2.58 | Malta |
| 0.33 | 0.11 | 3.30 | 4.40 | Luxembourg |