How will we feed the world in the next decades? An analysis of the demand and supply factors for food

There have always been predictions and concerns about the ability of agriculture to meet the global demand for food. In as early as 1798, Thomas Malthus made a pessimistic analysis of this issue in his groundbreaking ‘Essay on the Principle of Population’. He started from the observation that the global population would continue to rise exponentially, while the production of food could only be increased in a more limited way. As a result, he predicted that mankind would eventually be unable to feed an increasing number of people, leading to famine, war and misery. [1]

Fortunately, this ‘Malthusian catastrophe’ never took place on a global scale. Because of an increase in agricultural productivity due to technological innovations, the production of food was able to keep pace with demographic growth in the last two centuries. [2]

However, today there are renewed concerns that global food production will be increasingly challenged by a growing demand for agricultural products.

This revived interest in the resilience of the agricultural sector was driven by several recent events and phenomena, such as increasingly variable weather conditions due to global warming and large variations in food and energy prices. These are only some of the factors which could place an unprecedented pressure on the global food system in the future. [3] Within this context, it is important to gain a better understanding of how we may achieve food security for the next decades.

This article aims to offer insights into this topic by providing an overview of the major factors which will drive the global demand and supply for food, as well as some of the obstacles for the agricultural sector to respond to these challenges. In order to do this, it will present an analysis of data and projections provided by several researchers and international organisations, and in particular the Food and Agriculture Organisation of the United Nations (FAO).

In the first chapter, the two key drivers for food demand will be discussed, namely global population growth and changing consumption patterns. As these two developments will significantly increase the worldwide need for food, an estimate will be made on how much additional production of agricultural commodities these evolutions would require.

The second part will examine how the supply of food could be increased in order to respond to this surge in food demand. The three possible solutions which will be considered are an expansion of the land for food production, an increase in the agricultural productivity, and further investments in the agricultural sector.

Finally, some additional issues will be addressed that could impact the ability of agriculture to meet the future food needs. These include the limited access of farmers to finance, the fluctuations in the prices for agricultural commodities, and food wastage.

  1. Rising food demand and its driving forces

Population growth

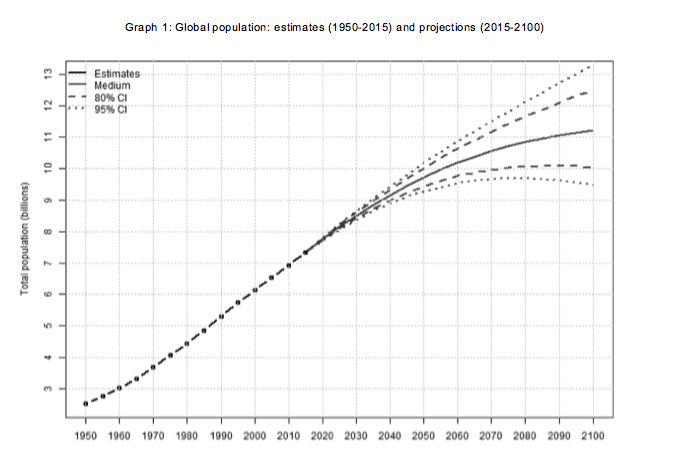
The main evolution that will increase the demand for food is a continued rise in the number of people on our planet. While the world’s population consists of 7.3 billion people today, the UN projects that this number will increase by 1.2 per cent annually, amounting to 8.5 billion people in 2030 and almost 10 billion people in 2050 (see Graph 1). [4]

Screen Shot 2015-11-17 at 12.15.16

Most of this population growth is projected to occur within the developing countries, and especially in Africa and Asia (see Table 1). [5] Of the additional 1.15 billion people that will be added to the global population between now and 2030, 46% will be added in Asia and 42.79% in Africa. In the longer term, Africa is expected to be the largest contributor, accounting for more than half of the global population growth by 2050.

Screen Shot 2015-11-17 at 12.15.33

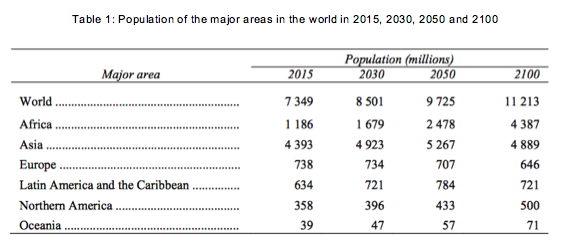
Additionally, Latin America and the Caribbean, Northern America, and Oceania are expected to have only minor increases, while Europe is the only continent that will see its population decrease in the future.

Because these demographic projections have a high degree of certainty, it is inevitable that the world’s population will grow rapidly in the short to medium term. As a result, this will lead to a major increase in the consumption of food in the coming decades and will impose profound challenges to meet the global demand for agricultural products. [6]

Consumption patterns

Global population growth will be accompanied by a change in consumption patterns of people worldwide, and especially of those living in developing countries. The two major factors driving this transformation in food consumption will be the rising incomes of these individuals and a trend towards increased urbanisation. [7]

First, the rising incomes of the people living in developing countries will stimulate dietary change, as they will be increasingly capable of buying high-quality food. [8] Secondly, urbanisation is expected to accelerate in both the developed and developing world, in the sense that there will be large movements of people moving from rural to urban areas. Between now and 2050, the share of the world’s population living in urban areas is expected to rise from 50% to 70%. [9] This increased urbanisation will prompt additional transformations in the lifestyles and consumption patterns of people. [10]

As a result of these two developments, global diets will become increasingly similar, since people who were living mainly on vegetable diets will now consume more meat, fish, dairy products, fruits and vegetables. This pattern is already emerging in the Asian developing countries today. [11]

Screen Shot 2015-11-17 at 12.16.27
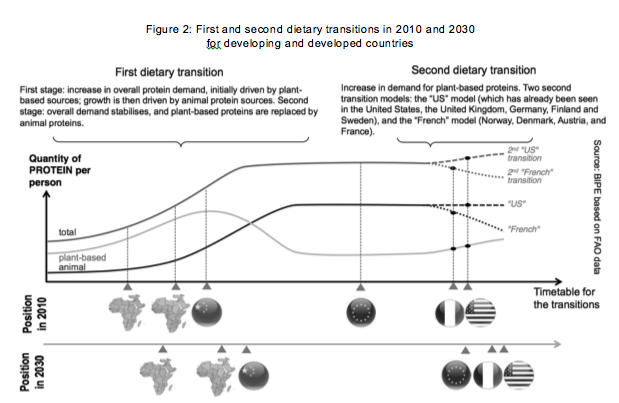
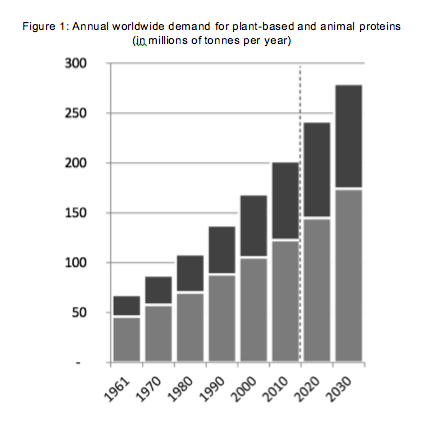
In terms of protein consumption, this will imply a global shift from plant-based to animal-based sources of proteins (see Figure 1). In this respect, a report made by BIPE argues that the developing world will continue to undergo a ‘first dietary transition’ in the next 15 years. This means that the overall demand for proteins will continue to increase in these regions. Initially, this will be caused by a higher consumption of plant-based proteins, but these will be increasingly replaced by more animal-based protein sources. On the other hand, the developed world will experience a ‘second dietary transition’: their demand for proteins has already stabilised and their consumption of plant-based proteins is expected to increase again. However, it is difficult to predict how the demand for animal-based proteins will evolve within these developed regions, as there will be diverging national trends. While the consumption of meat will stabilise in some high-income (the ‘US transition’), the demand for animal-based proteins might decline in others (the ‘French transition’) (see Figure 2). [12]

Screen Shot 2015-11-17 at 12.17.23

In general, however, it is expected that these dietary transitions will lead to a significant increase in the global demand for meat by 2030, as growing parts of the global population will be living in developing countries and/or urban areas. Since a rise in meat consumption requires higher inputs of feed grains and oilseeds, this transformation will also fuel the demand for other agricultural commodities. [13] As most of the developing regions do not currently have the means to realise this increase in meat consumption by themselves, global agricultural output will need to keep up with this surge in demand if food security is to be achieved.

The necessary increases in the production of agricultural commodities

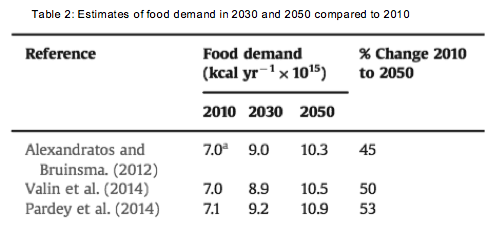
As a consequence, a growing population with changing consumption patterns will result in a sharp growth in the future demand for food. [14] According to several estimates (see Table 2), the global supply of food will have to increase by almost 30% by 2030 and around 50% by 2050 if it wants to equal the rise in global demand.[15]

Screen Shot 2015-11-17 at 12.17.57

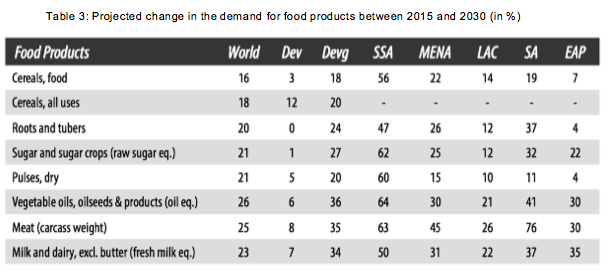
In terms of the main agricultural commodities, the additional volumes which will be required to feed the world’s population are substantial. The table below lists the expected change in demand for food for the next 15 years. Among others, global production will have to increase with 18% for cereals, 21% for sugar, 26% for vegetable oil, 25% for meat and 23% for dairy products between now and 2030. [16]

Screen Shot 2015-11-17 at 12.18.30

  1. Possibilities for additional food supply

Expanding the amount of agricultural land for food production

On the supply side of the equation, the first possibility to increase food production is by expanding the amount of farmland. According to global estimates made by the FAO, between 2010 and 2030 52 million hectares (Mha) of arable land will be added to the 1534 Mha which are already being exploited. This will amount to a rise in agricultural surfaces of 3.4% in 20 years.

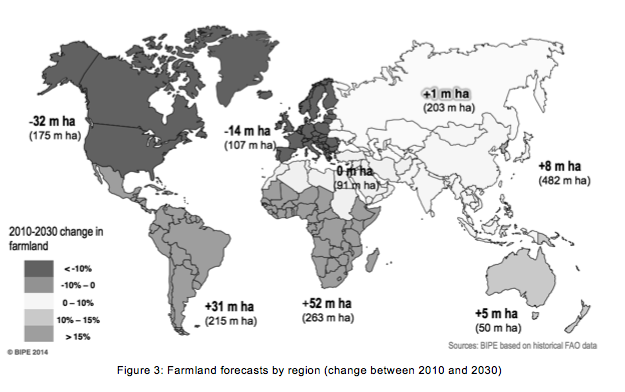
However, the FAO also expects significant geographical divergences in the evolution of these farmlands. The mobilisation of additional land will mainly take place in the developing countries: there will be an increase of 53 Mha in Sub Sahara Africa, 31 Mha in Southern and Central America, 22 Mha in South East Asia and 5 Mha in Oceania. However, this expansion will be partly offset by a decline in agricultural surfaces in the developed countries: these will diminish by 32 Mha in Northern America, 13 Mha in Europe and 14 Mha in Southern Asia (see Figure 3). [17]

Screen Shot 2015-11-17 at 12.19.08

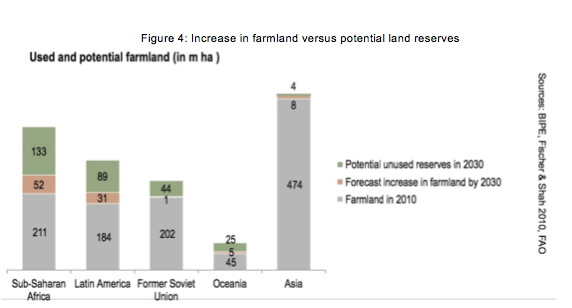
Therefore, the possibilities for further increases in arable land appear to be rather limited, since less additional land can be brought into production than in the past (see Figure 4). This means that an expansion in production area alone will probably not be
sufficient to meet the increasing demand. [18]

Screen Shot 2015-11-17 at 12.19.37

Moreover, it is likely that the agricultural surfaces in developing countries will be adversely affected by climate change. Since these countries are situated in zones where food production is rather vulnerable to variable weather conditions, the impact of climate change on temperatures, rainfall and weather disasters could pose a serious threat to their agricultural production capacities. On the other hand, the agricultural sector in developed countries, where farmland is expected to diminish, will be less susceptible to the effects of climate change due to better natural conditions and the use of up-to-date technologies. [19]

In short, while climate change will disadvantage the regions where more suitable land can be exploited, agricultural surfaces will shrink in the areas where weather conditions produce a higher stability. Therefore, the geographical shift in farmland could make the food supply more variable, resulting in a bigger volatility in the prices of agricultural products. This will especially be the case if developing countries are unable to improve their technologies and developed countries fail to increase their agricultural productivity growth. [20]

Increasing agricultural productivity

Meeting the future demand for food will also depend to a large extent on our ability to maintain or increase the current levels of agricultural productivity. Essentially, an increase in productivity is achieved when less agricultural input is needed to produce the same amount of agricultural output. In other words, improved agricultural productivity means a rise in the amount of agricultural output per unit of agricultural input. [21]

A common indicator for agricultural productivity is the agricultural Total Factor Productivity (TFP), which describes the ratio of agricultural output (crops and livestock) to their input (such as land, labour and machines). Similarly, an increase in TFP means that with the same amount of agricultural input, more agricultural output can be produced. [22]

More specifically, if the global food supply has to increase with 50% by 2050, as estimated by the FAO, this would imply an annual TFP growth of 2% for the next 35 years, provided other elements remain equal. However, this seems to be a difficult task if we look at the annual rates in TFP growth for the last decades.

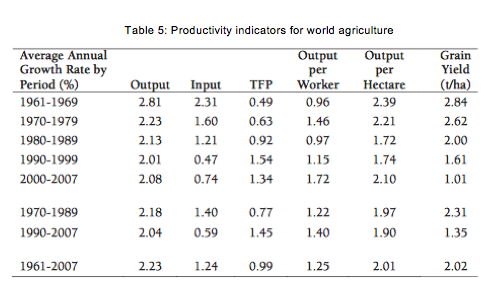
As the tables below indicate, the world’s agricultural Total Factor Productivity only had an annual growth rate of 0.99% from 1961 until 2007. Moreover, this global estimate involved diverging trends between the global regions. For instance, the transition countries of the former Soviet Union only experienced marginal increases in TFP growth until the end of the 1990s, followed by a strong rise in growth rates of 1.92% from 2000 until 2007. On the contrary, in developing countries the annual TFP growth rate experienced a constant increase until the 1990s, after which it slowed down to almost 2% per year for 2000-2007. The developed countries also peaked in the 1990s, achieving an annual growth of more than 2%, but slowed down afterwards to 0.86% for 2000-2007 (with annual growth rates of only 0.59% in Europe and 0.33% in the US and Canada). In general, this means that in nearly every region of the world, past TFP growth rates fell short of the expected annual 2% productivity rise in the future. [23]

Screen Shot 2015-11-17 at 12.20.37

Screen Shot 2015-11-17 at 12.21.38
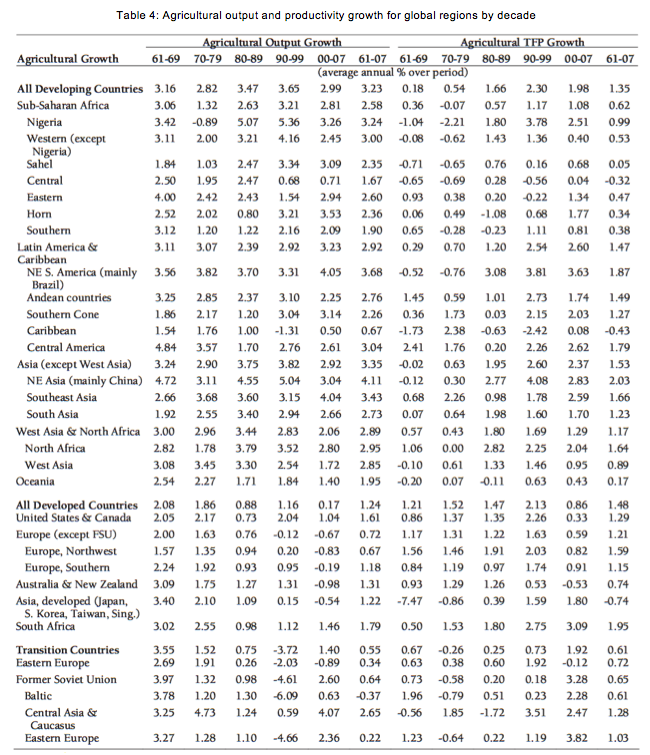
Apart from Total Factor Productivity rates, some estimates have also expressed the
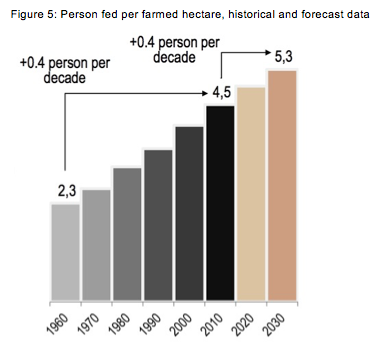
necessary short-term productivity rise in terms of the yields per agricultural area. According to the FAO, each hectare of agricultural surface has fed an additional 0.4 people per decade since 1960, and this trend should continue in the future to meet global demand for food. Since each hectare of farmland was feeding 4.5 people in 2010, this means that one hectare should provide enough food for 4.9 people by 2020 and 5.3 people by 2030 (see Figure 5). [24]

Screen Shot 2015-11-17 at 12.22.05

However, past performances do not guarantee that agricultural productivity will continue to rise at the same pace in the future. On the contrary, it is likely that productivity rates of developed countries will continue to grow more slowly than in the 20th century. [25] For example, data provided by DG Agriculture and Eurostat shows that while annual agricultural TFP growth was still 1.6% in the European Union between 1995 and 2002, productivity rates stagnated in the last decade, growing only by 0.6% per annum over the period 2002 to 2011. Only the new EU member states managed to achieve a significant TFP growth rate (1.6%) within this period, yet they account for only a minor share of total agricultural output in the EU. [26]

If agricultural TFP continues its sluggish growth in the European Union and the developed world, this could result in shortfalls for the necessary supply of agricultural products. Since the long term agricultural TFP growth is mainly determined by the level of private and public investment in agriculture, this will be an important element in meeting the growing global food demand by 2050.

Further investments in agriculture

Agricultural investments have played an important role in the growth of the food supply through technological progress, and they will be crucial for achieving a sustainable food production in the future. [27]

Screen Shot 2015-11-17 at 12.22.45

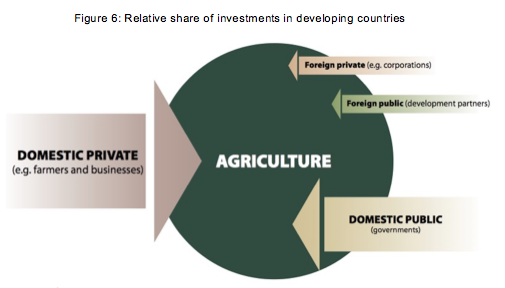
The majority of investments in agriculture are made by farmers, who purchase machinery, buy and/or raise animals, plant crops, improve their land, etc. The next largest source of investment are national governments, followed distantly by foreign private and public investors (see Figure 6). [28] Data made available by the FAO shows that in developing countries, investments by farmers are more than three times larger than the other sources of investment combined. [29]

Essentially, when farmers make investments, they give up certain things now (such as money and time) in order to build up capital that will allow them to become more productive in the future. As a result, these investments are a crucial determinant for agricultural productivity and production. [30]

A useful proxy for these private agricultural investments is the agricultural capital stock (ACS) per worker. In this sense, a higher rate of agricultural productivity can only be achieved through an increase in the amount of capital per worker. [31]

Yet according to the FAO, global ACS per worker has declined at an average annual rate of 0.5% in the last decades (from 1980 until 2007). This was caused by a slower growth in the agricultural capital stock (+ 0.6% per year) than the increase in agricultural workers worldwide (+ 1.1% per year) (See Table 6). [32]

Screen Shot 2015-11-17 at 12.23.27

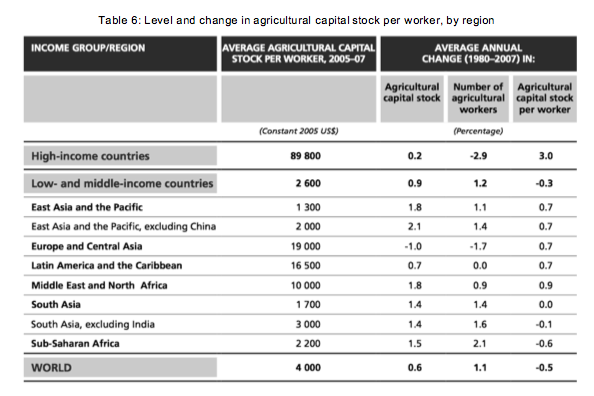
In high-income countries, the ACS per worker has increased rapidly at an average annual rate of +3%. This was not the result of a rapid increase in capital investments (+ 0.2% per year), but rather due to a large decline in the number of workers in the sector (- 2.9%). On the other hand, the capital-labour ratio diminished at an annual rate of 0.3% in low- and middle-income countries. In particular, Sub Sahara Africa experienced declining capital levels per worker (- 0.6%) as a fast growth in its agricultural labour force outpaced its increases in agricultural capital stocks. Moreover, there was a stagnation of the capital-labour ratio in South Asia since the capital stock and labour force were rising at more or less the same rate. This indicates that investments have been stagnating in absolute terms in high-income countries, while they have declined in relative terms in the lower and middle-income countries, and especially in Sub Sahara Africa and Asia.

This suggests that investments have been in relative decline in the lower and middle-income countries, and especially in the regions with the highest rates of undernourishment today, Sub Sahara Africa and Asia. The amount of agricultural investments should be increased significantly in order to boost food production and to eradicate hunger in these regions in a sustainable way. [33]

Moreover, not only has there been a small relative decrease in global private agricultural investments, but the worldwide growth in public spending on agricultural research and development (R&D) is also slowing down. As the figure below indicates, the annual growth rate in global public agricultural R&D spending has been diminishing steadily for the last four decades. In most of the regions of the world, this growth fell from rather high rates in the 1970s to significantly lower rates in 1991 to 2000, often close to zero. [34]

Screen Shot 2015-11-17 at 12.23.50

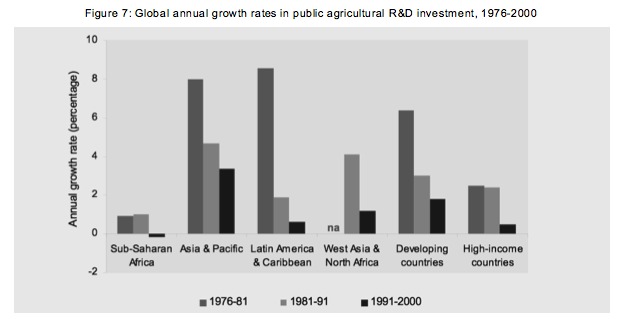
This is rather surprising, since many economic studies have concluded that agricultural R&D investments can have high economic and social returns, as they are able to increase productivity and reduce poverty over time. [35]

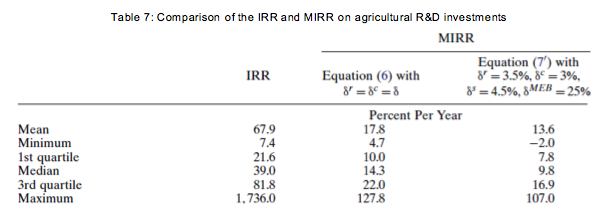
For instance, in 2014 Terrence Hurley and his colleagues conducted a meta-study in which they re-examined 2 242 investment evaluations made for different countries since 1958. They underlined that the internal rate of return (IRR) has been the predominant indicator to measure the returns on agricultural R&D investments, despite the fact that its methodology has been criticised by economists for decades.[36]

By using the modified internal rate of return (MIRR), which gives a more credible estimate on the annual interest rate paid by investments and corrects several methodological shortcomings of the IRR, they found an average annual return rate of 13.6% for agricultural R&D investments. [37]

Screen Shot 2015-11-17 at 12.24.11

If we look at this high return rate, it should be questioned why public agricultural R&D spending has been scaled back in many countries. The authors of this study state that if the growth rate in public spending continues to decline, the growth in agricultural supply will fail to meet growing food demand, which will put upward pressure on the food prices and further stress the world’s most vulnerable populations. [38]

To conclude, higher levels of investments by farmers and the public sector will be necessary to achieve global food security in a sustainable way. [39] Without these additional expenses, the production of food will probably not be able to keep up pace with a rising demand, especially in developing countries. [40]

Providing precise numbers of the necessary financial inputs to secure the global food supply is a difficult task. However, a set of reports made by the FAO estimated that, for developing countries alone, a net annual private investment of 83 billion dollars until 2050 would be necessary to strike a balance between the demand and supply for agricultural products. Additionally, the eradication of hunger by enhancing the resilience of the agricultural sector in these countries would require an extra public expenditure of 750 billion dollars in the next 15 years. [41]

Moreover, it should be noted that these figures do not even include the public and private investment needed to adapt to the effects of climate change and to achieve an environmental sustainable production system. Since it often takes a considerable amount of time before the impact of investments for agricultural productivity is fully realised, these expenditures need to be made soon in order to secure the global food supply by 2050. [42]

  1. Limiting factors for the balance between food demand and supply

Access to finance for small-scale farmers

Globally, around 500 million people can be categorised as small-scale farmers, since they possess not more than two hectares of arable land. As these smallholders constitute the vast majority of farmers in developing countries and feed a large part of the rural poor, global food security will continue to depend on their ability to supply agricultural products. [43]

However, small-scale farmers, and in particular those living in developing countries, face numerous challenges, such as low levels of productivity, restricted access to markets for their products, and especially the limited availability of finance. [44]

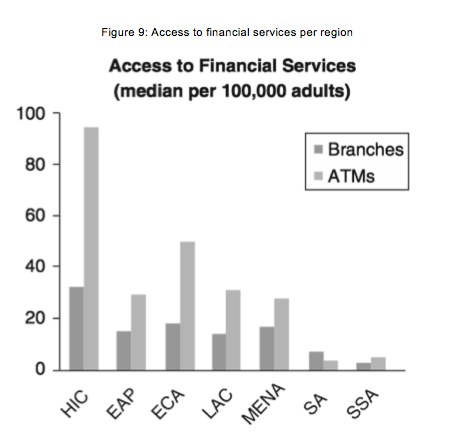
The two figures below, which are based on data provided by the World Bank, illustrate the limited access to finance of people living in developing countries. While these data represent the general access to finance across different regions and are therefore not specific to farmers and agriculture, they can nevertheless serve as a good indicator. They show that the presence of financial institutions and the utilisation of financial services is significantly lower in Sub Sahara Africa and South Asia, especially in comparison with high-income countries. [45]

Screen Shot 2015-11-17 at 12.24.55

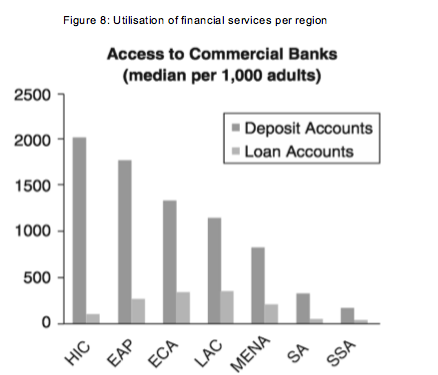
Additionally, when farmers in developing countries do have the possibilities to lend money, they are often forced to do so at very high interest rates, since financial institutions face several risks in providing their services there. Furthermore, loans for agriculture are severely underrepresented in the lending activities of commercial banks in these regions. For example, while agriculture is a key economic activity in Africa, employing more than half of the population, only 1% of commercial lending is used for the agricultural sector. [46]

Screen Shot 2015-11-17 at 12.25.19

Improving the access to finance for small-scale agriculture in developing countries is therefore an important challenge for the future, since the lack of funds prevents farmers from investing in technologies which could make their production more efficient and could reduce the levels of hunger and poverty within these regions. Better financing possibilities for these farmers could also help them to adapt to the effects of climate change and increase the resilience of their agriculture, which would contribute to global food security in the long run. [47]

This raises important practical questions on how we should improve this access to finance in these regions. How can we mobilise investments in developing countries in order to build value chains to the benefit of rural economies and local farming? How can we make the contributions of private investors, public development aid and (pan-)regional investment banks compatible? And how should we promote good governance practices to ensure a stable investment environment in these countries?

Price fluctuations for agricultural commodities

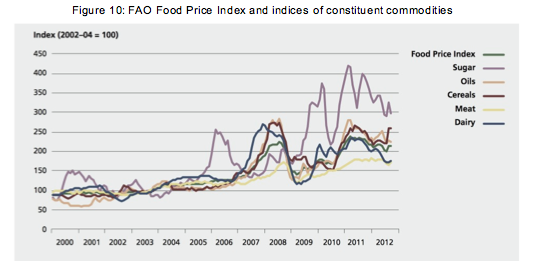
In the last two decades, food prices have been more volatile than in the preceding two decades, and these high fluctuations are likely to continue in the future. Indeed, as the graph below [48] shows, the prices of most agricultural commodities have been increasingly volatile in the last decade. [49]

Screen Shot 2015-11-17 at 12.25.46

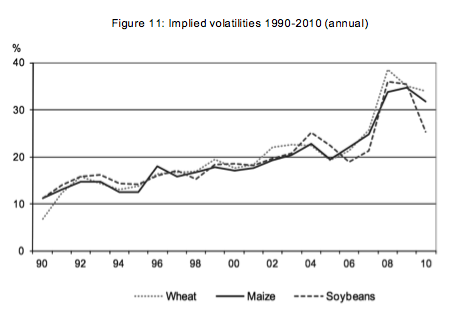
Similarly, Figure 11 indicates that the implied volatility, which is a measure for the expected price volatility among market participants, has increased significantly for the major crops in this period. [50]

Screen Shot 2015-11-17 at 12.26.10

These large variations in prices have a number of negative consequences, as they create a high level of uncertainty among producers and consumers. Moreover, they are especially problematic for farmers and households in low income countries. Since food accounts for a large proportion of their income and budget, both the welfare of these households and the viability of their agricultural production can be threatened by excessive price volatility. On the one hand, producers are more concerned about the prospect of low prices, since a lower income may threaten their viability in the long term. On the other hand, the ability of poor households to ensure their nutrition and other basic needs (such as education and health care) can be compromised when food prices are high. [51]

Additionally, farmers are less willing to invest in productivity-raising assets when prices are unpredictable, and this may encourage them to take sub-optimal investment decisions in the long term. [52] [53] Periods of price depression are a major problem for farmers who have recently made investments, both in developing and developed countries, and these may prevent them from making the necessary contributions to tackle the global food security challenge.

It is likely that these high variations in agricultural prices will persist in the future, as they will be influenced by the changes in the demand and supply factors described in the previous chapters of this article. Additionally, climate change may result in worsening production conditions for the most vulnerable regions, which could lead to even higher levels of price volatility. [54] As these developments are likely to increase the frequency of future crises in the agricultural sector, policy responses should be initiated at the macro-level, and they will need to include tools to help stabilise agricultural revenues and install a favourable climate for sustainable investments.

Food waste and food loss

A final issue that affects the supply-demand balance is food wastage, which refers to the decrease in the amount of food throughout the food chain. The FAO makes a distinction between ‘food loss’, which occurs at the production and processing level, and ‘food waste’, which takes place at the final stages of the food chain, namely the retail and consumption level. Food waste and loss have various causes and occur in many ways, but the general outcome is a lower availability of food for all people. [55] [56]

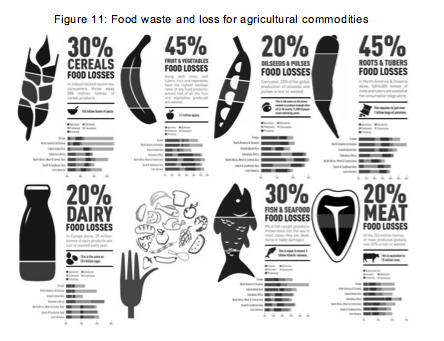
In 2011, the FAO gave significant visibility to this issue by estimating that around one third of the food produced is lost or wasted worldwide, amounting to 1.3 billion tons per year. In terms of each commodity group, 20% of dairy products and meat, 30% of cereals, 30% of fish and almost half of fruit and vegetables are produced, but never consumed. [57]

Screen Shot 2015-11-17 at 12.26.44

While these rates are as high in industrialised countries as in developing countries, these two types of countries also differ in important ways. On the one hand, food losses occur more in developing countries: they mainly face post-harvest and production losses because of insufficient infrastructures, poor storage facilities and lower technological capacities. On the other hand, food waste mainly takes place within industrialised countries. In these parts of the world, restaurants, households and stores are primarily responsible for these losses, because of plate waste and throwing away food which is spoiled or does not meet aesthetic standards.

Nevertheless, in both types of countries food is wasted between the initial agricultural production and the final consumption. [58]

The magnitude of this problem should not be underestimated, and is it not only an ethical issue. It also leads to a major squandering of limited natural resources and needless greenhouse gas emissions, which contribute to climate change and global warming. This means that eliminating waste could significantly reduce the existing pressures on the earth’s resources, such as land, water, and soil. [59]

Moreover, it is an obstacle for global food security. If food wastage can be reduced, a smaller increase in production would be needed to meet the rising demand in the next decades. For example, if we would reduce half of the food wastage by 2050, agricultural production would only need to rise with 25 percent by 2050, instead of the 50% estimated by the FAO. [60]

In short, reducing food waste and food loss could help to improve food security and diminish the pressure on the environment. In this respect, there is a shared responsibility for the actors who produce and process the food (such as farmers and food processors), those who make them ready for consumption (such as the retail sector), and finally the consumers themselves.

Surmounting the challenge of food losses and food waste will require significant investments in infrastructure, as well as increased agricultural know-how in developing countries and major changes in consumer behaviour in developed countries. Even so, the question remains how we can determine realistic targets for the reduction of food wastage which could help us to address the food challenges in the near future.

  1. Conclusion

This article examined some of the dimensions that will determine the ability of agriculture to respond to the future demand for food. It should be highlighted that this overview is not exhaustive, as several relevant aspects (such as biofuels) have been excluded from the analysis. Nevertheless, it aims to provide enough elements to stimulate a discussion on how the demand and supply factors for food may evolve in the next decades.

This study began by observing that the two major drivers of future food demand, namely a growing population and changing consumption patterns, will significantly increase the demand for food in the coming decades. This will require a substantial additional production of agricultural commodities, as the global supply of food will have to increase by almost 30% by 2030 and by around 50% by 2050 if it wants to meet the rise in global demand.

Since the possibilities for further increases in farmland appear to be rather limited, expanding the food production will largely depend on our ability to maintain or increase the current levels of agricultural productivity. This proves to be a difficult task, as historical growth rates in productivity have been lower than the expected productivity rise in the future. Moreover, it is unlikely that this productivity growth can be achieved if private investments keep declining relatively and public spending on agricultural R&D continues to slow down worldwide.

Additionally, some elements have been highlighted that could further hinder the balance between food demand and supply. As small-scale farmers have limited access to finance, fluctuations in agricultural prices remain high, and the amount of food wasted and lost is substantial, tackling these obstacles will determine our ability to realise global food security.

This raises the question of how Europe can take its responsibility and shape the outcomes of these global evolutions. The findings of this article suggest that it should not act as a helpless bystander, but rather play the role of an active participant by promoting public and private investments in agriculture, taking policy measures to manage price volatility, and increasing its efforts to reduce global food waste.

Furthermore, we should also consider how we can produce enough food for more than seven billion people without putting unsustainable pressures on our planet. A significant growth in the supply of agricultural products should be realised, but this will put increasing strains on our natural resources, which are already severely degraded. This issue becomes even more compelling if we take into account the effects of climate change on food production, such as higher temperatures, more variable weather conditions, and a higher occurrence of floods and droughts.

Meanwhile, as the regions most vulnerable to the impact of climate change continue to have the highest levels of undernourishment and are expected to have the largest increase in population growth, ensuring the food supply should also involve efforts to eradicate hunger in these parts of the world. While this does not mean that we are expecting a Malthusian catastrophe to occur in the next decades, it underlines how important it will be for agriculture to meet these daunting challenges.

References

Alexandratos, N. and Bruinsma, J. ‘World Agriculture Towards 2030/50: The 2012 Revision.’, ESA Working Paper, No. 12-03, 2012.

Bagherzadeh, Inamura, M. and Jeong, H. ‘Food Waste Along the Food Chain’, OECD Food, Agriculture and Fisheries Papers, No. 71, 2014.

Beintema, N. and Elliott, H. Setting meaningful investment targets in agricultural R&D: Challenges, opportunities, and fiscal realities, 2009.

BIPE and Avril, The Oil and Protein Sectors as a Solution for Meeting Global Challenges in 2030, December 2014

Conforti, P. ‘Looking ahead in World Food and Agriculture’, FAO Report, 2011.

European Commission, Food Waste,
http://ec.europa.eu/food/safety/food_waste/index_en.htm.

European Parliament, Options for Sustainable Food and Agriculture in the EU, November 2013.

FAO, Food and Nutrition in Numbers, 2014.

FAO, Global agriculture towards 2050, 2009.

FAO, Price Volatility in Food and Agricultural Markets: Policy Responses, 2 June 2011.

FAO, Save Food: Global Initiative on Food Loss and Waste Reduction, http://www.fao.org/save-food/resources/keyfindings/infographics/fish/en.

FAO, The state of food and agriculture: investing in agriculture for a better future, 2013.

Fuglie, K. ‘Total factor productivity in the global agricultural economy: Evidence from FAO data’, in J. Alston, B. Babcock and P. Parday (Eds.), The Shifting Patterns of Agricultural Production and Productivity Worldwide, Ames, Midwest Agribusiness Trade and Research Information Center, Iowa.

Gardner, B. Global Food Futures: Feeding the World in 2050, London, Bloomsbury, 2013.

Hofstrand, D. ‘Can we meet the world’s growing demand for food?’, AgMRC Renewable Energy & Climate Change Newsletter, February 2014.

Hofstrand, D. ‘More on feeding nine billion people by 2050’, AgMRC Renewable Energy & Climate Change Newsletter, January 2012.

Hurley, T. et al., ‘Re-examining the reported rates of return to food and agricultural research and development’, American Journal of Agricultural Economics, Vol. 96, No. 5, 2014, pp. 1312-1323.

International Finance Corporation, Access to Finance for Smallholder Farmers: Learning from the Experiences of Microfinance Institutions in Latin America, 2014.

Keating, B. et al., ‘Food wedges: Framing the global food demand and supply challenge towards 2050’, Global Food Security, Vol. 3, No. 3-1, p. pp. 125-132.

Maggio, N. et al. Global Food Security 2030: Assessing trends with a view to guiding future EU policies, 2015.

Matthews, A. What is happening to EU agricultural productivity growth, 4 May 2014.

Pardey P. et al., Investments in and the Economic Returns to Agricultural and Food R&D Worldwide, Academic Press, New York, 2014.

Rosegrant, M. ‘Global Food Security: Challenges and Policies’, Science, Vol. 302, No. 5652, 2003, pp. 1917-1919.

 The Telegraph, Gloomy Malthus provides food for thought as world’s appetite builds, http://www.telegraph.co.uk/finance/comment/liamhalligan/8363500/Gloomy-Malthus-provides-food-for-thought-as-worlds-appetite-builds.html.

 United Nations, World Population Prospects: the 2015 Revision, New York, United Nations, 2015.

World Bank, ICT in Agriculture: Connecting Smallholders to Knowledge, Networks, and Institutions, November 2011.


[1] The Telegraph, Gloomy Malthus provides food for thought as world’s appetite builds, http://www.telegraph.co.uk/finance/comment/liamhalligan/8363500/Gloomy-Malthus-provides-food-for-thought-as-worlds-appetite-builds.html.

[2] M. Rosegrant, ‘Global Food Security: Challenges and Policies’, Science, Vol. 302, No. 5652, 2003, p. 1917.

[3] P. Conforti, ‘Looking ahead in World Food and Agriculture’, FAO Report, 2011, pp. 1-2.

[4] United Nations, World Population Prospects: the 2015 Revision, New York, United Nations, 2015, p. 2.

[5] Ibid.

[6] B. Gardner, Global Food Futures: Feeding the World in 2050, London, Bloomsbury, 2013, p. 7.

[7] Rosegrant, loc. cit.

[8] D. Hofstrand, ‘Can we meet the world’s growing demand for food?’, AgMRC Renewable Energy & Climate Change Newsletter, February 2014.

[9] FAO, Global agriculture towards 2050, 2009, p. 1.

[10] D. Hofstrand ‘More on feeding nine billion people by 2050’, AgMRC Renewable Energy & Climate Change Newsletter, January 2012.

[11] Gardner, op. cit., p. 4.

[12] BIPE and Avril, The Oil and Protein Sectors as a Solution for Meeting Global Challenges in 2030, December 2014, pp. 6-7.

[13] Gardner, op. cit., p. 68.

[14] A. Maggio et al., Global Food Security 2030: Assessing trends with a view to guiding future EU policies, 2015, p. 9.

[15] N. Alexandratos and J. Bruinsma, ‘World Agriculture Towards 2030/50: The 2012 Revision.’, ESA Working Paper, No. 12-03, 2012, p. 7.

[16] B. Keating et al., ‘Food wedges: Framing the global food demand and supply challenge towards 2050’, Global Food Security, Vol. 3, No. 3-1, p. 128.

[17] BIPE and Avril, op. cit., p. 14.

[18] Alexandratos and Bruinsma, loc. cit.

[19] Maggio et al., op. cit., p. 6.

[20] FAO, Price Volatility in Food and Agricultural Markets: Policy Responses, 2 June 2011, p. 11.

[21] European Parliament, Options for Sustainable Food and Agriculture in the EU, November 2013.

[22] Hofstrand, 2012, loc. cit.

[23] K. Fuglie, ‘Total factor productivity in the global agricultural economy: Evidence from FAO data’, in J. Alston, B. Babcock and P. Parday (Eds.), The Shifting Patterns of Agricultural Production and Productivity Worldwide, Ames, Midwest Agribusiness Trade and Research Information Center, Iowa, pp. 85-89.

[24] BIPE and Avril, op. cit., p. 16.

[25] FAO, op. cit., p. 2.

[26] A. Matthews, What is happening to EU agricultural productivity growth, 4 May 2014.

[27] P. Pardey et al., Investments in and the Economic Returns to Agricultural and Food R&D Worldwide, Academic Press, New York, 2014, p. 79.

[28] FAO, The state of food and agriculture: investing in agriculture for a better future, 2013, p. 9.

[29] FAO, op. cit., p. 11.

[30] Pardey et al., op. cit., p. 95.

[31] FAO, op. cit., p. 15.

[32] FAO, op. cit., p. 18.

[33] FAO, op. cit., p. 19.

[34] N. Beintema and H. Elliott, Setting meaningful investment targets in agricultural R&D: Challenges, opportunities, and fiscal realities, 2009, p. 7.

[35] FAO, Price Volatility in Food and Agricultural Markets: Policy Responses, 2 June 2011, p. 16.

[36] T. Hurley et al., ‘Re-examining the reported rates of return to food and agricultural research and development’, American Journal of Agricultural Economics, Vol. 96, No. 5, 2014, pp. 2-3.

[37] Hurley, op. cit., pp. 4-12.

[38] Ibid., p. 12.

[39] FAO, The state of food and agriculture: investing in agriculture for a better future, 2013, pp. 36-37.

[40] Gardner, op. cit., p. 13.

[41] FAO, Price Volatility in Food and Agricultural Markets: Policy Responses, 2 June 2011, p. 16.

[42] Pardey, op. cit, p. 79.

[43] International Finance Corporation, Access to Finance for Smallholder Farmers: Learning from the Experiences of Microfinance Institutions in Latin America, 2014, p. 5.

[44] Ibid.

[45] World Bank, ICT in Agriculture: Connecting Smallholders to Knowledge, Networks,

and Institutions, November 2011, p. 153.

[46] World Bank, op. cit., pp. 152-153.

[47] International Finance Corporation, Ibid., p. 1.

[48] FAO, The state of food and agriculture: investing in agriculture for a better future, 2013, p. 99.

[49] FAO, Price Volatility in Food and Agricultural Markets: Policy Responses, 2 June 2011, pp.7-9.

[50] Ibid., p. 8.

[51] Ibid., p. 6.

[52] FAO, Food and Nutrition in Numbers, 2014, p. 8.

[53] Hofstrand, 2014, op. cit.

[54] FAO, Price Volatility in Food and Agricultural Markets: Policy Responses, 2 June 2011, p. 11.

[55] FAO, Food Loss and Food Waste, http://www.fao.org/food-loss-and-food-waste/en.

[56] European Commission, Food Waste, http://ec.europa.eu/food/safety/food_waste/index_en.htm.

[57] FAO, Save Food: Global Initiative on Food Loss and Waste Reduction, http://www.fao.org/save-food/resources/keyfindings/infographics/fish/en.

[58] FAO, Price Volatility in Food and Agricultural Markets: Policy Responses, 2 June 2011, p. 28.

[59] M. Bagherzadeh, M. Inamura and H. Jeong, ‘Food Waste Along the Food Chain’, OECD Food, Agriculture and Fisheries Papers, No. 71, 2014, p. 6.

[60] Hofstrand, 2012, op. cit.

TTIP: outline of a possible negotiation strategy for EU agri-food sector

The Transatlantic Trade and Investment Partnership (TTIP) negotiations were launched on June 17, 2013. 

TTIP aims at creating the largest Free Trade Area in the world, and at setting a host of harmonized standards between the two largest trading blocks. These common standards could, by the sheer size of the trade affected, become the de facto new world standards.

TTIPs expected level of ambition surpassed anything achieved so far, setting the pace for further trade deals and hopefully prompting other countries to move forward in the stalled WTO negotiations.

The impact of TTIP on the agriculture sector could be large, larger than any other free trade deal negotiated so far, and larger than what was expected out of the WTO Doha round (with the exception of domestic subsidies).

It is therefore hardly surprising that the reactions to the TTIP in the EU agricultural sector have been mostly cautious, defensive. The sector by and large fears the impact of concessions that could be made to a more competitive US agriculture.

Farm Europe attempts to go beyond the usual positioning, and to provide a more focused and realistic assessment of the deal. This paper also explores the dynamics of the negotiation. Some sectors might benefit, others will face additional competition. In particular with regard to those facing additional competition, Farm Europe outlines what could be done to improve the EU position.

The state of negotiations

Tariff offers were exchanged on February 10, 2014. However the initial drive to quickly conclude the TTIP negotiations (“in one tank”, as it was put at the time) has faced a set of roadblocks in a number of areas since 2014.

There were misunderstandings on what the level of ambition of the tariff offers exchanged should be, with the EU accusing the US of presenting an offer that could hardly be accepted as a basis for negotiation.

Also, a high-stake political controversy arose on the ISDS (Investor-State Dispute Settlement) chapter, with very active and vocal opponents within the EU to be found in some NGOs, and even in some mainstream political groups. That controversy found an echo across the Atlantic, with strong opposition to ISDS heard also from sectors in the US Congress.

The EU also felt a lack of commitment from the US side, explained by the fact that the US would have prioritised the conclusion of the TPP (Trans Pacific Partnership) negotiations.

The result of these drawbacks was that progress in the negotiations was lacklustre, to say the least.

Agricultural issues remain contentious, particularly those perceived as consumer safety issues – e.g. hormone treated meats, GMOs. The EU, at its highest level, was obliged to reaffirm that it would never accept imports of hormone treated meat, nor lower high EU safety standards.

Following the change in the Commission in late 2014, there was a new push to inject fresh momentum into the talks. It is still early days to evaluate the success of the new attempts to revive the talks, but there are indications that prospects are brightening.

The US President has finally obtained TPA (Trade Promotion Authority), which is seen as essential to conclude TPP and TTIP. TPA gives Congress the authority to only accept or reject in block a trade deal, preventing cherry-picking of parts, which was clearly a great concern for countries negotiating with the US.

The US and her TPP partners are now moving to the end game of the negotiation, which would free the US to turn its eyes towards the EU.

It is also to be expected that President Obama would like to leave these two very large trade deals as part of his legacy.

Therefore there are strong indications that TTIP negotiations are bound to resume and accelerate by the end of 2015, with a view to some form of conclusion in 2016.

Agricultural market access and regulatory issues will continue to be a major challenge for US and EU negotiators as they embark on more intensive negotiations.

Also of interest to these negotiations are recent farm policy reforms in both the EU and the US.

The results of EU CAP reforms, which have increased EU’s competitiveness for certain commodities (e.g., dairy and sugar), as well as the outcome of other EU FTA negotiations, in particular with Canada, are of significance to TTIP.

How far these developments will inform the EU negotiating position is an open question. It could be expected that they do not guarantee an ambitious result, in part due to concerns that further liberalisation might jeopardise the EU’s still fragmented farm sector. Moreover, EU farm organisations have taken keen note of the results of the recently agreed FTA with Canada (CETA), in particular with respect to beef and pork market access. When they extrapolate CETA to what might be the potential outcome of a FTA with the United States, a bigger and more powerful partner, they become more wary about providing additional concessions.

To compound these anxieties, and likely fierce resistance to any ambitious deal, these groups are also taking into account the offers exchanged with Mercosur, another big agriculture player. While conclusion of the Mercosur negotiations is not expected any time soon, there is a strong concern that, in the future, a deal might be reached at least with Brazil, a top agricultural exporter and competitor.

In this context, the negotiations with Japan could provide some breathing space for the most affected sectors, and help to counterbalance the impact of TTIP to a certain extent. Japan is a significant importer of meat and grain products, and the EU will play an offensive role on agriculture in this FTA.

In March 2013, the United States adopted a new farm bill, which modifies support programs for most field crops (wheat, maize, oilseeds, cotton, peanuts) by eliminating decoupled direct payments and introducing new risk management programs and encouraging the use of crop insurance, coupled with conservation requirements. US dairy support has become more market-oriented, reflecting the increasing competitiveness of this sector in world markets. Possible changes to US biofuel policy, in the form of a reduced renewable fuel standard, could also impact US crop production trends. While these policy reforms are unlikely to drastically change US market conditions, they are worth considering in the context of US farm sector expectations for these negotiations, particularly given EU largely higher tariffs and regulatory barriers.

Both the United States and the EU have complex domestic support systems, but neither side has agreed to negotiate domestic support policies in FTAs. Ironically, the U.S. justification for not negotiating on domestic support is that it will not agree to new disciplines if the EU is allowed to continue to support at high levels. While this objection could be addressed in a negotiation, neither side is likely to be motivated to negotiate domestic support.

The following summary identifies some of the key sectorial issues facing the agricultural negotiation and outlines Farm Europes positions and recommendations. It highlights the practical difficulties facing negotiators and the basic questions posed to policy-makers: how far will this Free Trade Agreement actually free up trade in protected agricultural sectors? Where do the most important EU offensive interest lie? And where is the EU more vulnerable? What are the most significant challenges and how can they be accommodated? 

General overview of Trade in Agriculture Products

In 2014, the EU had a nearly Euro 6 billion trade surplus in agriculture with the US.[1] This reflected a long-term trend of expanding exports of EU products and stagnant US imports, with the EU achieving a neutral trade balance in 1998, growing and maintaining a surplus for the next 8 years with no sign of change. In contrast, the United States has an almost $40 billion global agricultural trade surplus, while the EU has traditionally had a balanced trade account across the agricultural sector, with a very small trade deficit in 2012, the latest year for which data are available (Source: WTO).

In 2014, top US imports from the EU were spirits (Euro 3.3 billion), wine (Euro 2.8 billion), beer (Euro 1.2 billion), cheese and nonalcoholic beverages (Euro 0.7 billion each), and olive oil (Euro 0.7 billion). These are top EU exports globally, building on high quality food processing and strong brands.

Top US exports to the EU were led by oilseed products (Euro 2.3 billion), fruits and nuts (Euro 2.0 billion), spirits (Euro 0.7 billion), and wine and miscellaneous food preparations (Euro 0.4 billion each). Leading global US agriculture exports, such as beef, pork, poultry, dairy, maize, rice, and various fruits and vegetables were all less than Euro 200 million.

The simple average of US MFN agricultural tariffs is around 12%. The EU average is around twice that level (precise calculations are difficult, due to calculation methodologies for converting specific (e.g., Euro x/MT) tariffs into ad valorem equivalents (e.g., y %)). Studies generally show the average EU tariff to be two to four times the average U.S. tariff for agricultural products.

The EU has also to address a more diverse and fragmented sector than the US. A particular case at hand is that of the ultra-peripheral EU regions, where the economic and social fabric is particularly exposed to external pressures.

The EU is thus facing a paradox in TTIP: it benefits from a large and stable trade surplus with the US, but it has in general a less competitive and more protected agriculture.

Meat Products

The EU and the United States are roughly in trade balance in beef, pork and poultry products. Globally, the United States has exported over Euro 13 billion in these products per year, but exports to the European Union have never exceeded Euro 400 million. EU meat exports into the United States in 2014 were around Euro 600 million. While the US industry is a global leader in competitiveness, the EU focuses its exports on certain niches that exploit a strong reputation for high quality. In spite of the economic fundamentals, the surprising result of near trade balance in this sector is explained by high EU tariffs, low U.S. tariffs, gourmet consumers in the United States and SPS regulatory barriers.

US tariffs are relative low for these products (26% for beef outside of the large TRQ, and substantially lower for pork and poultry). EU tariffs are substantial, ranging from 40% to over 100% for most products. In addition, all three of these products face serious trade restrictions through sanitary barriers: the European Union bans beef treated with growth hormones (despite CODEX approval of these products and a WTO panel finding against the EU), bans pork treated with ractopamine (a growth promoter used in the United States and other meat exporters that has also been approved by CODEX), and bans U.S. poultry treated with pathogen reduction treatments, such as chlorine. Nevertheless, exporters in both the EU and the US have an interest in updating the bilateral veterinary equivalence agreement signed over 15 years ago.

The EU is eager to see BSE-related restrictions removed on its exports of beef products from all EU Member States, and for the US to recognise the EU as a single entity. US sanitary requirements are strong for pork and poultry also, but the EU has managed to service U.S. pork market niches with high priced products and is not considered competitive in poultry exports.

Different standards on animal welfare, which concern in particular the poultry and eggs sectors, are also an issue in the EU, where producers face higher standards and the related higher costs.

Tariff elimination in the meat sector would create a huge challenge for the EU meat and livestock sector, in particular if sanitary barriers were removed as well. The Commission (DG Agri) has estimated the elasticity of the European market to be around -5; a 20% reduction in tariffs could result in an increase in imports of approximately 100%.

As noted above, high tariffs are a constraint for US exporters, but sanitary barriers have effectively banned pork and poultry exports and limited beef exports to non-hormone production.

The EU has aggressively protected this sector in other FTAs, including in the recently-concluded agreement with Canada, but that did not prevent granting Canada preferential duty-free TRQs for pork (80,000 tons), beef (50,000 tons), and bison (3,000 tons). It is worth noting that these volumes were only reached at the last minute, and they do incorporate payment for Canadian concessions on GIs.

It should be underlined that although the EU is adamant not to accept imports of hormone-treated beef, it has accepted a TRQ for hormone-free beef. It should be expected that in TTIP the EU will also be obliged to grant significant market access to hormone-free US beef. No single sector will be excluded from the negotiations, and it is illusory to think that the beef sector, or other meat sectors, would be the odd exception. On the contrary, inclusion of beef and other meats is a necessary condition for the conclusion of TTIP from the US side, and the EU knows it.

Therefore, TTIP will inevitably have a significant impact on the EU meat sector, and in particular to the more exposed and fragmented beef production chain. The EU will have to open her beef market for hormone-free US beef, for volumes that will certainly not be lower than those agreed with Canada.

Any increase in imports will have a multiplied effect on the suckler cow sector: dairy cows constitute two-thirds of European supplies of beef to the common market. The supply of meat from the dairy cow herd is linked to the evolution of the milk market, the elasticity of this supply to the EU meat market being weak. Henceforth, the adjustments caused by the results of the TTIP negotiations will be above all bearing by the European industry of suckling cows.

The EU should rather anticipate the shock than pretend that it will not happen and try to manage its consequences ex-post. It is far better to prepare the sector to face more competition than to mend its consequences.

Farm Europe believes the key is to negotiate TRQs instead of accepting tariff elimination, and to buy enough time, through a long implementation period, to better structure the sector. In this context, the European Commission should be called to present a comprehensive plan without delay with appropriate financing means, to improve the structure of the sector, including producers and processors. 


Dairy Products

Dairy products are one of the leading EU exports to the United States, led by cheese (Euro 0.8 billion in 2014). US dairy exports to the EU totaled just over Euro 0.2 billion in 2014. Both sides have market access through lower duties on tariff-rate quotas, with the EU having substantial access to the US market through country-specific quotas obtained through the WTO. Out-of-quota duties in the United States generally range from 30% – 50%, while EU out-of-quota duties are generally in the 50% – 150%, with some as high as 250%.

Non-tariff measures are a key problem to EU exports (Grade A certification, and other US food safety rules). TTIP should be the opportunity to address these issues and find simpler and better solutions. The EU is also critical of the role played by CWT (Cooperatives Working Together) on supporting US exports. Possibly the most contentious part of the dairy negotiation, after tariff negotiations, will be EU requests for the United States to claw-back the use of six common cheese names in the US market, such as parmesan or feta cheese, and to accept to market only geographic indications (GIs) made in Europe.

The EU has consistently pushed for the widest possible recognition of its GIs, particularly in the dairy sector. The EU has shown that she is prepared to pay for the recognition of its GIs through additional concessions in other sectors, as evidenced in the recent EU-Canada agreement where the EU obtained additional protection to its GIs by accepting larger concessions in the meat sectors. The value of recognising the six GIs, which are already exported to the US market lies in balance with the additional concessions that should most probably be given in exposed sectors, like beef and other meats.

The United States is a competitive dairy exporter, pushing other countries to remove tariffs aggressively in previous Free Trade Agreements. The EU, in the aftermath of the abolition of the milk quota, should also show now a more offensive stance in this sector to expand exports of its high value added products.

Farm Europe believes that TTIP should lead to free trade in dairy products and to the elimination of regulatory trade barriers. The value of additional protection to some EU GIs should be assessed through the lens of economic criteria to make sure that the benefits outweigh the costs. 

Grains and oilseeds

Grain trade is largely composed of US exports to the EU. The United States is a leading global exporter and imports only limited quantities, usually specialty grains or product from Canada. The EU is also a leading wheat exporter, but imports rice and coarse grains and protects all grain markets with substantial tariffs. One should note, however, a gap in competitiveness in these sectors between the US and the EU which has tended to widen in recent years, and which is linked to the evolution of input costs and the stagnation of European yields.

Some access is afforded to the EU market through WTO commitments under TRQs and limits on the ‘margin of preference’ afforded to EU product compared to imports. US exports to the EU have fallen substantially from thirty years ago. In 2014, US exports were just over Euro 400 million. US tariffs on grain are low, whereas EU tariffs range from 40% to 90% (except for husked rice, which are 10% – 20%).

US maize and maize by-product exports are constrained by the EU GMO policy. This has reduced the largest U.S. grain export and limited the ability of the United States to compete for the EU’s WTO TRQ for maize established as compensation for loss of access during the Spanish and Portuguese accession to the EU.

US rice access to the EU has also benefited from terms negotiated in the Uruguay Round and the accession of the EFTA countries to the EU. Similarly, US wheat exporters have been able to gain some access to the EU market, in particular for high protein and durum wheat. However, the EU soft wheat and rice markets are both protected by high tariffs and reference price schemes. Elimination of these tariffs in a bilateral agreement would be a substantial advantage to U.S. exporters. 

In the case of wheat, the results of the EU FTA with Canada, a direct competitor to the United States for this product, are particularly relevant as EU tariffs will be eliminated. This indicates that the EU can now compete on a stronger footing. But regarding the US an issue of concern to the EU producers remains, as the new Farm Bill offers price coverage to US farmers, whereas the CAP relies on decoupled support, which is a disadvantage when prices are low.

Turning to oilseeds, the EU is a significant importer of soybeans and soybean meal, driven by structural deficits in the EU animal feed sector and a MFN tariff bound at zero in the WTO. US soybean oil exports face moderate tariffs, less than 10%, enough to slow US exports. The United States imports negligible quantities of EU vegetable oils (other than olive oil, reported with the fruit and vegetable sector.)

Despite the zero or relatively low tariffs, US soybean and products exports are restricted by EU GMO policy, as noted above. This policy could also negatively affect the EU farming sector, as GMO-free imports are more costly, thus adding to the feed costs in the EU.

The EU biofuel policy is an even bigger issue in the oilseed sector for biodiesel. Production of biodiesel is an important outlet for the EU oilseed sector, and adds a significant amount of protein as a by-product, which is beneficial to the EU feed sector that suffers from a large protein deficit. For the EU sector to compete with the US it should benefit from a regulatory framework that provides stability and room for expansion.

Farm Europe expects that the TTIP could result in the elimination of tariffs in the grains and oilseeds sector. In this case, the EU biofuels policy should enable the EU biodiesel production to expand, rather than serve to constrain it, to allow the EU to compete on an equal footing with the US. The internal distortive mechanisms in force in the Farm Bill should be taken into account by EU negotiators for any concessions such as for wheat, to ensure a level playing field for the EU sector, and specific protections should be maintained for certain highly sensitive products, like rice.


Starch and Ethanol

The EU starch industry has been constrained by a number of factors, unlike the US industry: the sugar regime limitations on the production of isoglucose, the higher maize and energy prices, and the lesser scale.

TTIP could bring about similar maize prices in the EU and the US. The end of the sugar quotas in 2017 will lift the limitations on the production of isoglucose. However, the other factors hampering the EU industry will remain intact.

The EU sector needs therefore time and investment to rise to the challenge of the competition from the US.

The same can be said about the EU ethanol sector, which relies more heavily on sugar beet as raw material, whereas in the US ethanol is made mostly out of maize. Previous and running US programmes have greatly helped the sector develop, whereas in the EU development is still at early stages. Farm Europe is therefore of the opinion that the EU industry needs time and an appropriate regulatory framework and safeguards to meet US competition.

Biofuels can be an important outlet for the EU grains and sugar producers. As biofuels production generates protein rich products, it has the potential to reduce the large EU deficit. Farm Europe believes it is time to objectively evaluate the costs and benefits of producing biofuels in the EU, and factually assess its impacts including the mitigation of the EU protein deficit, instead of succumbing to prejudice and targeted campaigns.

Fruit and Vegetables, Nuts and Olive oil

The United States has a growing trade surplus with the European Union in this sector. In 2014, U.S. exports were led by nuts, in particular almonds, pistachios, walnuts), and dried fruits.

Leading EU exports are olive oil at over Euro 0.7 billion and olives at over Euro 250 million in 2014. Some leading global US exports, such as oranges, orange juice, apples, grapes, and stone fruits have limited exports to the EU so far.

US tariffs in this sector are generally low, but a few products are still sensitive to import competition (including olive oil and olives). Olive oil standards could, however, be a sticking point in the negotiations, as US olive oil producers push for the approval of US-specific standards, which EU exporters believe will disadvantage their exports.   EU tariffs are moderate in general, but are substantial for some import sensitive products that are export priorities for the United States, such as citrus (30% tariff), apples and pears (40%), and fruit juices (50 – 150%). In addition, the application of the EU entry price system to these products effectively raises the tariff on low-priced imports to protect high prices in the EU, and reduces imported quantities even as it helps to preserve high prices in the EU market.

The sector is highly diversified, but it can be argued that the EU has its own strengths and competition from the US is cushioned by the fact that the US production is concentrated in the west coast, increasing transport costs to the EU.

There are fewer high profile SPS barriers in this sector, although food safety laws are of growing complexity and concern on both sides. A genuine regulatory cooperation and simplification could bring tangible benefits for the EU sector. While in past FTAs the EU has protected the entry price system for these products, it is possible that the EU could view resolution of SPS issues affecting their products as a trade-off for the entry price system, which targets low price imports from other origins.

Farm Europe expects that free trade and the elimination of non-tariff barriers could be, in general, beneficial to this highly diversified sector, as long as rules of origin are strictly respected.


 Wine and beer

The EU has a substantial trade surplus in wine and beer trade. US wine exports to the EU have increased, but still lag significantly behind US imports. Beer tariffs are zero in both countries (which is also the case for distilled spirits), but US wine tariffs (around 20%) are higher than in the EU (10% or less).

Trade in alcohol products is highly regulated in both countries. Eliminating non-tariff barriers is important to boost the benefits of trade. The bilateral wine agreement of 2006 envisioned further negotiations to align the two markets, which may occur in the FTA.

A package of import duties and taxes, from which US wines are largely exempt, apply to European wine exports to the US. While wines imported to the US are subject to a tax which varies depending on alcohol content, many US producers benefit from tax cuts in this area. This distortion in treatment is found on the state-level as well, where taxes and excise duties are applied to imported wines, while local producers have access to tax breaks and credits.

At the same time, the negotiations are also an opportunity for the EU to raise concerns regarding additional GI protection. However, the GI issues which remain (use of some generics and semi-generics) appear pale as compared to the value of eliminating tariffs and other barriers.

Farm Europe defends that the EU should be offensive in this sector, building on the renewed competitiveness of its sector, and concentrate its efforts at eliminating tariffs and non-tariff barriers in the negotiations.

Sugar and other Processed Products

The EU has a positive trade balance in processed products with the US. EU Exports are led by snack foods, roasted and instant coffee, spices and other consumer oriented products. US exports are led by snack foods, pet foods, and other consumer oriented products. The trade flows reflect the strength of EU brands for quality and niche products and relatively open US market for processed products.

US tariffs on processed products are generally low, unless there are dairy or sugar components in the product. EU tariffs can be substantial, as duties are based on a complex formula takes into account sugar, dairy, and starch components and calculates a duty designed to ensure the level of protection for these base products remains high. This system is generally referred to as the “Meursing Table”, and its reform has been a long-standing US objective.

As with reforms of the entry price system, the EU has been reluctant to reduce protection for processed products in bilateral FTAs. This impulse may be shared in the United States with respect to sugar-containing products, an area traditionally protected in the United States, where both the EU and US tariffs exceed 100% and where both will be concerned about importing third-party sugar incorporated into sugar-containing products.

However, for Farm Europe, the elimination of EU sugar production quotas after 2017 points to a more ambitious EU position for sugar and sugar-containing products over the longer term, as more competitive sugar production should expand as a result of this reform.  Nevertheless, special attention should be paid to specific sugar products, given their vital role in the economic development of some less favoured areas. This is the case, for example, with the EU’s outermost region and the production of so-called “raw brown sugar intended for direct consumption”, and for rum production, taking into account the very high level of subsidies in the US. In addition to that the EU should strive for strict rules of origin, as the US market is to a degree open to NAFTA (Mexico) and in the future TPP (Australia) exports.


Sanitary and Phytosanitary issues (SPS)

It is the inclusion of SPS issues that separates TTIP from other trade negotiations in agriculture. The problem is that the EU and the US maintain fundamentally different approaches to risk management. The EU follows the “precautionary principle” which in its eyes justifies banning growth promoters or GMOs (now in many EU member states). The US asserts that it applies a science-based approach.

It is difficult to conceive that the EU and the US will be able to agree on this entire chapter. But it is equally difficult to conceive that SPS issues will be left aside in TTIP. The reason is quite straightforward: tariff concessions can be voided by SPS barriers. But issues like hormones and GMOs have proven far more resilient to agreement.

What are the potential consequences? The case of hormones in beef is illustrative. The EU lost the WTO case, and is now paying compensation to the US. But the compensation deal is being contested in the US, as the benefits have diminished (due to the increased exports of other countries). Beef is one of the sectors where the EU shows a significant gap of competitiveness vis-a-vis the US. Tariff discussions will already be of great consequence. The hard stance of the EU on banning hormone beef makes it even harder for the EU sector to limit concessions in access to non-hormone treated beef.

Farm Europe expects that with the exclusion of hormones and GMOs, other SPS issues can be addressed and a mutually agreed solution found.

[1] All 2014 data is for the EU-28.

The resilience of agriculture and food production: A planetary challenge

Some things are inevitable, and rising demand for food is one of them. Yet, as is often the case, the questions of what to do about a challenge and how to go about implementing a response generate more questions than practicable policy solutions.

Between now and 2030, the Earth’s population is set to leap from 6.9 to 8.4 billion (sources UN & FAO). This is a population increase in two decades of nearly 22 % and with forecasts tending to be revised upwards rather than the opposite, we can be confident in these figures.

The trend within the trend is that the nutritional habits of people in developing countries have been changing too; their overall protein consumption has been rising and, within this, the share of animal protein in their diets has also been rising. The reason lies in a switch from plant to animal protein sources in East Asia, Latin & Central America, North Africa, and the Middle East (FAO). On the basis of these trends the FAO is forecasting a rise of 40 % in the global demand for protein by 2030.

With many of our contemporaries already suffering from hunger and malnutrition the question of just how are we going to feed the world’s rising population can no longer wait for an answer.

We simply have no choice, this is the human and geopolitical imperative of our time. It is incumbent on political leaders and policymakers to step up and be proactive.

But what action can they take? A first step should be to ask what measures can be taken in the short term, assuming no rise in production levels. Such measures would include:

  • Reducing losses in agricultural production per se;
  • Reducing waste all along the food chain ‘from the farm to the plate’;
  • Sharing the world’s available food resources more equitably;
  • Combating the unbalanced nutrition that lies at the root of many health problems (e.g. obesity).

But such measures do not obviate the need to also find new ways to produce more food. The two ways this can be achieved are:

  • Opening up new agricultural land, and;
  • Making productivity gains.

Taking these in turn:

Useable agricultural land

The earth still has unused but useable agricultural land, although it is distributed unevenly. Over the next 15 years some 52 Mha of arable land could be added to the 1534 Mha that is currently exploited.

But this overall increase masks the rises and falls that are predicted, in this scenario, to occur in different regions:

  • North America will lose 32 Mha, a % reduction of 15%), Europe will lose 13Mha, a % reduction of 11%), and South Asia will lose 14Mha, a % reduction of 11%;
  • In contrast, Sub-Saharan Africa will gain 53 Mha, a % increase of +24%. South and Central America will gain 31 Mha, (+17%), South East Asia 22 Mha, (+20%) and Oceania 5 Mha, (+12 %).

The lesson we can draw is that any growth in production that is to be achieved via opening up new arable land will therefore take place in developing countries. Of course, for this scenario to materialise, developing countries need to secure the necessary investment resources. A further uncertainty that arises is that this additional capacity will be located in regions where agricultural production depends heavily on climatic variability, a vulnerability that is only going to increase.

Regions that enjoy greater productive stability – made possible by favourable soil and climatic conditions – are going see their agricultural surface areas continue to dwindle.

The consequence of all this is that the year-on-year variations of global agricultural production could widen, which would cause commercial stock levels to fluctuate from one season to another, and which in turn would generate higher volatility in world agricultural markets.

Productivity

The key issue for the coming decades will therefore ultimately be the ability of farmers – and of the agri-food sectors in which they operate – to (1) make the investments that are needed to increase production and (2), in view of the pressing need to limit the environmental footprint of food production, switch to new farming and production practices.

How much more food is needed? According to the FAO, meeting the needs of the world’s population over the next 10 years is going to require an additional 51 Mt of meat (+16 %), 23 % more milk, 49 Mt of wheat, 57 Mt of rice and some 180 Mt of coarse grains, as well as 20 % more oilseeds – in particular to meet animal feed requirements.

According to the UN and FAO, this means that every productive hectare is going to have to feed, every decade, an extra 0.4 people. By way of context, in 2010 each hectare fed 4.9 people; this figure will rise to 4.9 by 2020 and by 2030 it will reach 5.3. In 1960 the figure was 2.3.

For this to happen, large strides in productivity will be needed – but according to the UN and FAO this will have to be achieved without a significant contribution from the African continent – despite the latter’s potential to provide new agricultural land and irrespective of any efforts that could and must be made to provide Africa with the technology and organisational know-how it needs to develop its local food production systems.

We may therefore infer that, in order to tackle the food crisis in the short and medium terms, the international organisations are implicitly relying on overall production growth to be driven by yield growth in the USA, the EU and Asia, as well as increased production driven by a combination of opening up additional agricultural land and increasing yields in South America.

A key challenge will therefore be to increase the yields from the arable land that is already cultivated. The challenge applies to all agricultural regions, including the developed exporting countries with mild climates: every additional tonne that these countries produce would be one that is available to meet rising demand.

However, even assuming progress is made on reducing waste, tackling obesity, and so on, areas where everything still remains to be done, it is clear that no individual region is in a position to meet the predicted increase in demand on its own.

Asking the 64 000 dollar question

In light of the magnitude of the short-term challenge (less than 15 years!), the 64 000 dollar question is not whether the major producing regions should or should not participate more in global trade, but how. Indeed can they? Can they play the role that is incumbent on them – so that the planet’s entire population can eat decent food?

Without wishing to use a moral or moralist tone, it would appear difficult for Europe to evade its responsibility in this regard given the particularly advantageous conditions for agriculture that it enjoys as well as its agricultural know-how. It is therefore urgent to come up with answers to the question of how.

Yet ‘how’ is a tall order. If the regions that can are indeed going to boost their production they will need to rise to a series of challenges:

  • Investing – both sustainably and coherently at different levels:
    • At the farm level: developing sustainable production techniques in a context of eminently fragile resources, adapting farms’ business & operational structures, securing finance for investment needs.
    • At the industry level: organising, positioning, financing, improving supply chain relationships.
  • Adapting to market volatility: markets are going to remain subject to stress, to unpredictable weather events and to the deeper effects of climate change – the resilience of agriculture – which includes the resilience of individual farmers – will be a determining factor for long-term production growth.
  • Introducing innovation and high-performance technologies into farms at a time when the breakthrough technologies that would be the foundation for sustainable productivity are not yet known, although certain new technologies currently being applied in agriculture do offer promising avenues.

Are we ready today to rise to these challenges? Beyond the sometimes comprehensive – sometimes less so – analyses that have been made of the situation, do we possess, today, a coordinated suite of measures that are calibrated to the scale of the challenges? It is difficult to escape the conclusion that we do not: in which case, what support do the different producing regions need to be able to mobilise their agricultural industries?

For the European Union, the pressing questions are:

  • In its external relations, to what degree is the EU able to make this issue a real priority in its trade negotiations or in its international development policy; to what extent is it able to stimulate greater production, and do so in a way that would be socially, economically, and environmentally sustainable – or in other words – achievable?
  • Turning to its domestic productive capacity; does the EU have the ability to supply international markets, as it is expected to be able to do? The European Union is virtually the only region in the world to enjoy stable year-on-year production thanks to its climate, its soils and its technology. Given that its agricultural areas are forecast to decrease in size, international organisations are relying on productivity growth to raise EU production to the levels needed to meet demand.
  • Yet, is this compatible with the fact that for nearly two decades agricultural productivity has been stagnant in Western Europe?
    • Bearing in mind the timeframes involved in animal research / plant varieties research, are there sources of socially acceptable productivity gains that could be tapped into over the short and medium timeframes (less than 10 years)?
    • What strategy(ies) should we envisage to ensure that any productivity gains achieved can be sustained/improved on over the longer term?
  • In light of the new economic and climatic context, are the conditions for a growing European agricultural sector in place?
    • The CAP has only recently undergone a new reform and the agricultural sector needs a clear and stable legislative environment in which to work.
    • In the medium term, the physiology of the CAP’s 1st and 2nd pillars needs to be revisited in view of the three interdependent challenges that the EU must meet if it is to sustain its agricultural and agri-food sectors – not to mention its rural areas: investment, sustainability, and resilience. Could switching from an expenditure-driven approach to one based on objectives and results be a way of freeing up latent potential while at the same time ensuring balanced development?
    • In the short term would it not be feasible to adjust the current CAP so that it is more effective, without altering its basic framework, in particular with a view to:
  • Enhancing its reaction capacity in relation to market shocks?
  • Helping agricultural industries to plan for – and be able to navigate through – market and climatic volatility by putting in place more practical policy tools and instruments.
  • Addressing the issue of present and future investment needs, of how to finance them, of farmer indebtedness in a context of fluctuating markets, of making the sector more appealing as a career to a younger generation of farmers?

The question of resilience, left largely to one side during the most recent European policy reforms, has today arguably become the cornerstone without which the economic and social development of the sector cannot credibly be envisaged.

TTIP : what is at stake for EU agriculture ?

Summary: The EU-US Transatlantic Trade and Investment Partnership (TTIP) negotiations were launched on June 17, 2013. TTIP aimed at creating the largest Free Trade Area in the world, and at setting a host of harmonized standards between the two largest trading blocks. These common standards could, by the sheer size of the trade affected, become the de facto new world standards.

TTIP expected level of ambition surpassed anything achieved so far, setting the pace for further trade deals and hopefully prodding other countries to move forward in the stalled WTO negotiations. TTIP impact on the agriculture and food sector could be large, larger than any other free trade deal negotiated so far, and larger than what was expected out of the WTO Doha round (with the exception of domestic subsidies).

It is therefore hardly surprising that the reactions to the TTIP in the EU agriculture sector have been mostly cautious, defensive. The sector by far and large fears the impact of concessions that could be made to a more competitive US agriculture. This paper attempts at going beyond the usual positioning, and enable a more focused and detailed assessment of the deal. Some sectors might benefit, others will face additional competition. For those facing additional competition which are the dynamics of the negotiation and what could be done to improve the EU position?

 The state of negotiations

Tariff offers were exchanged on February 10, 2014. However the initial drive to quickly conclude the TTIP negotiations (“in one tank” as it was put at the time) faced during 2014 a set of roadblocks in a number of areas.

There were misunderstandings on what should be the level of ambition of the tariff offers exchanged, with the EU accusing the US of presenting an offer that could hardly be accepted as a basis for negotiation.

Also a controversy arouse on the ISDS (Investor-State Dispute Settlement) chapter, with very active and vocal opponents in the EU, in NGOs and even some mainstream political groups, joined recently by some in the US Congress.

The EU also felt a lack of commitment from the US side, explained by the fact that the US would have prioritized the conclusion of the TPP (Trans Pacific Partnership) negotiations. The result of these drawbacks was that progress in the negotiations was lackluster, to say the least.

Agriculture issues were also contentious, in particular those perceived as consumer safety issues – e.g. hormone treated meats, GMOs. The EU at her highest level was obliged to reaffirm that she would never accept to import hormone treated meat, nor to lower her high safety standards.

After the change in the Commission late 2014 there was a new push to inject fresh momentum in the talks. It is still early days to evaluate the success of the new attempts to revive the talks, but there are indications that prospects are brightening.

The US and her TPP partners are moving to the end game of the negotiation, which would free the US to turn its eyes towards the EU.

In addition to that the US President and Congress leadership are now working to obtain TPA (Trade Promotion Authority), which is seen as essential to conclude TPP and TTIP. TPA as crafted in past occasions gives Congress the authority to only accept or reject in block a trade deal, preventing pick-and-choosing of parts of the deal, which is clearly a great concern for countries negotiating with the US. It is also to be expected that President Obama would like to leave as part of his legacy these two very large trade deals.

Therefore there are strong indications that TTIP negotiations are bound to resume and accelerate in the second half of 2015 with a view to its conclusion in 2016.

Agricultural market access and regulatory issues will continue to be a major challenge for U.S. and EU negotiators as they embark on more intensive negotiations in 2015. Also of interest to these negotiations are recent farm policy reforms in both the EU and the U.S. The results of EU CAP reforms, which have increased EU’s competitiveness for certain commodities (e.g., dairy and sugar), as well the outcome of other EU FTA negotiations, in particular with Canada, are of significance to TTIP.

How far will these developments inform the EU negotiating position?

It could be expected that it does not guarantee an ambitious result, in part due to concerns that further liberalization might jeopardize the EU’s still fragmented farm sector. Moreover, EU farm organizations have taken keen note of the results of the recently agreed FTA with Canada (CETA), in particular with respect to beef and pork access These groups are also taking into account the offers exchanged with Mercosur, another big agriculture player.

While conclusion of the Mercosur negotiations is not expected any time soon, there is a strong concern that in the future a deal might be reached including Brazil, a significant agricultural exporter and competitor.

In this context the negotiations with Japan could provide some breathing space for the most affected sectors, and help counterbalance the impact of TTIP to a certain extent. Japan is a significant importer of meat and grain products, and the EU will play an offensive role on agriculture in the FTA.

In March 2013 the United States adopted a new farm bill, which modifies support programs for most field crops (wheat, corn, oilseeds, cotton, peanuts) by eliminating decoupled direct payments and introducing new risk management programs and encouraging the use of crop insurance, coupled with conservation requirements. U.S. dairy support has become more market-oriented, reflecting the increasing competitiveness of this sector in world markets. Possible changes to U.S. biofuel policy, in the form of a reduced renewable fuel standard, could also impact U.S. crop production trends. While these policy reforms are unlikely to drastically change U.S. market conditions, they are worth considering in the context of U.S. farm sector expectations for these negotiations, particularly given that EU largely higher tariffs and regulatory barriers.

Both the United States and the EU have complex domestic support systems, but neither country has agreed to negotiate domestic support policies in FTAs. Ironically, the U.S. justification for not negotiating on domestic support is that it will not agree to new disciplines if the EU is allowed to continue to support at high levels. While this objection could be addressed in a negotiation, neither side is likely to be motivated to negotiate domestic support.

The following summary identifies some of the key sectorial issues facing the agriculture negotiation. They highlight the practical difficulties facing negotiators and the basic question posed to policy-makers on both sides of the Atlantic : How far will this Free Trade Agreement actually free up trade in protected agricultural sectors? Where do the most important EU offensive interest lie? Where is the EU more vulnerable? What are the most significant challenges?

General overview of Trade in Agriculture Products

In 2013 the EU had a nearly Euro 6 billion trade surplus in agriculture with the US[1]. This reflected a long-term trend of expanding exports of EU products and stagnant U.S. imports, with the EU achieving a neutral trade balance in 1998, growing and maintaining a surplus for the next 8 years with no sign of change. In contrast globally the United States has an almost $40 billion agricultural trade surplus and the EU has traditionally had a balanced trade account across the agricultural sector, with a very small trade deficit in 2012, the latest year for which data are available (Source: WTO).

In 2013, top U.S. imports from the EU were spirits (Euro 3.3 billion), wine (Euro 2.6 billion), beer (Euro 1.2 billion), cheese and nonalcoholic beverages (Euro 0.7 billion each), and olive oil (Euro 0.6 billion). These are top EU exports globally, building on high quality food processing and strong brands.

Top U.S. exports to the EU were led by oilseed products (Euro 2.0 billion), fruits and nuts (Euro 1.8 billion), spirits (Euro 0.7 billion), wine and miscellaneous food preparations (Euro 0.4 billion each), and wheat (Euro 0.3 billion). Leading global U.S. agriculture exports, such as beef, pork, poultry, dairy, maize, rice, and various fruits and vegetables were all less than Euro 200 million.

The simple average of U.S. MFN agricultural tariffs is around 12%. The EU average is around twice that level. (Precise calculations are difficult, due to calculation methodologies for converting specific (e.g., Euro x/MT) tariffs into ad valorem equivalents (e.g., y %). Studies generally show the average EU tariff two to four times the average U.S. tariff for agricultural products).

The EU is facing a paradox in TTIP: it benefits from a large and stable trade surplus with the US, but it has in general a less competitive and more protected agriculture. Will freer trade increase trade opportunities more for the EU than for the US? Or will the opposite be more likely?

Meat Products

The EU and the United States are roughly in trade balance in beef, pork and poultry products. Globally, the United States has exported over Euro 13 billion in these products a year, but exports to the European Union have never exceeded Euro 400 million. EU meat exports into the United States in 2013 were around Euro 300 million. While the U.S. industry is a global leader in competitiveness, the EU focuses its exports on certain niches that exploit a strong reputation for high quality. In spite of the economic fundamentals, the surprising result of near trade balance in this sector is explained by high EU tariffs, low U.S. tariffs, gourmet consumers in the United States and SPS regulatory barriers.

U.S. tariffs are relative low for these products (26% for beef outside of the large TRQ, and substantially lower for pork and poultry). EU tariffs are substantial, ranging from 40% to over 100% for most products. In addition, all three of these products face serious trade restrictions through sanitary barriers. Additionally, exporters in both the EU and the US have an interest in updating the bilateral veterinary equivalence agreement signed over 15 years ago and the EU is eager to see BSE-related restrictions removed on its exports of beef products from all EU Member States. U.S. sanitary requirements are strong for pork and poultry also, but the EU has managed to service U.S. pork market niches with high priced products and is not considered competitive in poultry exports.

Tariff elimination in the meat sector would create a significant challenge for the EU meat and livestock sector, but only if sanitary barriers were removed as well. As noted above, high tariffs are a constraint for U.S. exporters, but sanitary barriers have effectively banned pork and poultry exports and limited beef exports to non-hormone production. The EU has aggressively protected this sector in other FTAs, including the ongoing negotiations with , as well as the recently-concluded agreement with received preferential duty-free TRQs for pork (80,000 tons), beef (50,000 tons; plus a 15,000-ton TRQ for high-quality beef), and bison (3,000 tons). It should be noted that the EU is adamant not to accept imports of hormone-treated beef, but, as with the case of the CETA, has accepted a TRQ for hormone-free beef.

The key question in this sector is how far the EU can go in tariff and quota concessions, and sanitary requirements, without creating too strong an impact in its meat and livestock sector. In this context by how far do the CAP livestock subsidies and decoupled direct subsidies actually shield the sector from the impact of increased US competition?

 Dairy Products

Dairy products are one of the leading EU exports to the United States, led by cheese (Euro 0.7 billion in 2013). U.S. dairy exports to the EU totaled less than Euro 0.15 billion in 2013. Both sides have market access through lower duties on tariff-rate quotas, with the EU having substantial access to the U.S. market through country-specific quotas obtained through the WTO. Out-of-quota duties in the United States generally range from 30% – 50%, while EU out-of-quota duties are generally in the 50% – 150%, with some as high as 250%.

Non-tariff measures are a problem for trade, but possibly the most contentious part of the dairy negotiation, after tariff negotiations, will be EU requests for the United States to claw-back the use of certain common names in the US market, such as parmesan or feta cheese, and to accept to market only geographic indications (GIs) made in Europe.

The EU has consistently pushed for the widest possible recognition of its GIs, particularly in the dairy sector.

However it is questionable whether the real value of that limited recognition of GIs, which in all but one case could already be exported without restrictions, is commensurate to the additional concessions given in more significant and exposed sectors.

The United States is a competitive dairy exporter, pushing other countries to remove tariffs aggressively in previous Free Trade Agreements. In contrast, the EU has been reluctant to include dairy in trade agreements, and excluded dairy even when negotiating with inefficient dairy producing countries.

Should this position change with the end of EU milk quotas in 2015, as this will increase EU competitiveness in world dairy markets?

Grains

Grain trade is largely composed of U.S. exports to the EU. The United States is a leading global exporter and imports only limited quantities, usually specialty grains or product from Canada. The EU is also a leading wheat exporter, but imports rice and coarse grains and protects all grain markets with substantial tariffs. Some access is afforded to the EU market through WTO commitments under TRQs and limits on the ‘margin of preference’ afforded to EU product compared to imports. U.S. exports to the EU have fallen substantially from thirty years ago. In 2013 U.S. exports were less than Euro 400 million. U.S. tariffs on grain are low. EU tariffs range from 40% to 90% (except for husked rice, which are 10% – 20%).

U.S. maize and maize by-product exports are constrained by the EU GMO policy. This has reduced the largest U.S. grain export and limited the ability of the United States to compete for the EU’s WTO TRQ for maize established as compensation for loss of access during the Spanish and Portuguese accession to the EU.

U.S. rice access to the EU has also benefited from terms negotiated in the Uruguay Round and the accession of the EFTA countries to the EU. Similarly, U.S. wheat exporters have been able to gain some access to the EU market, in particular for high protein and durum wheat. However, the EU soft wheat and rice markets are both protected by high tariffs and complex reference price schemes. Elimination of these tariffs in a bilateral agreement would be a substantial advantage to U.S. exporters. In the case of wheat, the results of the EU FTA with Canada, a direct competitor to the United States for this product, are particularly relevant as EU tariffs will be eliminated for durum and common wheat.

Agreement to eliminate EU tariffs would be a substantial result for the US, even though maize exports will still face EU GMO constraints.

What would be the impact in the EU? Isn’t the EU sector robust enough to face increased competition? What would be the most affected products- e.g. rice?

Oilseeds

The EU is a significant importer of soybeans and soybean meal, driven by structural deficits in the EU animal feed sector and a MFN tariff bound at zero in the WTO. U.S. soybean oil exports face moderate tariffs, less than 10%, enough to slow U.S. exports. The United States imports negligible quantities of EU vegetable oils (other than olive oil, reported with the fruit and vegetable sector.)

Despite the zero or relatively low tariffs, U.S. soybean and products exports are restricted by EU GMO policy, as noted above. EU biofuel policy is an even bigger issue in the oilseed sector for biodiesel. The relevance of negotiations in this sector will depend on ongoing regulatory discussions.

 Fruit and Vegetables, Nuts and Olive oil

The United States has a growing trade surplus with the European Union in this sector. In 2013, U.S. exports were led by nuts, in particular almonds, pistachios, walnuts), and dried fruits.

Leading EU exports are olive oil at over Euro 0.6 billion and olives at over Euro 250 million in 2013. Some leading global U.S. exports, such as oranges, orange juice, apples, grapes, and stone fruits have limited exports to the EU so far.

U.S. tariffs in this sector are generally low, but a few products are still sensitive to import competition (including olive oil and olives). Olive oil standards could however be a sticking point in the negotiations, as U.S. olive oil producers push for the approval of U.S.-specific standards, which EU exporters believe will disadvantage their exports.   EU tariffs are moderate in general, but are substantial for some import sensitive products that are export priorities for the United States, such as citrus (30% tariff), apples and pears (40%), and fruit juices (50 – 150%). In addition, the application of the EU entry price system to these products effectively raises the tariff on low-priced imports to protect high prices in the EU, and reduces imported quantities even as it helps to preserve high prices in the EU market.

There are fewer high profile SPS barriers in this sector, although food safety laws are of growing complexity and concern on both sides.

While in past FTAs, the EU has protected the entry price system for these products, it is possible that the EU may view resolution of SPS issues affecting their products as a trade-off for the entry price system?

 Wine and beer

The EU has a substantial trade surplus in wine and beer trade. U.S. wine exports have increased to the EU, but still lag significantly behind U.S. imports. Beer tariffs are zero in both countries (which is also the case for distilled spirits), but U.S. wine tariffs (around 20%) are higher than in the EU (10% or less).

Trade in alcohol products is highly regulated in both countries. The bilateral wine agreement of 2006 envisioned further negotiations to align the two markets, which may occur in the FTA.   At the same time, the negotiations are also an opportunity for the EU to raise concerns with additional GI protection.

By how far could the EU wine sector benefit from tariff elimination? Are the remaining GI (use of generics and semi-generics) and regulatory issues a significant impediment to further EU exports?

 Other Processed Products

The EU has a positive trade balance in processed products with the US. Exports are led by snack foods, roasted and instant coffee, spices and other consumer oriented products. U.S. exports are led by snack foods, pet foods, and other consumer oriented products. The trade flows reflect the strength of EU brands for quality and niche products and relatively open U.S. market for processed products.

U.S. tariffs on processed products are generally low, unless there are dairy or sugar components in the product. EU tariffs can be substantial, as duties are based on a complex formula takes into account sugar, dairy, and starch components and calculates a duty designed to ensure the level of protection for these base products remains high. This system is generally referred to as the “Meursing Table” and its reform has been a long-standing U.S. objective.

As with reforms of the entry price system, the EU has been reluctant to reduce protection for processed products in bilateral FTAs. This impulse may be shared in the United States with respect to sugar-containing products, an area traditionally protected in the United States and where both parties’ tariffs exceed 100% and where both parties will be concerned about importing third-party sugar incorporated into sugar-containing products.

However, could the elimination of EU sugar production quotas after 2017 point to a more ambitious EU position for sugar and sugar-containing products over the longer term, as more competitive sugar production should expand as a result of this policy? By how much could the EU gain by eliminating tariffs in this area? What would be the impact on ethanol?

 Sanitary and Phytosanitary issues (SPS)

It is the inclusion of SPS issues that separates TTIP from other trade negotiations on agriculture. The problem is that the EU and the US have fundamentally different approaches to risk management.

The EU follows the “precautionary principle” which in its eyes justifies banning growth promoters or GMOs (now in many EU member states). The US asserts that it applies a science-based approach. It is difficult to conceive that the EU and the US will be able to agree on this entire chapter.

But it is equally difficult to conceive that SPS issues will be left aside in TTIP. The reason is quite straightforward: tariff concessions can be voided by SPS barriers. Some SPS issues can be addressed and a mutually agreed solution found. But issues like hormones and GMOs have proven far more resilient to agreement.

What are the potential consequences? The case of hormones in beef is illustrative. The EU lost the WTO case, and is now paying compensation to the US. But the compensation deal is being contested in the US, as the benefits have diminished (due to the increased exports of other countries). Beef is one of the sectors where the EU shows a significant gap of competitiveness vis-a-vis the US. Tariff discussions will already be of great consequence.

Will the hard stance of the EU on banning hormone beef make it even eventually harder for the EU sector to limit concessions?

[1] All 2013 data is for the EU-28.

The CAP: the most cost-effective EU policy for Finance ministers

Scope and Aims:

The scope of this Farm Europe policy paper is intentionally confined to the purely budgetary aspects of the EC’s three main policies for Member States. Drawing on figures from the previous budget negotiations, it offers a reading of the positions that Finance Ministers/Ministries from the 28 Member States will be tempted to defend in the preparatory discussions to the review of the EU’s MFF framework.

Background:

In many Member States, Finance and Agriculture Ministers do not necessarily share the same political or strategic approaches to the CAP and how it might evolve. Agriculture ministers are more sensitive to the fact that by investing in agriculture the European Union is not only investing to meet its economic and local development needs, but is also creating public goods that are essential to society as a whole. If agriculture Ministers focused their efforts to put in place policy tools that are as finely tuned as possible to their country’s specific needs, Finance Ministers have been working to preserve national drawdown and transfer spending responsibilities from national budgets to the Community budget – with, uppermost in their minds throughout their deliberations, a need for budgetary discipline.

Continue reading “The CAP: the most cost-effective EU policy for Finance ministers”

How should the EU support agriculture in all its variety?

The European Union’s (EU) agriculture is highly varied in terms of Member States’ (MS) average farm size, business type, weather, soil, social and economic conditions, etc. As well as this, technologies and markets are rapidly advancing. In order to ensure effective policy frameworks and subsequent sustainable and balanced development, public policy must take into account these variations and advances. This briefing looks at the context of the relevant public policy and agriculture in Europe and considers the key questions and discussion points that arise from this.

The 1992 Common Agricultural Policy (CAP) reform’s provision of European aid to farmers based on the surface area of land farmed has remained the case despite various other reforms and adjustments.

The 2003 reform created a system of flat-rate payments per agricultural parcel on the same basis.

The 2013 reforms saw 22 of 28 MS bring in reductions of direct payments per farm-holding per annum of above €150,000; 8 MS cap the maximum annual amount of basic payments for each farm; 8 MS introduce a system of redistributive payments with the aim of supporting single farm holdings of around the national average farm size; and 15 MS introduced a specific scheme for small farms, although only 2 provide equal value flat-rate payments to all the farms targeted by the scheme.

The concept of a single European farm has been rejected by policymakers due to the diverse conditions, and resulting variety of agricultural holdings, across MS. This diversity coupled with the profound and rapid changes in technologies and markets, and their consequences for European agriculture in terms of numbers of farmers, education etc., creates a need for public policy to provide framework conditions in which all agricultural businesses can develop and thrive.

Official figures show that of 12 million European agricultural holdings, 6 million are less than 2 ha in size with a total of 2.5% of arable land. In contrast to this, 50% of arable land is farmed by 300,000 agricultural holdings of more than 100ha. It is important to note that farms recorded by MS or the European Commission are actually only legal entities under the label of single ‘agricultural holdings’, and as such there is not necessarily a complete picture of the actual types of joint agricultural business in operation.

Read the full document attached for the discussions points.

The keys to continuous and sustainable growth of the EU food chain

This policy briefing looks at European agri-food trade and the surrounding data, policies, trends and trajectories. It also suggests numerous important key questions and discussion points.

Agriculture and agri-food constitute, together, one of the European Union’s (EU) main economic strengths. This broad sector is second only to the metal industry and accounts for 16% of European industrial turnover.

  • Agriculture has an annual turnover of €394 billion, is made up of 12 million agricultural holdings and provides full-time employment for 10 million people.
  • The agricultural base in Europe is the mainstay and lifeblood for 310,000 agri-food businesses (99% of which are Small and Medium Enterprises), which generate an annual turnover of €956.2 billion and sustain 4.1 million direct jobs in Europe.

With a total turnover of €1350 billion/year and 14 million jobs, agriculture and agri-food is not only one of Europe’s leading business sectors but also one of its principal sources of employment – without taking into account the contribution of other activities surrounding the food chain such as financial institutions, advisory entities, machinery, pharmaceutical and chemical industry, and research and innovation.

Global food demand is growing rapidly. Consumption trends are changing in developing and emerging countries in particular. Between now and 2050, the FAO estimates that world demand for agricultural products will increase by 50%. This rise is forecast in a context in which natural resources have become a fragile asset. The pressure on the environment and the threat of climate change place the challenge of sustainability centre stage, both for the agriculture sector and for citizens.

Policymakers need to put an ambition to foster the responsible, competitive and sustainable growth of the agri-food sector at the heart of European policy.

Today’s European policy responses result from:

EU external policies,

  1. the return of agriculture as part of the EU’s development and external assistance policy. In light of the challenges facing the world’s food supply, it should become a major strand of aid to developing countries with clear priorities and targeted, efficient and measurable actions;
  2. bilateral trade agreements, including in their opportunities and concessions, the real impacts of which, on both the European sectors and industries concerned and on our developing country international partners, merits closer analysis. The growth of global agriculture and food markets offers opportunities for the European Union. Seizing these requires an objective analysis of the opportunities and risks in the areas covered by each agreement, rather than basing negotiation strategy almost exclusively on multi-sectoral macro analyses.

The EU must take the political decisions necessary to foster those sectors and industries so that they are in tune with market requirements and able to plan for and adapt to change in world markets.

Numerous questions and discussion points arise from this – Read the full Policy Brief.

Strategies for strengthening EU industry and accessing new markets

This policy briefing looks at the EU’s agri-food markets, their performances, trends, and their future trajectories. It also raises key relevant questions and discussion points with regards to these markets.

In 2010 the European Union (EU) become a net exporter, but this development covers contrasting situations.

Despite the global economic situation, and while imports have stagnated, the EU has continued to increase its exports of agri-food products over recent years. By 2013, their value had risen to €120 billion, making the EU the world’s biggest exporter.

Agri-food products today account for 7% of the EU’s total exports of goods, which places them in 4th position behind engineering, chemicals and pharmaceuticals. Europe’s balance of trade in agri-food hit a peak in 2013 at €18.5 billion, part of an overall trade balance of €56.4 billion.

Since 2000, on average, 27% of EU agri-food exports have been made up of drinks and spirits – market segments that have a very specific nature. Moreover, 38% of the remainder have been made up of 14% of dairy products.

The analysis of European markets must therefore go deeper than the policy discourse of high-value added and beyond the customs classification of raw or processed products to take the degree of product processing or transformation into account: marketing strategies, risks and opportunities are not the same for well-known cheeses as they are for milk powder.

The strong performance in financial terms hides a loss of market share for the EU in the world: our exports have grown at a lower rate than the increase in value of world markets.

EU domestic markets mirror growth trends in demographics and the rise in living standards in Member States (MS), although despite this the share of household income spent on food should continue its consolidating trend. The main wellsprings of growth for the European agri-food sector will therefore come from product innovation and an effective marketing strategy that showcases the quality of European production.

While most economic studies estimate that Europe’s agri-food sector has all the potential to become an engine for growth in the years up to 2020, the question of barriers to such growth and how in concrete terms these can be overcome calls for a swift response by policymakers.

Behind the performance statistics of European agricultural and agri-food industries lies the question of their competitiveness.

The productivity of European agriculture as a whole has been stagnating or even declining for two decades; equally, the specific sectors of crops and animals have also experienced a stagnation and decline. The situation varies between the West, South and East of the EU. Average European productivity is stagnating, and the increase in productivity in, for example, the milk industry over recent years has been significantly lower than that obtained in the United States. Today, EU productivity is on average 66% of the US level.

Various questions and discussion points arise here.

Coping with environmental and economic imperatives

This policy briefing considers the EU’s policies and approaches to sustainable agriculture, outlining the motivations, guidelines, development and challenges of these. It also identifies numerous surrounding key questions and discussion points.

Consideration for the environment has been a constant in each of the agricultural reforms undertaken by the European Union (EU) over the last 10 years.

Introduced by the 2003 reform, the cross-compliance of direct payments was designed to ensure the proper observance, in the Member States (MS), of pre-existing non-agricultural statutory regulations, such as animal welfare or tackling nitrate pollution. In light of the difficulty experienced in some MS of implementing these rules and of determining penalties in case of non-respect, the Common Agricultural Policy (CAP) took the decision to link their implementation with the payment of European agricultural direct payments.

A decade after its inception, and setting aside the question of its impact, all the evidence indicates that the cross-compliance rule has been misunderstood by farmers and by the general public alike. The most recent CAP reform sought to increase the clarity of the cross-compliance requirements imposed on farmers, by trying to prioritise the content of the principle community directives in order to clarify farmers’ actual responsibilities.

Civil society has sent the agricultural world a clear message: while expecting farmers to meet our food needs, it also sees them as the custodians of our rural areas, as being responsible for the quality of our water and soil and more generally as stewards of our countryside – with a duty to preserve all of these for present and future generations.

While trusting farmers to play this key stewardship role, the impact of agriculture on natural resources continues to be singled out for criticism, despite the efforts engaged.

The 2013 CAP reform sought to establish a policy for rural areas that would bring not only economic benefits but also address the environmental question. In this regard, a new measure, greening, was introduced with the goal of combining agronomic practices with the sustainable management of the environment. Greening involves three basic requirements: (1) the responsible management of ecologically fragile permanent pastures – in their role as essential carbon sinks- ; (2) crop diversification in order to improve the agronomic quality of soils; and (3) preventing erosion, preserving water quality and biodiversity through ecological focus areas on and around the edges of arable land.

2015 will be the first year in which these new measures will be implemented. Yet even before the latest reforms have had a chance to be implemented in the field there is already an outcry from, on the one hand, those who consider that the new regulations don’t go far enough and, on the other, those who think that they are disconnected from the economic reality that farms must contend with.

Transcending such differences is a matter of urgency. To do so will require working with all relevant stakeholders to monitor and undertake in-depth impact assessment of the measures adopted by the EU.

One ambition: ambitious policies for EU agri-food systems

The EU’s ambition for agriculture and food, enshrined in the Treaty of Rome, is to meet the needs of its citizens. This ambition remains as relevant as ever and today it is coupled with recent economic upheaval, a need for sustainable and responsible production, and a responsibility to meet the needs of international partners. This policy briefing looks at agricultural policy development and the surrounding societal climate and motivations, as well as the questions that arise from these.

European agriculture was formed in the wake of WWII through its leaders’ ambition to provide food and economic development for European Union (EU) citizens. This ambition held by all MS was expressed through the Common Agricultural Policy (CAP). The CAP’s adoption was a political step of sacrificing national prerogatives and agreeing to develop the sector, rural areas and agri-businesses on a European scale – sharing resources, instruments and rules to do so. 

The CAP has borne fruit: rural areas have been economically transformed, production targets reached and EU food security realised.

The 1990s and 2000s saw the CAP become a policy for EU insiders and specialists. A comprehensibility gap opened up between citizens/tax payers and what was still Europe’s principal policy. Thus the question of EU investment in agriculture arose. Agricultural budget allocation was on the agenda throughout 2009 discussions and 2010’s EU budget for 2014-2020. 

A key goal of the 2013 CAP reforms was to reconnect agricultural policy and societal concerns through reasserting farmers’ roles in food safety, environmental stewardship and EU economic development. 

The world food crises experienced since 2007 and the visible effects of climate change have served as reminders that food security is a present concern. The challenges are:

  • to remain a producer independently ensuring a secure food supply for its citizens;
  • to produce responsibly and sustainably given the world’s fragile and limited natural resources;
  • to meet the needs of international partners given that global food security is a shared challenge, while also developing agriculture in the world’s regions. The EU is the only major agricultural region with stable production conditions and thus has a responsibility to provide a reliable supply to international markets.

Society’s awareness of the importance of ‘common resources’ such as water, air, and land has put the farmer back at the heart of societal challenges. The farmer is both custodian and manager of the environment. Citizens want and must entrust farmers with stewardship, albeit under a watchful, even critical, eye with regards to practices they are reputed to use.There is an objective convergence of interests here. There can be no management without managers, the farmers, and there can be no long-term future for agriculture without sustainable resource use.

In light of economic upheavals, creating a condition where those working in agriculture can plan a career with confidence has become a shared responsibility.

Various questions arise.