European Nutrition: which tools for the right policy?
ABSTRACT
The purpose of this study is to open the debate on the European state of art on the nutritional and market tools implemented by public policies. Improvement of mortality rate from Non-Communicable Disease (which are very much linked to nutrition habits) has gained relevance at the UN level, with one of the Sustainable Development Goal for 2030 (n. 3.4) dedicated explicitly “to reduce by one third premature mortality from non-communicable diseases through prevention and treatment and promote mental health and well-being”.
The major drivers of health problems related to nutritional habits and nutrients intakes are analysed in the following pages, and the consequent public policies that States (European and non) have used to limit the health consequences of unbalanced diets. In doing so, we tried to keep an open approach, using peer-reviewed articles to support our conclusion.We found that the most effective tool that governments could implement is educational programmes to the wider population (notably targeting the youth), in combination with educational initiatives such as Front of Package labelling on packaged food[1]. On the latter, this paper analyses the advantages and shortcomings of current systems, and advances some guidelines for further development of the tool.
[1] To this respect, the European Commission, in its Farm to Fork Strategy, advanced the initiative to have a harmonized European labelling system. Legislative proposal is expected to be drafted in 2022.
Please see it in PDF format here: Part 1, Part 2
PART I
HEALTH PROBLEMS RELATED TO NUTRITION
This first part of the study intends to give a general overview of the heath issues deriving from unbalanced nutrients intake in a person’s diet (nutrition-related diseases) and asks the underlying question: what are their impacts on European Member States (MS) public health and budgets? What are the measures that MS are implementing now in order to cure them?
The following part of the study will analyse the strategies at national level that MS have adopted in order to prevent and reduce the spread of this kind of diseases and their efficacy.
Which diseases do un-balanced nutrition habits lead to?
Diseases related to nutritional habits are widespread in the whole world and affect all kind of populations, regardless of age, sex, and geographic location. However, the most diffused in the European continent are what the scientific community refers to “non-communicable diseases” (NCD), namely obesity, cardiovascular, respiratory, and metabolic diseases, caries, hypertension, insulin resistance, fatty liver, and cancers. With the exception of diabetes and cancer, these diseases are not influenced by genetics (they cannot be inherited), and even if genetic predisposition is a factor that can lead to the disease in a person, their manifestation can be drastically reduced and/or delayed if particular attention is given to lifestyle and, notably, to eating habits.
Diseases related to salt consumption
The human body requires a small amount of sodium to conduct basic living activities such as nerve impulses, contraction and relaxation of the muscles, and the maintenance of water and minerals. It is estimated that the minimum physiological need is about 500 mg of sodium per day, but too much sodium in the body can lead to some serious health issues: cardiovascular problems such as hypertension, heart diseases, strokes, kidney diseases, as well as stomach cancer. In many cases, in fact, the kidneys have trouble keeping up with excess sodium in the blood. As sodium accumulates, the body holds onto water to dilute the sodium. This process increases both the amount of fluid surrounding cells and the volume of blood in the bloodstream. Increased blood volume means increased activity for the heart and more pressure on blood vessels which, over time, can stiffen and lead to the aforementioned cardiovascular problems (Harvard T.H. Chan; European Commission, 2012).
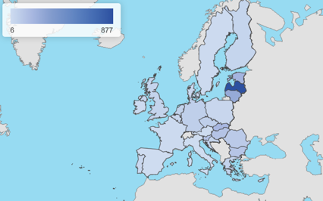
While adequate intakes of salt, according to a Harvard T.H. Chan article, should be of around 6 grams per day, the average European citizen introduces from 7 to 12 grams (European Commission, 2020c; European Commission, 2012), while the suggested amount of salt by the WHO (2015a) is 5 grams per day / 2 grams of sodium. In 2017, a diet high in sodium was accountable for more than 182 000 deaths in the EU. Image 2 shows how this figure is spread among MS.
Source: European Commission
Diseases related to fat/saturated fats consumption
Many studies show the positive correlation with the introduction of excessive amounts of fats in a diet and the manifestation of NCD such as diabetes, heart diseases, and cancers (breast, colon, prostate) (Law, 2000). There are different types of fats, and whereas some – introduced in the right doses – might be beneficial for the health (such as the polyunsaturated ones), many, such as saturated fatty acids or trans-fats, are not, even if taken into small quantities. Specific saturated fatty acids raise the blood cholesterol levels and, thus, increase the risk of atherosclerosis. Moreover, higher fat intake may increase the risk of contracting breast cancer, specifically through increased blood oestrogen levels, and, possibly, through increased obesity (Kuller, 1997).
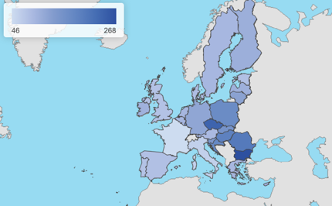
Many nutrition and health-related organisations recommend a daily fat consumption of 20 – 35% of the total daily energy intake. However, Europeans introduce an average of 37%, leading to the aforementioned health-related problems (European Commission, 2020a). Figure 3 shows the distribution of them among the EU 28.
Source: European Commission
Diseases related to sugar consumption
A slice of the European population is affected by diseases that are related to unbalanced (excessive) sugar intakes, notably overweight and obesity, that are the welcoming door to type 2 diabetes, heart diseases, liver diseases, and some types of cancer.
According to a study from the Harvard Medical school (2017), the excessive sugars for Europeans come mainly in the form of sodas & energy drinks, followed by grain-based desserts and fruit drinks. The same paper mentioned that the (US, adult) population is introducing a daily average of 24 tablespoon of sugar, while the World Health organisation (WHO) recommends six. Excessive sugar consumption leads to overload the liver. It can rise blood pressure and increase chronic inflammation and damage the lining of the body vessels, leading to a host of cardiovascular-related concerns. Sugar, especially the one introduced through beverages (Pepin and Imbeault, 2020), has been found that “tricks” the hungry sensation by working on the brain’s perception of the sweet flavour, increasing the blood sugars levels and the production of insulin[1], leading to an increased, yet artificial, perception of hunger and, eventually, to higher amounts of introduced food.
Cancers can also be the outcome of exceptionally high sugar intakes. It has been studied [Harvard Medical School, 2017] that the activation of sugar-based metabolism in a cell driven by high sugar quantities on the cell membrane causes cancer to form in the first place, developing into prostate, rectal, and pancreatic.
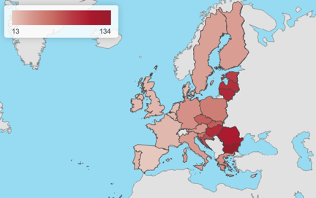
Another consequence of excessive sugar intake is the possibility to develop dental problems, notably caries. The study by Pepin and Imbeault (2020) suggests that edulcorates and sugar substitutes cause similar consequences. Figure1 shows how the deaths due to sugar-related diseases are spread among the EU States.
European state of the art
As Figures 1 to 3 in the previous pages show, Europe is not immune to NCDs. The previous paragraphs described the correlation between unbalanced introduction of some nutrients in a diet and the presence of NCDs.
European countries are home of 550 000 cases[1] and it can be noted that health problems related to nutrition has higher incidence in the Eastern states of the EU. While cultural heritage and culinary habits play an important role in the overall diet depending on the country and the regional traditions, public authorities have also tried to better educate their populations in what a healthy and balanced diet looks like and what types of proportion of nutrients should be introduced daily.
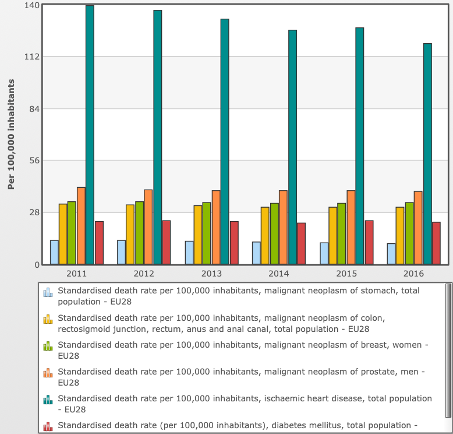
Graph 1 gathers some data from the European Commission (2018) on the deaths due to some of the above-mentioned NCDs in Europe between the years 2011-16. As it can be noted, some progresses have been made, reducing the total toll from the overall 2293 deaths per 100 thousand inhabitants to the lower figure of 2270. The major improvement has been done for heart diseases, which have been reducing permanently every year, counting for an overall reduction of 14,7% over the time-period analysed.
Concerning salt intakes, the EU action aligned with the WHO European Salt Action Network’s that aims at reducing salt consumption to 5g per day or less (WHO, 2018), and adopted a Salt Reduction Framework. Since the implementation of this Framework (in 2008), all the EU Member States, plus Norway and Switzerland, have adopted some public initiatives for salt reduction resulting in overall positive trends.
The European action for reducing fats intakes can be looked at the 2019 regulation that modifies Annex III of the (EC) 1925/2006 law, “on fat, other than trans-fat naturally occurring in the fat of animal origin” through which it set a maximum limit of trans fat of 2 g per 100 g of fat, and the obligation for business to inform on the amount of trans-fats in foods (European Commission, WHO, 2015a). There are also many voluntary initiatives, often as a result of a collaboration between industries and governments. Examples of it are the voluntary goal for product reformulation, the collaborative development of alternative foodstuffs with low trans-fats content, the production of standardised voluntary labels (WHO, 2015a)
As far as European actions targeted at reducing the sugar intakes, no specific legal initiatives have been taken at European level, leaving it to the national sphere of action and to the voluntary efforts made by the food industry. Non-binding actions have, however, been taken by the EU Framework for National Initiatives on Selected Nutrients in 2015, where the objective of reducing by 10% the added sugars by 2020 compared to 2015 levels was stated.
Economy of Non-Communicable Diseases in the EU
The setting just outlined is due mainly to lifestyle. It is said that more than half of these cases could be avoided if an effective prevention attitude would be followed. Physical inactivity, diet, smoking and excessive alcohol consumption are the leading causes of NCDs in Europe and worldwide. Non-communicable diseases represent a burden also for the European health systems accounting for at least 0,8% of the European GDP. Each year, public health systems in the EU are asked to pay €115 billion for the treatment of diseases that could have been otherwise avoided[1].
The totality of the EU MSs offer to citizens free health services which are, most of the time, one of the major voices of liabilities in public budgets. The years following the financial crisis of 2008 and the strict fiscal rules implemented all over Europe have had consequences on public health programs budgetary cuts, demanding to the health infrastructures and personnel to keep their usual services with less resources available. The natural consequence of such a policy resulted in a decreased efficiency and in a crippled hospital system all over Europe. Only in recent times, because of the renewed attention due to the Covid-19 global pandemic, States are starting to dedicate increased financial envelops to health programs in their budgets with the hope to restore the efficiency of a well-functioning public health system. However, even if investing in the infrastructure might solve short-term problems, the long-term solution stands in the roots, in this case, on prevention.
In this context of health infrastructures weighted by the Covid-19 virus and increasing public debts all over Europe, it seems reasonable for the public decision-maker’s point of view to find ways of improving the State efficiency and the citizens’ health by investing in measures that could lead in the middle term to save public finances and improve health infrastructures. Prevention on non-communicable diseases and, notably, on nutrition & diets, should receive renewed attention from governments in the EU as a tool to improve citizens’ health and cut inefficiencies, financial losses. The new budgetary Health4Eu European programme for 2021-2027 could be the starting point for setting the guidelines of a European harmonised policy on nutrition & diets.
Legislative framework
At the European level, regulation 1169 of 2011 on Food Information to Consumers (FIC regulation) aims at giving a general framework for informing customers about nutrients to be found in their food, so to, eventually, make the citizens more aware of the compositions of their diet nutrients-wise. The regulation was a starting point, but it resulted in the proliferation of many different tools that might just confuse the population. Moreover, the data from the WHO show that since its application in 2014, the trend in non-communicable disease did not seem to have changed in the EU[2].
Besides it, the European action is mainly based on the UN guidelines in its commitment to “supporting EU countries in their efforts to reach the nine voluntary targets of the United Nations and the World Health Organisation by 2025, as well as Sustainable Development Goal 3.4”. In doing so, the Commission set up a Steering Group on Health Promotion, Disease Prevention and Management for Non-Communicable Diseases, and carried out a reflection process “in order to identify ways to optimize the response to non-communicable diseases and the cooperation between EU countries” (Council of the European Union, 2013)
More specifically related to the WHO, all these policies find their place in the European strategy and vision for its health programme and action, notably in the “European Food and Nutrition Action Plan 2015-2020” (WHO, 2015b) according to which, the European region will be able to “achieve universal access to affordable, balanced, healthy food, with equity and gender equality in nutrition for all citizens”, with the final aim “to avoid premature deaths and significantly reduce the burden of preventable diet-related non-communicable diseases, obesity and all other forms of malnutrition”. The document sets the political regional objectives/priorities for the European States to reach by 2020, notably:
- To create healthy food and drink environments;
- To promote the gains of a healthy diet throughout the life-course;
- To reinforce health systems and promote healthy diets;
- To support surveillance, monitoring, evaluation and research;
- To strengthen governance, inter-sectoral alliances and networks for a health-in-all-policies approach.
More recently, the Von der Leyen Commission proposed the “Farm to Fork Strategy” (F2F) as the agricultural branch of the more holistic Green Deal (European plan to decarbonise its economy by 2050). In this strategy – as well as in other complementary actions advanced by the same Commission (DG Sante’s European Beating Cancer Plan & Health4EU programme) – the European Commissions has proposed to come up with legislative initiatives on a harmonised front-of-package nutritional label, as well promoting actions to reduce the consumption of meat and alcohol, and revise the fruit & vegetable provisions for schools.
[1] According to some other sources (a letter to Agricultural Commissioner signed by health and food NGOs sent on September 3rd, 2020), this figure amounts to €700 billion per year. Among the signatories, the representatives of the Association of European Cancer Leagues, European Heart Network, European Medical Student’s Association, European Oncology Nursing society, European Public Health Alliance, Safe Food Advocacy Europe).
PART II
PUBLIC POLICIES IMPLEMENTED TO PREVENT HEALTH PROBLEMS RELATED TO DIET
Given the situation at the European level, and the striking positive correlation between nutrition and health problems, some States have implemented public policies aimed at improving the general citizens’ health. The most common ones are educational tools, communication campaigns, and fiscal policies (taxation / subventions). Depending on the policy, and on the population cultural characteristics, some public policies have shown to be more effective than others.
The list of policies from which the public authority can choose is wide. The most analysed in literature, however, are:
- Taxation: high tax on “unhealthy” foods and low tax on “healthy” foods; subsidies for “healthy” foods; “healthy” food income support;
- Restriction for unhealthy food marketing on media (especially for children’s food);
- Healthy school food policies;
- Front-of-package food labelling; nutrient declarations; food claims regulations;
- Food composition targets;
- In-store healthy food policies;
- Private workplace food policies;
Generally, studies have shown that the most effective policies in modifying behaviours towards food and health food perception are taxation (despite the fact that it has been noticed a discriminatory effect towards lower socio-economical groups), and educational policies (labelling included).
In fact, according to the meta-data analysis done by Grummon and Hal (2020) – who analysed 23 experiments, representing more than 16 000 individuals – food and beverage warning policies are particularly effective on the population, notably in the “changing of behaviour, as well as emotions, perceptions, and intentions” when purchasing a “marked” food product. The authors noted that “warnings elicited stronger negative emotional reactions and more thinking about the health effects”. They consider two types of warnings on food: “nutrient warning”, and “health warnings”. While the former is represented in the form of messages that alert consumers that a food or a beverage has a high amount of (a) harmful nutrient(s), the latter describes health harms of a particular product (as shown in figure 4). It has to be added, however, the existence of Front of Package (FOP) types of labels. A tool that aims at informing the consumers about the amount of nutrients in a product, helping them in the interpretation, and, eventually, the choice, of the healthiest food.

There is no shared view, however, on pricing policies on food: according to Pfinder et al. (2020), taxation could be a possible solution for improving the public’s food habits, but it is not the most effective tool. For instance, they discovered that after the implementation of the Hungarian tax on sugar-added foods, the mean consumption decreased only by 4%[1]. For Eyles et al. (2012), “food taxes and subsidies have the potential to influence food consumption and health considerably, particularly when such taxes/subsidies are large (around 15% of the product price or more)”.Nevertheless, other studies (Mahesh et al., 2017) show contrasting results, classing “minimizing taxes on healthy foods”as the best solution, and “nutrient declaration on packaged foods” as the least recommended one.
At any rate, the efficacy of education campaigns was not put into questions by any study.
EDUCATION campaigns
Surely the best fit-for-purpose tool that governments have at their disposal to improve citizens’ health is education. Through education, it is possible to form citizens and allow them to understand the benefits of a healthy diet and the risks factors leading to NCDs. Moreover, if the educational campaign is successful, especially if it targets young people, it is a life-long investment in people’s lives, it benefit the population at large, and it can reduce public expenses and increase the efficiency of public hospital services.
If education is by far the theoretically most effective tool, it does not come without shortcomings. The main one being the selection of the targeted population, given that a whole-population-educational effort is virtually, and practically, unlikely. In fact, the downside of educational tools is that they are not highly effective on, notably, older population that has consolidated purchasing habits and an already settled mindset towards their diet. That leaves the debate open on the kit of tools to use so to not leaving anyone behind and improve the health of all societal age-groups towards food purchasing choices[2], each group being different from the other and requesting well targeted approach.
It has to be considered, however, that the concept of nutritional education finds its basis not only in public-lead campaigns, but also and mostly from informal/affective dynamics developed, notably, by the inner familiar and societal circles. Due to that, the conception of food changes into something more than just simple and objective nutrients that are needed to be introduced in order to survive, but into something that delivers a cultural message to which are linked emotions, memories, traditions, private affections and stories intertwined with the personal sphere of experiences. When the nutritional information is coming from an outside-the-inner social circle, such as the public authority, it can be perceived by the targeted population as an imposition that clashes with previous knowledge[3]. Public authorities should consider delicacy in their interventions and foresee the possible social reaction that any kind of policy might have on its citizens.
Examples
Examples of educational activities on nutrition are not missing and can be found in many States. The literature, however, is predominant of experiences in the U.S.A, a country that stands out for its particularly productive activities in this field, involving nutrition education classes, fact sheets, newsletters, individual counselling guides, and lesson plans for schools. It also created specific programmes targeting different groups of population, such as the Food Stamp Program (targeting the low-income families and children), the Special Supplemental Program for Women, Infant, and Children, and the Child Nutrition Program, and many more, together with communication campaigns (Institute of medicine, 2006).
Nutrition in schools represents a high percentage of the public effort to educate people towards a healthier diet, notably, the youngsters who have not developed consolidated purchasing and food habits yet. Targeting youth has the beneficial double effect of educating them at an early age (to low-sugars and low-salt tastes) – that will stick as growing up -, and to target also, as a positive externality, the families of the children (parents and siblings) that will be affected by the teachings through the student’s eating behaviours.
Nutrition in schools’ programs not only involve teachings and front lessons and trainings, but also the development of balanced menus in the school canteens aiming at the understanding of the relationship between diet and health, identifying and selecting the healthful foods, nutrients, and their food sources.
Some promotion campaigns towards “Fruits & Vegetables” in schools have been implemented and financed by the Common Agriculture Policy budget in Europe in previous years but at a limited scale, with in some members states very limited implementation leaving a large part of the financings unused, and with, therefore, very few results.
Moreover, it has to be noted the presence in schools of “competitive foods”, such as snacks and beverages at the vending machines, that tend to be lower in nutritional value and higher in calories, fat, salt, and added sugars. They represent a “temptation” and therefore a product that students should avoid. Public policies should as well consider this side of the nutritional outlook of students and take action towards reducing their exposure to competitive foods. So far, no policy in this sense has been implemented.
At the European level, public policies in food education in schools have been implemented since the ‘70s with the European School Milk Scheme, the School Fruit and Vegetable Scheme, and the Schools for Health in Europe network.
The current EU legal framework combines since 2017 two previous schemes (for milk, and fruit &vegetables, respectively into force since 1977 and 2009). Every seven years it allocates around €1.75 billion to Member States (€250 million per school year)– to be divided into different percentages for the provision of milk and fruits & vegetables-, split among them based on their school age population. On top of that, every Member State can decide to add any amount of money they decide.
The majority of EU Member States (MS) adopted specific policies: for instance, some implemented canteen services in schools where students can get a balanced-in-nutrients meal and the consequent national laws for the quality standards of the food; others the introduced nutrition education in the form of the school curriculum (France, Portugal, Sweden), or cooking classes; policies targeting very young children, such as the Irish “Aistear” (the early childhood curriculum Framework); the creation of alternative communication tools, such as the Portuguese “Food wheel” , and many others (Weichselbaum et al., 2011).
However, regardless of the efforts made by States and EU institutions, children health related to nutrition remains an issue to solve. For instance, the incidence of diabetes in school-age children has been growing in Europe (Green et al, 2000; Patterson et al, 2012). A revision of these schemes should follow by the EU institutions as well as at National level.
The European Commission’s legislative initiative framework of the Farm to Fork (FTF), among other actions, foresees, during 2023, to advance a legislative proposal to review these programmes “to enhance its contribution to sustainable food consumption and in particular to strengthen educational messages on the importance of healthy nutrition, sustainable food production and reducing food waste”.
The review of these programmes should be an opportunity to redesign the action of the European Union towards education at a early age in order to make it more effective and truly fitted for purpose.
It may be the right time to define a European large scale inclusive program focusing on:
– all schools and all children (and teenagers) at school;
- interactive and multidisciplinary cooking, food and nutrition courses making the link in an adapted way according to the age groups with biology, the seasonality of productions, philosophy, culinary art, medicine, etc.;
- promoting the right use of all foods;
– co-information campaigns targeting students’ families;
– incentives for canteen procurements to not only provide balanced but also good and tasty meals. Today proposing balanced meals but not-tasty ones at a low price is the preferred choice by the public schools. However, the underlying flow of the logic is the correlation that children might follow: if canteen meals = balanced, then balanced = not good. Public authorities must recognise the fact that “good” and “balanced” meals come at a higher ecumenic price.
– banning ultra-processed products from schools;
– asking for national co-financing (from public or private funds);
– for adults, promoting “private & public working places”. For example, European funding programmes could foresee additional incentive to privet-public projects: these could be recognised as training programs for employees, and the company that puts them into practice could be granted tax incentive (suc a specific percentage deduction of the taxable results). In this way, the companies would be much more incentivised in putting them into place.
Front of Pack Labels
[1] Even if the authors express their uncertainty on the methods used by the reviewed studies and on the lack of further detailed information.
[2] An issue that is considered in the European Food and Nutrition Action Plan 2015-2020 (WHO, 2015) in the objective n°2, by “taking into account the needs of different age groups” and considering that “pre-school and school settings represent excellent entry points, but [that] attention should also be given to opportunities to reach the active and working-age population”.
[3] That is very well portrayed by the Italian reaction to the Nutri-Score FOP label, which depicts some traditional Italian food and ingredients as unhealthy and suggests a moderate usage. The Italians felt that the Nutri-Score was (negatively) “judging” something that is very closely related to a cultural trait very important for the Southern Europe State such as it is food and traditional products, resulting in a harsh “crusade” against the Nutri-Score.
Given the importance of the initiative at the European level to harmonise front of package labels on packaged foods, as it is stated in the Farm to Fork Strategy, and the impact that this tool would play in educational matters for youth (as a complementary tool) and adults (in increasing sensibilisation on the matter of malnutrition and helping them in the healthier choice), Front of Package (FOP) Labelling requires a full session of this chapter.
Why Front-of-pack labels can be part of the solution
Information on the food label is intended to enable consumers to compare products (of the same category) and make informed choices about foods and beverages that best meet their nutritional needs. The U.S FDA (Food and Drugs Administration) research (Institute of medicine, 2006) has shown that about half of the adult consumers use food labels when purchasing a food item for the first time, in particular to assess its levels of fats and calories. The European Union sets a general framework on the workings of the Front of Package National Labels (FOPNL) in Regulation 1169/2011, which combines the two directives on “Labelling, presentation and advertising of foodstuff (13/2000/EC) and on “Nutrition labelling for foodstuffs” (496/90/EEC). The regulation sets out some improvements in the clarity of the information concerning the FOPNL, making the following rules binding for MS standards. The limits and obligations that the regulation introduces can be summarised in the following points (Official Journal of the European Union, 2011; European Commission):
- Improved legibility (minimum font size for mandatory information)
- Clearer and harmonised presentation of allergens for prepared foods in the list of ingredients
- Mandatory allergen information for non pre-packed food, including in restaurants and cafes
- Requirements of certain nutrition information for majority of pre-packed processed foods
- Mandatory origin information for fresh meat from pigs, sheep, goats and poultry
- Same labelling requirements for online, distance-selling or buying in a shop
- List of engineered nanomaterials in the ingredients
- Specific information on the vegetable origin of refined oils and fats
- Strengthened rules to prevent misleading practices
- Indication of substitute ingredient for “imitation” foods
- Clear indication of “formed meat” or “formed fish”
- Clear indication of defrosted products
From this starting point, every MS can implement a “tailor-made” FOP on pre-packaged foodstuff within the national territory, after notification and approval of the services of the European Commission. Indeed, many States have adopted specific labels that, even if they all follow the indications contained in the 1169/2011 regulation, they all look very different (design-wise), display different information, and underline different characteristics of the product, leading, eventually, to different purchasing choices.
The benefits of improved food information from the costumers’ point of view have been shown that has positive effects on their choices while grocery shopping. In fact, according to the study conducted by Himmelsbach et al. (2014), “accessing the nutrition label had a stronger positive effect in driving healthier choices than the ingredient list, possibly because the more structured design of the nutrition label is better suited to show relevant food information (amounts in particular)”. Besides, the European Food and Nutrition Action Plan 2015-2020 (WHO, 2015b) foresees the usage of FOP labels, arguing as follows:
“Front-of-package labelling can facilitate consumer understanding of the nutritional content of many foods, especially complex processed foods, and might also have an effect on diets by encouraging food producers and retailers to reformulate their products. Easy-to-understand or interpretative front-of-package labelling can limit consumption of foods high in energy, saturated fats, trans fats, sugar or salt in the context of overall improvements to the nutritional quality of diets”
Tarabella and Voinea (2013) also argue that the placement of nutrition information on the front of food packages, in order to supplement the more complex nutrition table on the back, is supported by customers as a method of providing simplified and visible nutrition information. They also point out that consumers generally understand the link between food and health and most of them have an interest in using the nutritional information. Moreover, the 2020 report from the European Commission’s Joint Research Centre (JCR) states that “as regards measured understanding, studies show that most FOP labels have a positive effect on the ability of consumers to identify the healthier option compared to a non-label situation”, and at the same time that “FOP labelling could increase the number of people choosing a more nutritious food option by about 18%”.
FOPs could be, therefore, credible and effective tools, and that is why the EU Commission considers it as one of the elements in the toolbox to educate citizens healthier diets. The challenge is represented by the still present national barriers on food perception and National Daily guidelines (or Reference Intakes), whereas a harmonised labelling system not only could help to improve public health all around Europe, but also can have beneficial effect on business, notably on packaging costs, and food analysis.
However, a European standard solution will be difficult to design considering that studies have shown that different countries have different priorities in how they use food labelling and that the efficacy of such a tool changes according to the country (and to the type of FOP). For example, southern Europeans, in particular Italians, are distinct in wanting to eat 100% wholesome and natural foods, with less regard for calories. 50% of Italians check for food additives while only 30% check for calories on food labelling (European Commission, 2008). Thus, the European solution should look at the national cultural attitudes towards food and find the good balance between standardisation, cultural sensibility, single market requirements, and flexibility. Surely not an easy task.
What should be improved in current FOP?
At the moment of writing, several FOP labelling systems are adopted by EU countries. Even if all of them share the common purpose of improving nutritional choices for the European consumers, none reaches it fully. The main obstacles can be summarised in the following:
Misleading: in the impact assessment done before the latest renovation of the current EU legislation on food labelling (European Commission, 2008), the European Commission states that the purpose of any FOP is to “have labels that are simple, legible, understandable and not likely to mislead”. Whereas we can agree with the respect of the first three standards of current labels, some do not comply with the last one, given the fact that they might create judgemental sentiments towards foodstuff itself, and towards the person buying it. Furthermore, the fact of having more than one FOP system in different MS is an additional factor that might lead to confusion among consumers.
Maintenance of the correct functioning of the Single Market and the non-disruption of it: the presence of a large number of schemes could affect the performance of the internal market. Due to divergent regulation in Member States, private operators active in more than one national EU market would be directly or indirectly led to make use of different types of rules depending on the territory on which they operate. The European Commission (2008) was already trying to reach a “harmonised implementation” while “ensur[ing] the smooth functioning of the internal market” to “simplify technical requirements and remove unnecessary administrative burden” so to “create a pro-competitive market environment in which dynamic, efficient, innovative operators can make full use of the power of labelling to sell their products” back in 2008 at the occasion of the revision of the regulation. But then as for now, these principles are of extreme topicality when considering a possible update of the current regulation and, possibly, a European food-label standard.
Distracting: FOPs are supposed to bridge the customer towards a more complete information about nutrients of the foodstuffs. Nevertheless, the way the main current FOPs are designed induce the consumer to only look at the FOP itself, making them neglect the analysis of the more complete Back of Package label that contains more specific information.
Marketing tool: it should be avoided that FOP labels that are intended to deliver objective and unbalanced information to become a marketing tool as any other.
Need for more clarity: both in studies done before (impact assessment) and after (TNS, 2014) the approval of the current FIC regulation, most of stakeholders agreed that there is a need for more clarity and understanding regarding food information. However, it has been confirmed the utility of food labelling and their impact on the health of the consumers. This tool is an effective one given its direct and immediate communication channel to the final user, and the potential information it is able to deliver, forming, hopefully, stable healthy behaviours.
Moreover, we should asked ourselves whether the current FOP systems answer to the more general needs of a neutral tool, namely:
- to keep as a milestone the objective principle for which nothing is good and that nothing is bad per se, but it depends on the quality and the quantity used and eaten;
- when it comes to nutrition policies, there should not be a dual society, meaning that socio-economic differences should not play a role in the possibility for a customer to have access to the healthier option (which is, generally, also the more expensive);
- to consider the decision-making process of the consumers is of outmost importance in order to understand the choices during grocery shopping;
- Nutrients introduced by people are the outcome of diets, not single ingredients, nor dishes. It is important to inform and educate the public on diets and the management of its components;
- Eating is not only about introducing nutrients, but it represents pleasure and emotions. Forbidding or accusing some products is a counterproductive tool since it will lead to compensatory behaviours.
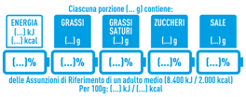
All of the FOP that are being analysed in this paper are complementary ones, therefore voluntary. In fact, according to regulation 1169/11, every pre-packaged foodstuff sold in the common market is required to display on its package the nutritional information of the energy and six nutrients: fat, saturates, carbohydrate, sugars, protein, and salt, expressed per 100g/ml of product; it may in addition be expressed on a per portion basis (there are allowed several formats, such as the one shown in figure 5).
Therefore, every FOP described in the following pages can only accompany one product that already displays the nutritional information label (Back of Pack Label). They are intended to make the information in the mandatory labels more visible and comprehensible to the public who, generally speaking, tends not to read this kind of information when buying foodstuff. In contrast to the FOP, the mandatory label is normally displayed on the back of the package.
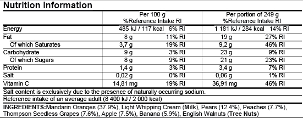
The “need” of a FOP label is to ease the passing of nutritional information from the basic nutritional table (Figure 5) to some simpler message. In fact, the major obstacle in the correct use of the nutritional information could be the lack of basic nutritional knowledge, the lack of cognitive skills required to compare products and to interpret the nutrients in the context of the whole diet or, more simply, the lack of time (Tarabella and Voinea, 2013). That is why food manufacturers, retailer and non-profit organisations from different countries have created a series of “signposting”systems of nutritional profiles.
All in all, a variety of FOP schemes have been developed by public institutions, public health non-Governmental Organisations and the private sector all over Europe. These vary from the purely numerical schemes that repeat some of the information contained in the nutrition declaration (so-called reductive schemes), to colour-coded versions that summarise the scoring of the product, to dichotomous endorsement logos (JRC, 2020).
Description of the current FOP in the market right now
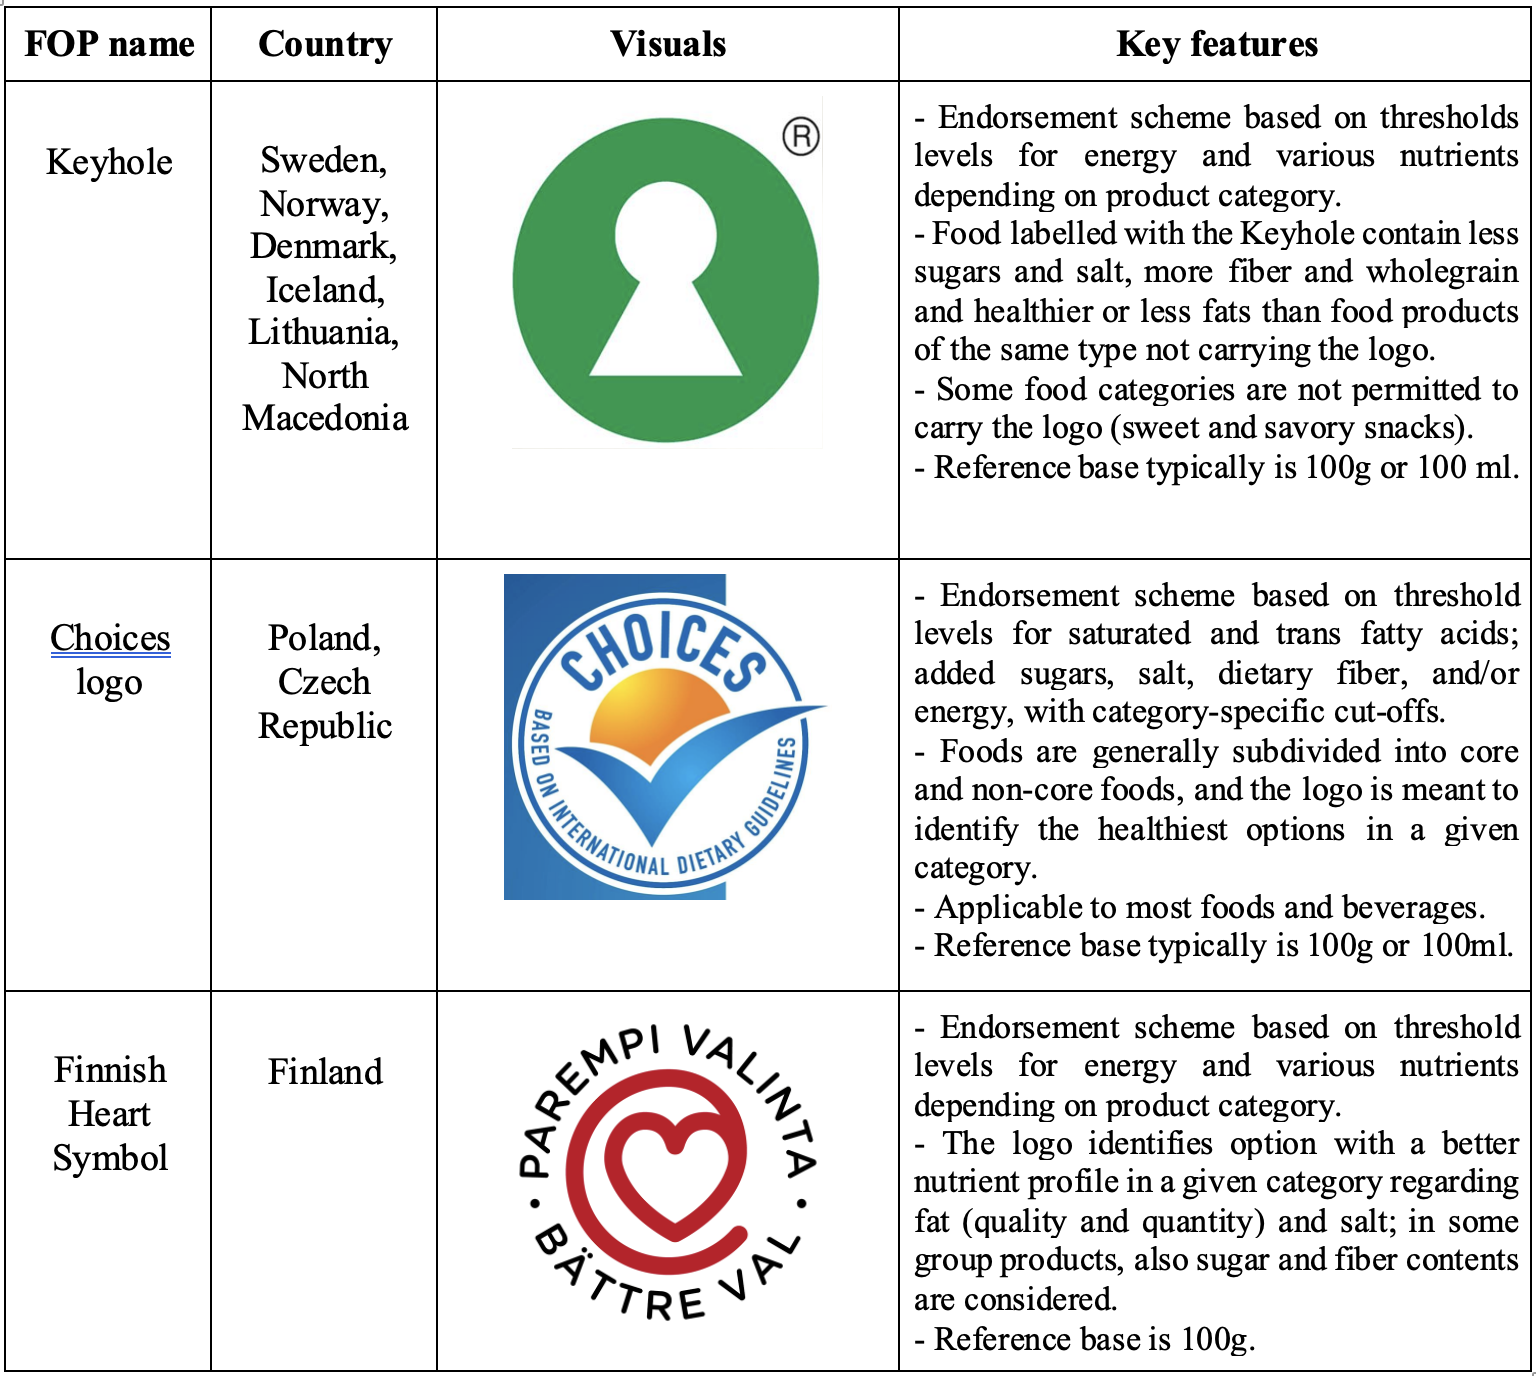
Some ten public and private FOP labelling schemes exist and are already implemented in several MS in Europe. The FOP schemes developed or endorsed by the public sector are: the “Nutri-Score” (used in France, Belgium, Germany, Luxembourg), the “NutrInform Battery” (adopted by Italy and supported by Czech Republic, Poland, Cyprus, Greece, Hungary, Latvia, Romania) , the British “Multiple Traffic Light” combined with the Reference Intakes, and the positive logos such as the “Keyhole” (used in Sweden, Denmark, Lithuania, and also in Iceland, Norway, and North Macedonia), the Finnish “Heart Symbol”, the Slovenian “Little Heart” sign, the Croatian “Healthy Living”, the “Choices” logo.
Legally speaking, as far as July 2019 the only implemented European FOP schemes that fell under Art. 35 of the EU 1169/2011[1] are the UK Traffic light label and the Reference Intakes schemes. The other existing schemes in the EU do not strictly fall under Art. 35 as they do not repeat the information provided in the nutritional declaration (a qualifying criteria). Such other schemes are considered as “voluntary information” and fall under Article 36 since they do not repeat the information provided in the Back of pack label but provide information on the overall nutritional quality of the food.
At any rate, FOP nutrition labelling is defined as the nutritional information that appear on the principal field of vision on food and drinks packaging. According to the EU regulation, the FOP can repeat some or all the numerical information from the mandatory nutrition declaration in a neutral or in an evaluative way or express the overall nutritional value of a food to be applied on all products or only on products complying with certain nutritional criteria.
NUTRISCORE
How does the Nutri-Score work
The FOP method called “Nutri-score” is, by far, the most discussed. It has been implemented as the standard in some European MS (France, Belgium, Germany, Luxembourg[2]) and taken as a reference and/or a marketing tool by some private food producers and retailers.
The ambition of the Nutri-score is to give synthetic information about the global nutritional outlook of a food product within a simple eye-look. This system is based on an algorithm whose outcome is a number. This number is then translated into a scale in which letters in alphabetical order from A to E and colours from green to red are displayed. The more the outcome leads towards the red and the letter E, the more dangerous for the health the product is supposed to be. The outcome of this representation is a graphic scale (to be seen in figure 6) divided into five classes with the purpose “to help the consumer better see, interpret and understand the nutritional quality” of the products.

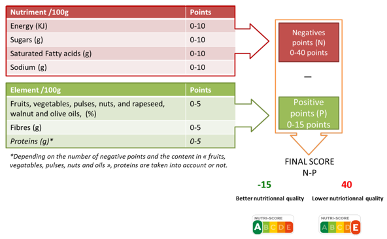
The algorithm is applied to the analysis of a standard measure of 100 g of product as it is sold. The calculation of points depends on the amount of the following nutrients that are present in the product: calories (Kcal/Kj), amount of fat (g), amount of saturated fatty acids (g), amount of carbohydrates (g), amount of sugars (g), amount of protein(g) amount of salt (mg), fibres (g).
For each category of nutrients, a number is appointed depending on the quantity of it in the product. The algorithm foresees positive (to be summed) and negatives (to be subtracted) points. The sum of all the amounts gives the final number that will define the letter and the colour on the visual label. Promoting this tool, Santé publique France states that “the nutritional score uses the nutrients and ingredients within the food that have a significant impact on health to derive a unique estimate value of the nutritional quality of the food on an ordinal scale ranging from ‘negative fifteen’ -15 (more nutritious) to ‘positive forty’ +40 (less nutritious)” [Santé publique France, “Nutri-Score Frequently Asked Questions”,][3].
The positive points (unhealthy nutrients) can be accumulated with high amounts of calories (energy), fats and fatty acids (saturated fatty acids), sugars and carbohydrates (sugars), and salt (sodium) which are graded from 0 to 10 for each category. Negative points (healthier nutrients) are gained with higher amounts of fibres, proteins, and vitamins (fruits, vegetables, pulses, nuts, rapeseed, walnut and olive oils), which are graded from 0 to 5 for each category.
All in all, the maximum positive points that can be gained are + 40 (four categories for which the maximum points are ten each), and the maximum negative points to be gained are – 15 (three categories for which the maximum points are five each). The final number is the outcome of the sum between total positive and negative points: the closer to -15 the amount is, the product will be evaluated closer to letter “A”; the closer to + 40 the amount is, the product will be evaluated closer to letter “E”. This process is graphically explained in figure 7.
It is worth noticing that there are already adaptations of the Nutri-score for cheeses, beverages, and added fats (oils, cream, butter, etc.), and different score methodology for beverages.
To conclude, it is important to note that the Nutri-Score does not apply to all categories of food and beverages: in fact, it does not apply to all the products that do not need a mandatory nutritional declaration according to regulation no. 1169/2011, notably, unprocessed products that comprise a single ingredient (such as fresh fruit and vegetable, cut raw meat, etc.), herbs, salt, coffee, tea, infusions, vinegar, flavourings water, beverages which contain more than 1.2% of alcohol, and more [11].
Discussion on the functioning of the Nutri-score
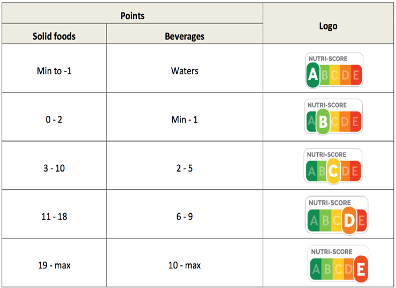
UNEQUAL POINTS IN CATEGORIES: The way the system allocates the points of the categories related to colours and letters is not proportionate. As it can be seen in figure 8, a product can be included in the category “A – green” if the final score is in a range of 15 points, whereas in order for a product to be labelled in the category “E – red”, the score should be in a range of 21 points. Likewise, the other categories: “B – light green” ranges 3 points, “C – yellow” 8 points, and “D – orange” 8 points. It is clear that the categorisation is unbalanced and the chances for a product to be labelled with lower mark are higher than the others. Little changes in the points assigned lead to disproportionate change in the classing.
IT CAN CONFUSE THE CUSTOMER: Nutri-score has been criticised by many saying that it over-simplifies the classification of foodstuff, notably, by labelling with the “D orange or E-red” signs products that are considered by experts as healthy if introduced in moderation within a balanced diet. Products like olive oil, fish, dairy products, etc. risk to be excluded from the shopping baskets because of the “bad” stigmatisation the yellow, orange or red labels imply, while scientific consensus agrees on the fact that avoiding some nutrients that can be found in them could cause health problems.
IT REFLECT NEITHER THE INTAKE NOR THE FINAL USE OF THE PRODUCT: scoring per 100 gr of sold products, the Nutri-Score does not take into account the quantity usually eaten within a normal balanced diet and thus sends a wrong message to consumers (that D orange or E red products should be excluded from a healthy diets). On the opposite, focusing solely on the products as sold, Nutri-score does not take into account the cooking of the products. As a result frozen French fries can be scored A or B green while butter or crude olive oil are D or E red.
IT CREATES JUDGMENTS FOR PRODUCTS: the Nutri-Score as it is structured now tends to privilege some products (or even producers) rather than others, while the role of the label itself should be to inform the end user without creating a sense of judgment towards the product. Studies (Tarabella and Voinea, 2013) have shown that western cultures tend to judge badly something related to the colour red, and “good” something related to the colour green. The Nutri-Score system uses unconscious signals to change the purchasing behaviour of customers creating a judgmental attitude in the consumer during the purchasing experience and resulting in a distorted perception of specific products and brands that are already used by some actors as a marketing tool. This system categorises food products in a binary, simplistic and discriminatory way (what is “good” vs. what is “bad”), going against the principle that every food can have its place in any diet.
IT IS USED AS A MARKETING TOOL: the Nutri-Score has already been used by some market operators (notably resellers) as a marketing tool, making the French-conceived FOP the subject of promotions and incentive in the prices. In a supermarket brand, it has been implemented a revision of the nutritional outcome for the Nutri-Score, so to “improve the Nutri-Score of your [the customers’] favourite products”[4]. With this approach, the supermarket chain does not fix its results to objective standards, but it uses the Nutri-Score as a marketing tool, changing it following the swings of the demand of their customers. In this way, the concept of an educational tool is overturned, indulging on profit-based logics rather than educational and health ones.
IT CHANGES AMONG COUNTRIES: Since Nutri-score is based on National Dietary Guidelines, producers and retailers in Member States have developed their own specific adaptation of the tool. It occurs that some same products sold in two different countries have different classification on the Nutri-score[5]. The fact that the Nutri-score grading for the same product can be changed on the basis of the country where it is applied, it puts into question the coherence and the purpose of this tool.
IT RESULTS IN AN INCENTIVE TO MORE ULTRA–PROCESSED: in order to get a better score, food processing companies have tended to reformulated their products and switch from mix of natural components to more and more processed products using chemistry to maintain appearance and taste of the sold product and gain A or B green scores. Not to remind the scientifically proven link between ultra-processed food and risk of NDCs and notably cancer.
On the positive remarks, the Nutri-Score is:
EASY TO UNDERSTAND: the design of the label makes the purchasing experience very easy and quick. By attributing colours and letters, the customers already feel that they know which kind of products they intend to buy when doing their grocery. No need to read the specifics, nor scientific background knowledge is required to understand the message that the Nutri-score is meant to send. The easiness derived from this system enables to reach all the social strata of the population (regardless the education level and the economic situation).
COMPLETE: the system implies the analysis of a high amount of nutrients that can be found in the majority of food products. The standard categories analysed by the algorithm of nutrients leads the system to easily adapt to almost every product.
ADAPTABLE and already been adapted: in order to answer to some concerns raised by sectors and consumers, the Nutri-Score algorithm was adapted for some products as cheese, beverages… Nevetheless, traditional cheese producers have taken recently position against it, underlining the disconnection between the quality of their products and the A or B scoring given to ultra-processed and unhealthier competitors. As a result, the French Minister for Agriculture opened the gate to a new adaptation of the algorithm.
However, this raises as well the question of the scientific objective basis of the tool and its algorithm.
The study led by the French Comité Scientifique (2017) found that the label itself has an impact during the purchasing experience, notably by underlining that the products that did not show any FOP label tended to be excluded from the purchase.
NUTRINFORM
How does the NutrInform work
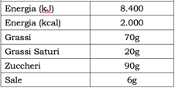
As for the French method, the Italian one found its legal basis in Art. 35 of the 1169/2011 regulation. The NutrInform aims at informing the consumers of a food product nutritional values through a battery-design, visually representing the percentage of a certain nutrient compared to the recommended daily amounts (Figure 9). This system analyses energy(kilojoule and calories), fats, saturated fats, sugars, salt. The daily reference amounts are displayed in Table 1. The filling level of the battery corresponds to the percentage of that specific nutrient that the recommended portion of the food brings to the consumer’s diet, referring to the Reference Intakes. The consumer must therefore be careful not to “fill” more than necessary the battery corresponding to the individual nutrients, taking into account the other foods, and therefore nutrients and calories, consumed throughout the day.
Moreover, the NutrInform takes into consideration portions as the analysed unit, and not the 100g reference. Only information regarding the energy will be displayed in the 100g/ml form, as the 1169/11 regulation obliges. Nutrition information should be expressed both in terms of absolute amount (in kJ and kcal for energy and in grams for nutrients) and reference intake percentage, based on a portion that is easily recognisable and meaningful to the consumer. Besides, the NutrInform is not applicable to the GIs, PGIs, PDOs. For more specific information on how to measure portions and nutrients, please refer to the source
[https://www.tuttocamere.it/files/alimenti/Dichiarazione_Nutrizionale_Schema_Decreto_02_2020.pdf
As for the NutriScore, the NutrInform is “owned” by the Italian ministry of economic development, which manages it. The usage of the mark is voluntary and for free. The users can be a physical or juridical persons, producers, and distributors of foodstuff to be sold in Italy and on the European market.
Italy adopted it and forwarded the request to the Commission early in November 2020.
Discussion on the Nutrinform tool:
COUNTERINTUITIVE: in the general perception, the battery symbol is normally supposed to be filled. In this case if one fills it all, he/she will reach the maximum allowed amount of nutrients – the consumer should not reach the 100% mark because doing so would mean essentially that too many calories, total fat, saturated fat, sugars or salt of the day’s total ration are being filled.
IT LACKS IMMEDIATE UNDERSTANDING: because of the way its design is structured, the NutrInform can create confusion. In fact, the consumer is asked to add the sum of percentages in nutrients in different foods in order to be able to evaluate if the shopping cart is balanced or not.
AVERAGE DIET STANDARDS: the GDAs are based on the nutrition requirements for an average adult of healthy weight and average activity level so several consumer segments can make uncorrected choices like children, woman, and elder.
However, the NutrInform is not based on a point-given algorithm whose outcome is a vote on the food product. On the contrary, it considers every main nutrient within the context of a diet; the outcome are suggestions towards which nutrient a person should turn to decrease or increase in his/her diet. In fact, NCDs are the consequences of the nutritional unbalances, that do not depend only on one product, but from the proportions of the food that a person eats. This approach is closer to reality and to eating habits. Furthermore, Tarabella and Voinea, (2013) found out that the concept of Reference Intake (or GDA -Guideline Daily Amount-) on which the NutrInform is based, is well understood by customers. 89% of the studied population could correctly define a guideline daily amount as a maximum rather than a target to reach.
It does not discriminate nor judge the product: the way the NutrInform is designed does not imply any kind of unconscious judgment towards the targeted food. In fact, the principle that stands behind this FOP label is the one to inform, and quality information is the process of transmitting data without the intention of influence the perception of reality. Moreover, a neutral information should be the principle for every consumer to make an independent choice.
Portions, not 100 g: this way of measuring is found to be closer to the real alimentation habits of customers, helping to better understand the nutrients intake when eating the food product. The reference portions have been defined for each product category on the basis of scientific studies conducted by CREA[1] and the “Istitutio Superiore di Sanità”[2].
TRAFFIC LIGHTS
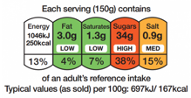
Traffic light system is the FOP method used by the UK government that has been developed by the Food Standards Agency in 2006[1]. As the others FOP in Europe, it is not mandatory, but many supermarkets and food processors have adopted it as a standard.
This system considers the following nutrients: calories, fats, saturated fats, sugars, and salt, and it displays them in the label linking the amount of the nutrients to be found in the product to a percentage and, therefore, to a colour. The percentage refers to the relative adult’s reference intake, and the colour shows if a product is high (red), medium (amber) or low (green) in fat, saturated fat, sugars, and salt. It also provides the information about how much energy (calories and kilojoules) it provides. Nutrients are labelled red if the amount of the nutrient per 100g or 100ml of the food represents more than 25% (for food) and 12,5% (for drinks) of an adult’s recommended daily maximum intake for the particular nutrient.
The Traffic light system is appreciated by some resellers but also by some health organizations (Tarabella and Voinea, 2013) given its intuitive visual design that enables it to convey efficiently the message it is supposed to send. The analogy with the traffic light, which the majority of people are confident with (regardless of their age, sex, or social strata), makes the Traffic Light FOP very easy to understand.
In the case that many foodstuffs have an equal combination of red and green colours, this FOP does not give a clear indication of which one is recommended. This outcome is not necessarily a negative one, on the contrary it is the expression of the principle that it is the consumer who is the one responsible for the choice and that the role of the FOP stops at informing her/him without manipulating her/his purchasing actions. The same principle can be found in the similar FOP NutrInform.
On the downside, it focuses only on the unhealthy nutrients, making it difficult to perceive the general outlook of a product, and making it inefficient when comparing foods from the same category. Moreover, it does not provide guidance on the consumption frequency of a product in the overall diet, and it might disadvantage certain categories of products, notably diary ones. Besides, from Tarabella and Voinea’s (2013) research, it seems that the Traffic Light system is characterised by some exaggeration of the meaning of the colours, with 73% of the consumers that thought that red indicated avoidance rather than the occasional consumption.
POSITIVE LOGOS
Keyhole, choices, heart symbol– positive logos[2]– these systems are the most used in the Nordic countries (keyhole), Finland (heart logo), Poland, and Czechia (Choices). Through a symbol (that can be either a green circle with the shape of a white keyhole in the centre, a heart shape, or a check) these methods imply the identification of the food that are considered “best in class” within their product category. It is applied only to the products that are considered healthy and that comply with one or more of the following characteristics: less and healthier fats, less sugar, less salt, more dietary and wholegrain (keyhole), compared to food products that are not labelled, or, more in general, whose quantity of nutrients remains under a certain threshold.
These methodologies – called “Positive logos” – shown to be very effective in being recognized and understood, however, they neglect the complete nutritional information to the customer. They value the products as a whole and do not consider each nutrient as a single element. Moreover, they do not take into consideration the diet of the individual.
The keyhole does not require the customer to read detailed nutritional information, which makes it easy to identify and understand; at the same time, it lacks information that might be of interest to the final user of the product. The Keyhole is the oldest positive system in the continent, implemented since 1989 in Sweden, and then spread to Denmark and Norway.
Table 2 reports the Positive logos used in MS.
Degree of Processing
All in all, the FOP systems described in the previous pages are all the expression of public and private initiatives towards guiding the consumer choice towards the healthier food product.
Despite their actual effectiveness, a common shortcoming, is the lack of information on the degree of processing. Several studies (Moubarac et al., Poti et al., Steele et al. Pereia et al., NutriNet Santé, etc.) strongly correlate the higher level of processing of food (ultra-processed foods) to the appearance of Non-communicable diseases, notably cancers. The more processed the food is, the less nutrition (less fibres, minerals, vitamins, nutrients as such) and more palatable (sweeter, saltier, more caloric) it is, leading to “empty” calories.
If the final aim of Front of package labels is to increase awareness of what citizens are eating, every respectable European-wide FOP system should inform about the degree of processing so to increase transparency and knowledge in the public.
The Nova-Score or the Siga-Score both well represents the front of package system that focuses on processing: in its four-scale colours-and-letters label design, the Nova-score is supposed to inform the consumer of the different stages of processing a product went through[1]. Despite this added level of information, this FOP neglects to provide information about nutritional aspects of the product.
COMMUNICATION CAMPAIGNS
Social marketing
Communication campaigns in the public health/nutrition field, mostly, take the form of social marketing strategies. These campaigns have been implemented with the aim to educate the citizens and improve their eating habits. The institute of medicine (2006) describes it as “[the application of] marketing concepts and techniques – exchange theory, audience segmentation, consumer orientation, competition, and an integrated marketing mix – to promote voluntary behaviour change in specific groups or target audiences based on their sociodemographic, behavioural, and psychological characteristics”.
As in all marketing campaigns, all media are used as a basis to expand the message; all kind of sponsorships (better from non-profit, non-commercial, and government organisations) are welcomed; and more active participation of the target population is wished. Effective social marketing programs use multiple reinforcing communication channels along with public policy and environmental changes to influence consumer behaviours. In order to do that, governments set up communication units in charge of the mass media coverage (notably on Social media), community-based programs, interpersonal communications, posters, pamphlets, promotions, etc.
In these kinds of campaigns, the notion of “exchange” is important to be kept in mind (Institute of medicine, 2006) as the communication efforts aim at changing customers’ behaviours in “exchange” of something that offers more value, in this case, a behaviour that will improve / avoid health problems. However, every exchange is based on trade-offs, and the older the targeted consumer is, the more difficult the trade-off will be from the public point of view, thus “an effective social marketing program identifies the motives or drivers of behaviour, structures these motives as part of the benefits offered, and develops choices for consumers that provide a comparative advantage”. A well-known public campaign that was implemented in a majority of MS is the one aimed at increasing the daily servings of fruits and vegetables, to increase the awareness of the risks related to fat intake and smoking habits.
All of these campaigns, after all, could be considered as examples of “behavioural branding”, in the sense that they try to change the lifestyle of millions of people through the constant proposition of images, slogans, and a general perception of the individual attitude towards society. As a private brand, the relationship between the consumer and such a brand can be strong and long-lasting, with brands offering a symbolic instrument that allows groups of individuals to project a specific self-image and in its social norms. Public authorities have at their disposal powerful tools that should be directed towards the notion of the public good, which correspond to the citizens’ interests. Improving public health through nutritional information, is one of these interests.
[1] Group 1: Unprocessed or minimally processed foods. Group 2: Processed culinary ingredients. Group 3: Processed food. Group 4: Ultra-processed food and drink. For more information, here.
Advertising
Advertising is one, if not the major, tool that is used in communication campaigns. It manages to deliver messages to targeted population in a direct and effective way and it is successful in influencing perception and behaviours.
Advertising for food products is well spread in all media, and public authorities have already implemented some policies that aimed at banning the advertisement of some food products that are considered unhealthy, or at reducing the exposure of marketing of these foods[1], especially for children. Options for advertising regulation in various countries include partial restrictions on advertising by type of food, target group, portion size, and the times of advertising exposure; establishing upper and lower limits of advertising exposure to children, and complete ban on advertising.
In Europe, the “Television Without Frontiers” directive of 2007, not only allows for the television broadcasting industry to be harmonized within the internal market, but it also protects children from exposure to “unhealthy” advertisement. Indeed, it states the “Television advertisement shall not cause moral or physical detriment to minors”, also, it does not allow children’s television programs of less than 30 minutes duration to be interrupted by any advertising. Besides, this directive regulates sponsorship and product placement, notably by not allowing a sponsor to influence the content of the television programme, by clearly identifying a sponsor as such at the beginning or end of the program, and by not allowing any encouragements to purchase the sponsor’s product.
Moreover, in Europe (European Commission, 2020a) the majority of food marketing (via TV and online channels) refers to advertisement of high-calorie, low nutrient-quality foods, high in fats, sugars and salt, with under-representation or absence of advertisement for fruits and vegetable; most food advertisings refer to sugary breakfast cereals, confectionary, high fat snacks, soft drinks, and quick service restaurants; and the advertised foods are at odds with those recommended for a healthy diet. Citing a WHO study[2], the European Commission (2020a) states that “TV advertising still remained the main medium for food marketing in the EU, although a decline in TV advertising expenditures with a parallel significant increase in internet and digital marketing was observed”.
FISCAL TOOLS
Price is one of the most important factors that influences food choice (Smed et al., 2005) and pricing strategies have been proposed as a tool to improve population diets and reduce rates of obesity and NCDs (Eyles et al., 2012, WHO, 2015).
Some countries implemented food taxes in the past and some were subsequently abolished. Some countries have decided to specifically target only specific ingredients that can be dangerous for the health if introduced with no moderation[3].
There are mainly two taxation models that have been applied until now, often at the same time:
- Price support: subsidies or lower VAT on healthy foods. Could take the form of a flat tax rate, or a proportionate one, positively correlated to the amount of the healthy nutrients.
- Tax incentives: an imposition of taxes on certain foods and beverages, particularly to the ones that are salty, high-calorie, high-fat, high in added sugars, and low-nutrient. A valuable disincentive to discourage the consumption of less healthful foods and beverages.
The European Food and Nutrition Action Plan 2015-2020 (WHO, 2015) suggests also a third tool:
Incentives along the food supply chain: actions such as investments in production, supply chain logistics, procurement policies, etc. might lead to “realign broader food system policies with public health goals and improve the availability and affordability of healthy diets”.
The Food and Resources Economics Institute in Denmark found out that taxes or subsidies could have an impact on consumption but with non-consistent results depending on nutrient category and on socioeconomic and geographical status. The authors of the study suggest that, for full effect, such economic incentives might require combination with other interventions, such as related public information campaigns (Smed et al., 2005).
The second-listed taxation principle has been used for tobacco products. Some studies found that taxing cigarettes, as a component of a comprehensive state-based program, it reduces tobacco use in the adult population, even if it does not necessarily affect the youth (Institute of medicine, 2006; Eyles et al., 2012). It has to be underlined, however, that food and tobacco are different products and fulfil completely different needs.
Eyles et al. (2012) compared some studies on food pricing changes, specifically on “the potential of food pricing strategies to improve the quality of population diets and associated health and NCD outcomes” and found that, according to two of the analysed studies, subsidies on fruits and vegetables increased their purchase. This fact is also confirmed by the Institute of medicine (2006), according to which “consumers are not very responsive to price changes for poultry, eggs, fish, milk, and cheese, but they are more responsive to the prices of some fresh fruits and vegetables, as well as pork and beef”. However, it was not considered the possibility of compensatory purchasing, i.e. the fact that individuals faced with a subsidy on some healthy products may purchase more foods low in nutrients and high in sugars and salt, to compensate, indeed, the saved money and the healthy food with an unhealthy one. For instance, Smed (2005) demonstrated that taxes on all fats or saturated fats tend to increase sugar’s share of total energy intake for many consumer groups while reducing the consumption of the targeted nutrient.
With simulating modelling techniques, the authors were able to show that “food taxes and subsidies have the potential to influence food consumption and health considerably, particularly when such taxes/subsidies are large (around 15% of product price or more)”. At any rate, the 19 simulation modelling studies in where taxes were applied to sweetened beverages, carbonated soft drinks, saturated fat, sugar, and less healthy/junk food estimated that, in each category, the food consumption of the taxed food lowered. Besides, the more effective tax effect could be seen on products with high energies from saturated fats[4]. Nevertheless, it was also found that “saturated fat taxes were estimated to increase consumption of sodium, energy, and sugar, and a tax on less healthy foods was estimated to increase consumption of saturated fat” (Smed, 2005). There was substantial variability in outcomes assessed in the subsidy’s simulations.
MS in the EU which have in practice some kind of food pricing strategies are Denmark (that implemented a €2.41 levy per Kg on saturated fats), France (that applied a €0.0036 per litre tax on sweetened beverages), and Hungary (that introduced a 10-forint tax – €0.04 – per item on foods high in total fat, sugar, and salt).
The effects of taxes on socioeconomic strata
Notwithstanding more or less convincing results of pricing strategies on food, concerns on this policy tool have been raised by several studies. Notably, they focused on the impact that pricing food could have on socio-economical groups in the society. In fact, the regressively effect of taxes, affecting disproportionally lower income households has been underlined by at least three studies (Darmon et al., 2020; Eyles et al., 2012; Smed, 2005) resulting in possible discrimination in income-groups. As Darmon and al. write, there is the risk that “improving the health of the overall population may increase health disparities between social groups”, and that “those who were formerly at a lower exposure to risk derive the most benefits that those who were formerly at a greater exposure to risk”. Also, Smed (2005), analysing the Danish experience on a tax on unhealthy products, suggests that “among social classes, the price responsiveness [to the tax] appears to be higher for households in the lower social classes, presumably because the budget constraint is more biding”. In the same article, the author also argues that the lower the socio-economic class is, the more exposed to NCD, notably overweight and diabetes.
Paternalistic approach
The much-debated issue with taxing foodstuff is the approach that such an instrument involve ending up, notably, in a paternalistic tool: a tax does not trust the ability of the citizen to make a healthy choice by himself, therefore, as a padre/padrone “forces” their “children” to behave by imposing price constraints on something that is not considered “good”, depriving the customer from his/her right to choose independently.
This approach might lead to: 1) only the wealthy could afford food treats and 2) as for children, when at age, start to have rebel attitudes, the population as well will react in a not-cooperative manner.
Effectiveness
To conclude, food pricing tools hide more unsolved fiscal & social questions when applied, notably: whether it is best to apply taxes/subsidies at the point of sale or point of production; whether price changes should be applied at a flat rate or at a rate per nutrient/volume of food; which percentage of tax or subsidy has to reach the consumer; the effects on the social-strata; the size of the tax; how easily manufacturers could move their resources to produce untaxed products; and on how consumers would respond to the taxes.
From the sources analysed it is difficult to take a clear-cut position on taxation as a positive or negative policy tool as it has been shown to have higher effectiveness on vegetables and fruits, and that targets mainly the lower socio-economic groups (which is the one that is most affected by NCD) resulting, therefore, in a moderate effective tool.
In addition, fiscal policies on food might create a rejection effect by the weaker economical groups in a society: by implementing higher prices on unhealthy food, weaker economic groups might perceive the purchase of healthier products as an obligation, rather than a possibility. This effect is underlined by the fact that low-income groups tend to find in food a higher value of comfort given, also, the relative affordability of food compared to other forms of distraction (such as cultural activities, travels, restaurant, etc.) resulting, eventually, in a higher risk of social fracture and rejection of these policies.
PART III
WHICH EUROPEAN SOLUTION?
The European Food and Nutrition Action Plan 2015-2020 (WHO, 2015) states that “Nutrient profiling has emerged as a valuable tool for policy development and implementation to promote healthier food supplies”. Of all the methodologies analysed, the FOP seems indeed an effective tool to be considered, even if a coordinated effort of all the policies (education programmes in the first place) is the optimal policy action to prefer.
Therefore, the European initiative that foresees to adopt a harmonised solution (programmed in the Farm to Fork Strategy) should, at large, take into consideration the following points:
– NON-DISCRIMINATORY: the labelling system should be in line with the requirements provided by Reg.1169/2011, therefore, it should aim at informing consumers. While a labelling system should be informative and easy to understand, it should not result in an over simplistic classification of “bad” and “good” food products.
– EFFECTIVE: a EU FOP system should be based on portions, in order to better inform consumers over the actual nutritional intake and value of every food. It should be objective and thus not penalise unduly nutritious agri-food products, often used as ingredients in other food preparations or consumed in portions lower than 100 g, as advised by dietary guidelines. Studies show that “when the reference amount of ‘per 100g’ was very different from the ‘typical’ portion size, products with a ‘per 100g’ label were rated significantly less healthful than the ‘typical’ or ‘half typical’ portions”. The portion is a closer-to-reality approach that does not confuse the consumer.
- STANDARDISED: the harmonised methodology should be applicable to the European markets. As a European standard, thus, it is foreseen the need to have common grounds and basics, and to respect general guidelines. In particular, the legislation should outline the basic characteristics that FOP label should follow in every MS, leading to the principle of standardisation which would allow the European consumer to recognise the nutritional value of the product/nutrient everywhere in Europe, regardless of the Member State or the distributor. Therefore, such a system should be developed in a way which ensures that specificities of each Member State’s food culture, typical diet and national nutritional guidelines are followed. A EU system should be coherent with the EU policy on EU quality productions and should take into consideration the level of processing.
– FLEXIBLE: the chosen methodology should foresee a margin of flexibility, within the European standards agreed upon, so to respond to different diet habits and national priorities. Flexibility should also allow not to abruptly categorise a product/nutrient as “good” or “bad”, but to empower the consumer about its effects on health and the dosage.
– UNDERSTANDABLE: in order to have a greater impact on societies, the methodology should be designed in a way that everyone could be able to understand it and receive the messages they are supposed to send, regardless of the social, economic, and educational level of the person, taking into consideration the notion of “product literacy”. The shopper requires accurate information and means to evaluate that information. Obviously, product literacy is thwarted when consumers do not have access to the quality and type of information necessary to evaluate product choices. Thus, truthful information is necessary for product literacy. In addition, “truthful information alone may not be sufficient to achieve product literacy, because information is useless if one does not understand how to use it and transform it into practical knowledge” (Pappalardo, 2012).
– ENGAGING: FOP labelling has been designed as an educational tool. First-time consumers and young adults are often the more receptive at the beginning. It is understood that the effects on the population can only be seen some years from its implementation. Thus, it is of imperative urgency to work on a common methodology that will be able to target also the population that is left behind by the labelling strategy, notably adults, elderly citizens with consolidated eating habits, and consumers who do not have the cultural knowledge to make the choice on what food to buy according to each individual’s particular conditions and state of health.
– INCLUSIVE: studies have shown that “improving the health of the overall population may increase health disparities between social groups” (Darmon et at, 2020), notably, “those who were formerly at a lower exposure to risk derive the most benefits that those who were formerly at a greater exposure to risk”. Guaresh (2018) also confirms the disparity in the usage of FOP: higher-income groups tend to pay more attention to the nutritional label compared to the low-income groups. Moreover, according to TNS study on the impact of food information on consumers’ decision making (2014), only “less than a quarter of shoppers actually took time to read information on the package. Of these, only a fraction of consumers read relevant food information that informs about the healthiness of the product”. On average, the consumer spends 2 seconds to choose the product on the shelf, it is clear the positive correlation between who reads the information and the educational level (the more educated, the more likely to read the nutritional label) (Guaresh, 2018). The European solution should consider the effects that such systems have on the overall society and take a socially-holistic approach. The “leaving no one behind” motto should then be fulfilled at once.
All in all, these guidelines should be able to guide the European debate in exploring solutions for a future Eu-wide Front-of-Package label.
[1] https://www.bbc.co.uk/newsround/45110055 ; European Food and Nutrition Action Plan 2015-2020 (WHO, 2015)
[2] https://www.euro.who.int/__data/assets/pdf_file/0019/191125/e96859.pdf ; WHO (2015).
[3] For instance, Norway, Hungary, Denmark, Bermuda, Dominica, St. Vincent and others, have applied specific fiscal policies only on unprocessed sugar and sugar-added foods (Pfinder et al., 2020).
[4] For this category of products, the estimated change in demand with a 1% increase in price, was found to be higher than the others. In other words, if the price of the product changes by 1%, the products that will experience the highest loss in its demand will be the ones higher in energies from saturated fats.
[1] For more information: https://www.nutrition.org.uk/healthyliving/helpingyoueatwell/324-labels.html?start=3#:~:text=Using%20the%20government%20scheme%2C%20a,calories%20and%20kilojoules)%20it%20provides.
[2] For more information (Keyhole): http://norden.diva-portal.org/smash/get/diva2:700822/FULLTEXT01.pdf
For more information (Choices): https://www.choicesprogramme.org/
For more information (Heart symbol): https://www.sydanmerkki.fi/en/
[1] The Italian Government’s Council for research in agriculture
[2] The main public center for research, control and technical-scientific consultancy in the field of public health in Italy
[1] The article defines the requirements that additional forms of expression and presentation of the nutritional information must have.
[2] Spain and The Netherlands, have expressed, under different circumstances, the political will to consider it as a domestic standard tool.
[3] Three updated algorithms apply for cheeses, beverages, and added oils/fats.
[4] https://www.delhaize.be/fr-be/nutriscore-update
[5] We have compared the classification in Nutri-score of several same products (same brand) sold by the same retailer in France and Belgium and concluded that they have different rating in the two countries.
[2] https://apps.who.int/healthinfo/statistics/mortality/whodpms/
[1] Which represent an estimated 77% of death causes in the EU.
[1] The hormone that absorbs sugars in the blood.
[1] To this respect, the European Commission, in its Farm to Fork Strategy, advanced the initiative to have a harmonized European labelling system. Legislative proposal is expected to be drafted in 2022.
BIBLIOGRAPHY
- Agra Facts, “Klockner hails constructive informal on resilience, labelling, transport”. No. 66, Brussels, 01/09/2020.
- British nutrition foundation, “Looking at labels”, December 2016. Online resource, consulted on 08/09/2020; https://www.nutrition.org.uk/healthyliving/helpingyoueatwell/labels.html?limitstart=0
- Comité Scientifique de l’étude d’expérimentation, “Evaluation ex ante of simplified graphical nutrition labelling systems”, Final report from the scientific committee [in French]. 2017. Online source, consulted on 04/09/2020: https://solidarites-sante.gouv.fr/IMG/pdf/rapport_comite_scientifique_etiquetage_nutritionnel_150317.pdf
- Council of the European Union, “Reflection process: innovative approaches for chronic diseases in public health and healthcare systems”, 2013. Online source, consulted on October 30th,2020:https://ec.europa.eu/health/sites/health/files/major_chronic_diseases/docs/reflection_process_cd_final_report_en.pdf
- Darmon et al. “Food price policies improve diet quality while increasing socioeconomic inequalities in nutrition” International Journal of Behavioral Nutrition and Physical Activity 2014, 11:66. Online source, consulted on October 22nd, 2020: http://www.ijbnpa.org/content/11/1/66
- Eyles et al., “Food pricings strategies, population diets, and non-communicable disease: a systematic review of simulation studies”, PLoS Medicine, 2012. Online source, consulted on November 4th 2020: https://www.researchgate.net/publication/233915556
- European Commission-a, “Health promotion and disease prevention – Food and non-alcoholic beverage marketing to children and adolescents”, Brussels, 2020. Online source, consulted on November 9th, 2020: https://ec.europa.eu/jrc/en/health-knowledge-gateway/promotion-prevention/other-policies/marketing
- European Commission, “Health Promotion and disease prevention – Dietary Fats”, Brussels, 2020. Online source, consulted on October 28th, 2020: https://ec.europa.eu/jrc/en/health-knowledge-gateway/promotion-prevention/nutrition/fats
- European Commission, “Health Promotion and disease prevention – Dietary salt/sodium”, Brussels, 2020. Online source, consulted on October 27th, 2020: https://ec.europa.eu/jrc/en/health-knowledge-gateway/promotion-prevention/nutrition/salt
- European Commission, “Impact Assessment report on general food labelling issues”, Brussels, 2008. Online source, consulted on October 28th; 2020: https://ec.europa.eu/food/sites/food/files/safety/docs/labelling_legislation_general-food-labelling_en.pdf
- European Commission, “Labelling and nutrition”. Online source, consulted on November 6th, 2020: https://ec.europa.eu/food/safety/labelling_nutrition/labelling_legislation_en
- European Commission, “Non-communicable diseases – European Core Health Indicators”, 2018. Online source, consulted on October 29th, 2020: https://ec.europa.eu/health/non_communicable_diseases/indicators_en
- European Commission, “Report from the Commission to the European Parliament and the Council regarding the use of additional forms of expression and presentation of the nutrition declaration”, Brussels, 20/05/2020
- European Commission, “Survey on Member States’ implementation of the EU Salt Reduction Framework”, 2021. Online resource, consulted on November 12th, 2020: https://ec.europa.eu/health/sites/health/files/nutrition_physical_activity/docs/salt_report1_en.pdf
- European Commission, “The end of the sugar production quotas in the EU”, 2017. Online source, consulted on November 10th, 2020: https://ec.europa.eu/commission/presscorner/detail/en/MEMO_17_3488
- European Commission, “ Trans fat in food”. Online source, consulted on November 10th, 2020:https://ec.europa.eu/food/safety/labelling_nutrition/trans-fat-food_en
- Fortuna, “EU-wide food label should not fall to the back-burner, say advocates”, Euractiv, 30/04/2020. Online source, consulted on 04/09/2020: https://agriculture.einnews.com/article/525513215?lcf=QFOhvafD10Gdd5bQ5t4khg%3D%3D
- Fortuna, “The battle between pro Nutri-score MEPs and Italy keeps ranging on”, Euractiv, 16/01/2020. Online source, consulted on 04/09/2020: https://agriculture.einnews.com/article/525513215?lcf=QFOhvafD10Gdd5bQ5t4khg%3D%3D
- Framework for National Initiatives on Selected Nutrients – Annex II: Added Sugars. European Commission; 2015. Online source, consulted on April 20th, 2021: https://ec.europa.eu/health/sites/health/files/nutrition_physical_activity/docs/added_sugars_en.pdf
- Green et al., (2000). “Variation and trends in incidence of childhood diabetes in Europe”. The Lancet 355. 873-876., 2000. Online source, consulted on April 20th, 2021: https://www.researchgate.net/publication/279791161_Variation_and_trends_in_incidence_of_childhood_diabetes_in_Europe
- Grummon and Hall, “Sugary drink warnings: A meta-analysis of experimental studies”. PLOS Medicine 17(5): e1003120. Online resource, consulted on November 3rd, 2020: https://doi.org/10.1371/journal.pmed.1003120
- Gautam D, Naresh P. A, “Review of Research Studies on Factors Affecting Consumers’ use of Nutritional Labels”, Nutri Food Sci Int J. 2018; 7(3): 555713. DOI: 10.19080/NFSIJ.2018.07.555713. online source, consulted on December 45th, 2021: https://juniperpublishers.com/nfsij/pdf/NFSIJ.MS.ID.555713.pdf
- Harvard Medical School, “The sweet danger of sugar”, Harvard Health Publishing, 2017. Online source, consulted on October 27th, 2020 : https://www.health.harvard.edu/heart-health/the-sweet-danger-of-sugar
- Harvard T.H. Chan, “The nutrition source – Salt and sodium”. Harvard School of public health. Online source, consulted on October 27th, 2020: https://www.hsph.harvard.edu/nutritionsource/salt-and-sodium/
- Himmelsbach, Allen, Francas, “Study on the impact of Food information on consumers’ decision making”, TNS European Behavior Studies Consortium, 2014. Online source, consulted on October 28th, 2020: https://ec.europa.eu/food/sites/food/files/safety/docs/labelling_legislation_study_food-info-vs-cons-decision_2014.pdf
- Institute of Medicine, “Food marketing to children and youth: threat or opportunity?”, Washington DC: the National Academies Press, 2006. Online source, consulted on November 2nd, 2020: https://www.nap.edu/catalog/11514/food-marketing-to-children-and-youth-threat-or-opportunity
- JRC, “Front-of-Pack nutrition labelling schemes: a comprehensive review”, European Commission, 2020. Online source, consulted on November 23rd, 2020: https://publications.jrc.ec.europa.eu/repository/bitstream/JRC113586/kjna29811enn_1.pdf
- Julia C, Hercberg S. Development of a new front-of-pack nutrition label in France: the five-colour Nutri-Score. Public Health Panorama. 2017;3(4):712–725. Online source, consulted on 04/09/2020: https://apps.who.int/iris/bitstream/handle/10665/325207/php-3-4-712-725-eng.pdf
- Kuller LH, “Dietary fat and chronic diseases: epidemiologic overview”. J Am Diet Assoc. 1997 Jul;97(7 Suppl):S9-15.Online source, consulted on October 28th, 2020 on PubMed: https://pubmed.ncbi.nlm.nih.gov/9216562/
- Law Malcolm, “Dietary fat and adult diseases and the implications for childhood nutrition: an epidemiologic approach”, The American Journal of Clinical Nutrition, Volume 72, Issue 5, November 2000, Pages 1291s–1296s. Online source, consulted on October 28th, 2020: https://doi.org/10.1093/ajcn/72.5.1291s
- Looking at labels”, British nutrition foundation, December 2016. Online resource, consulted on 08/09/2020; https://www.nutrition.org.uk/healthyliving/helpingyoueatwell/labels.html?limitstart=0
- Mahesh et al., “Relative contributions of recommended food environment policies to improve population nutrition: results from a Delphi study with international food policy experts”. Public Health Nutrition: 21(11), 2142-21-48, 2017. Online resource, consulted on November 4th, 2020: doi:10.1017/S1368980018001076
- Moubarac et al., “Consumption of ultra-processed foods and likely impact on human health. Evidence from Canada”, 2012. Cambridge University press, consulted on December 3rd, 2020.
- Morrison, “Food label fight Italy’s Nutinform “confusing and counter intuitive”, claim consumer groups”, Food navigator, 31/01/2020. Online source, consulted on 08/09/2020: https://www.foodnavigator.com/Article/2020/01/31/Food-label-fight-Italy-s-NutrInform-confusing-and-counter-intuitive-claim-consumers-groups
- NutriNet-Santé, “Ultra-processed food intake and risk of cardiovascular disease: prospective cohort study”, 2019. BMJ, consulted on Decemebr 3rd, 2020.
- OECD/EU, “Health at a Glance: Europe 2018: State of Health in the EU Cycle”, OECD Publishing, Paris, 2018. Online source, consulted on October 30th, 2020: https://doi.org/10.1787/health_glance_eur-2018-en
- Official Journal of the European Union, “Regulation (EU) Np 1169/2011 of the European Parliament and of the Council of 25 October 2011 on the provision of food information to consumers, amending Regulation (EC) No 1924/2006 and (EC) No 1925/2006 of the European Parliament and of the Council, and repealing Commission Directive 87/205/EEC, Council Directive 90/496/EEC, Commission Directive 1999/10/EC, Directive 2000/13/EC of the European Parliament and of the Council, Commission Directives 2002/97/EC and 2008/5/EC and Commission Regulation (EC) No 608/2004”, 2011. Online source, consulted on October 29th, 2020:https://ec.europa.eu/food/safety/labelling_nutrition/labelling_legislation_en
- Pappalardo, “Product Literacy and the Economics of Consumer Protection Policy”, Journal of Consumer Affairs, 2012. Online source, consulted on November 3rd, 2021: https://www.researchgate.net/publication/264466732_Product_Literacy_and_the_Economics_of_Consumer_Protection_Policy
- Patterson et al., “Trends in childhood type 1 diabetes incidence in Europe during 1989-2008: evidence of non-uniformity over time in rates of increase”. Diabetologia. 2012 Aug;55(8):2142-7. doi: 10.1007/s00125-012-2571-8. Epub 2012 May 26. PMID: 22638547. Online source, consulted on April 20, 202: https://pubmed.ncbi.nlm.nih.gov/22638547/
- Pepin, Imbeault, “ Les édulcorants de la controverse ». Médecine Sciences 2020; 36: 472-8, pp.472-477.
- Pereia Machado et al., “Ultra-processed food consumption and obesity in the Australian adult population”. Nature, 2020: https://doi.org/10.1038/s41387-020-00141-0, consulted on February 8th, 2021.
- Pfinder M, Heise TL, Hilton Boon M, Pega F, Fenton C, Griebler U, Gartlehner G, Sommer I, Katikireddi SVittal, Lhachimi SK. Taxation of unprocessed sugar or sugar-added foods for reducing their consumption and preventing obesity or other adverse health outcomes. Cochrane Database of Systematic Reviews 2020, Issue 4. Online source, consulted on November 3rd, 2020: https://www.cochranelibrary.com/cdsr/doi/10.1002/14651858.CD012333.pub2/epdf/abstract
- Poti et al., “Ultra-processed food intake and obesity: what really matters for health – processing or nutrient content?”, 2017. Springer link, consulted on December 3rd, 2020.
- Regulation (EU) No 1169/2011 of the European Parliament and of the Council of 25 October 2011 on the provision of food information to consumers, Eur-Lex, 25/10/2011. Online source, consulted on September, 2nd 2020: https://eur-lex.europa.eu/legal-content/EN/TXT/PDF/?uri=CELEX:32011R1169&from=EN
- Santé Publique France, “Conditions of Use of the “Nutri-Score” logo”, Paris, French National Public Health Agency, 21/06/2020
- Santé publique France, “Nutri-Score Frequently Asked Questions”, 12/05/2020
- Smed et al., « Differentiated food taxes as a tool in health and nutrition policy”, Food and resource economics institute, 2005.
- Steele et al., “Ultra-processed foods and added sugars in the US diet: evidence from a nationally representative cross-sectional study”, 2016. BMJ open, consulted on December 3rd, 2020
- Tarabella and Voinea, “Advantages and limitations of the front-of-package (FOP) labeling systems in guiding the consumers’ healthy food choice”. Amfiteatru Economic, Vol XV, No 33: 198-209, 2013.
- Tosti V, Bertozzi B, Fontana L, “Health Benefits of the Mediterranean Diet: Metabolic and Molecular Mechanisms”, The Journals of Gerontology: Series A, Volume 73, Issue 3, March 2018, Pages 318–326. Online source, consulted on 07/09/2020: https://doi.org/10.1093/gerona/glx227
- TNS European Behaviour Studies Consortium, “Study on the Impact of Food Information on Consumer’s Decision making”, 2014. Online source, consulted on October 28th, 2020: https://ec.europa.eu/food/sites/food/files/safety/docs/labelling_legislation_study_food-info-vs-cons-decision_2014.pdf
- Weichselbaum et al., “Nutrition in schools across Europe: a summary report of a meeting of European Nutrition Foundations”, Madrid, 2011. Online source, consulted on November 10th, 2020: https://doi.org/10.1111/j.1467-3010.2010.01881.x
- Wolrd Helath Organization, Regional Office for Europe, “Eliminating trans fats in Europe – A policy brief”, 2015a. online source, consulted on November 10th, 2020:https://www.euro.who.int/__data/assets/pdf_file/0010/288442/Eliminating-trans-fats-in-Europe-A-policy-brief.pdf
- World Health Organization. Regional Office for Europe, “European Food and Nutrition Action Plan 2015–2020”, 2015b. Online source, consulted on November 10th, 2020. https://apps.who.int/iris/handle/10665/329405
55. World Health Organization. Regional Office for Europe, “European Salt action network restates its support for WHO goal of reducing salt intake to 5 g per day or less”, 2018. Online resource, consulted on November 10th, 2020: https://www.euro.who.int/en/health-topics/disease-prevention/nutrition/news/news/2018/12/european-salt-action-network-restates-its-support-for-who-goal-of-reducing-salt-intake-to-5-g-per-day-or-less#:~:text=Partners-,European%20Salt%20Action%20Network%20restates%20its%20support%20for%20WHO%20goal,g%20per%20day%20or%20less&text=This%20suggestion%20contradicts%20the%20recommendations,than%205%20g%20per%20day