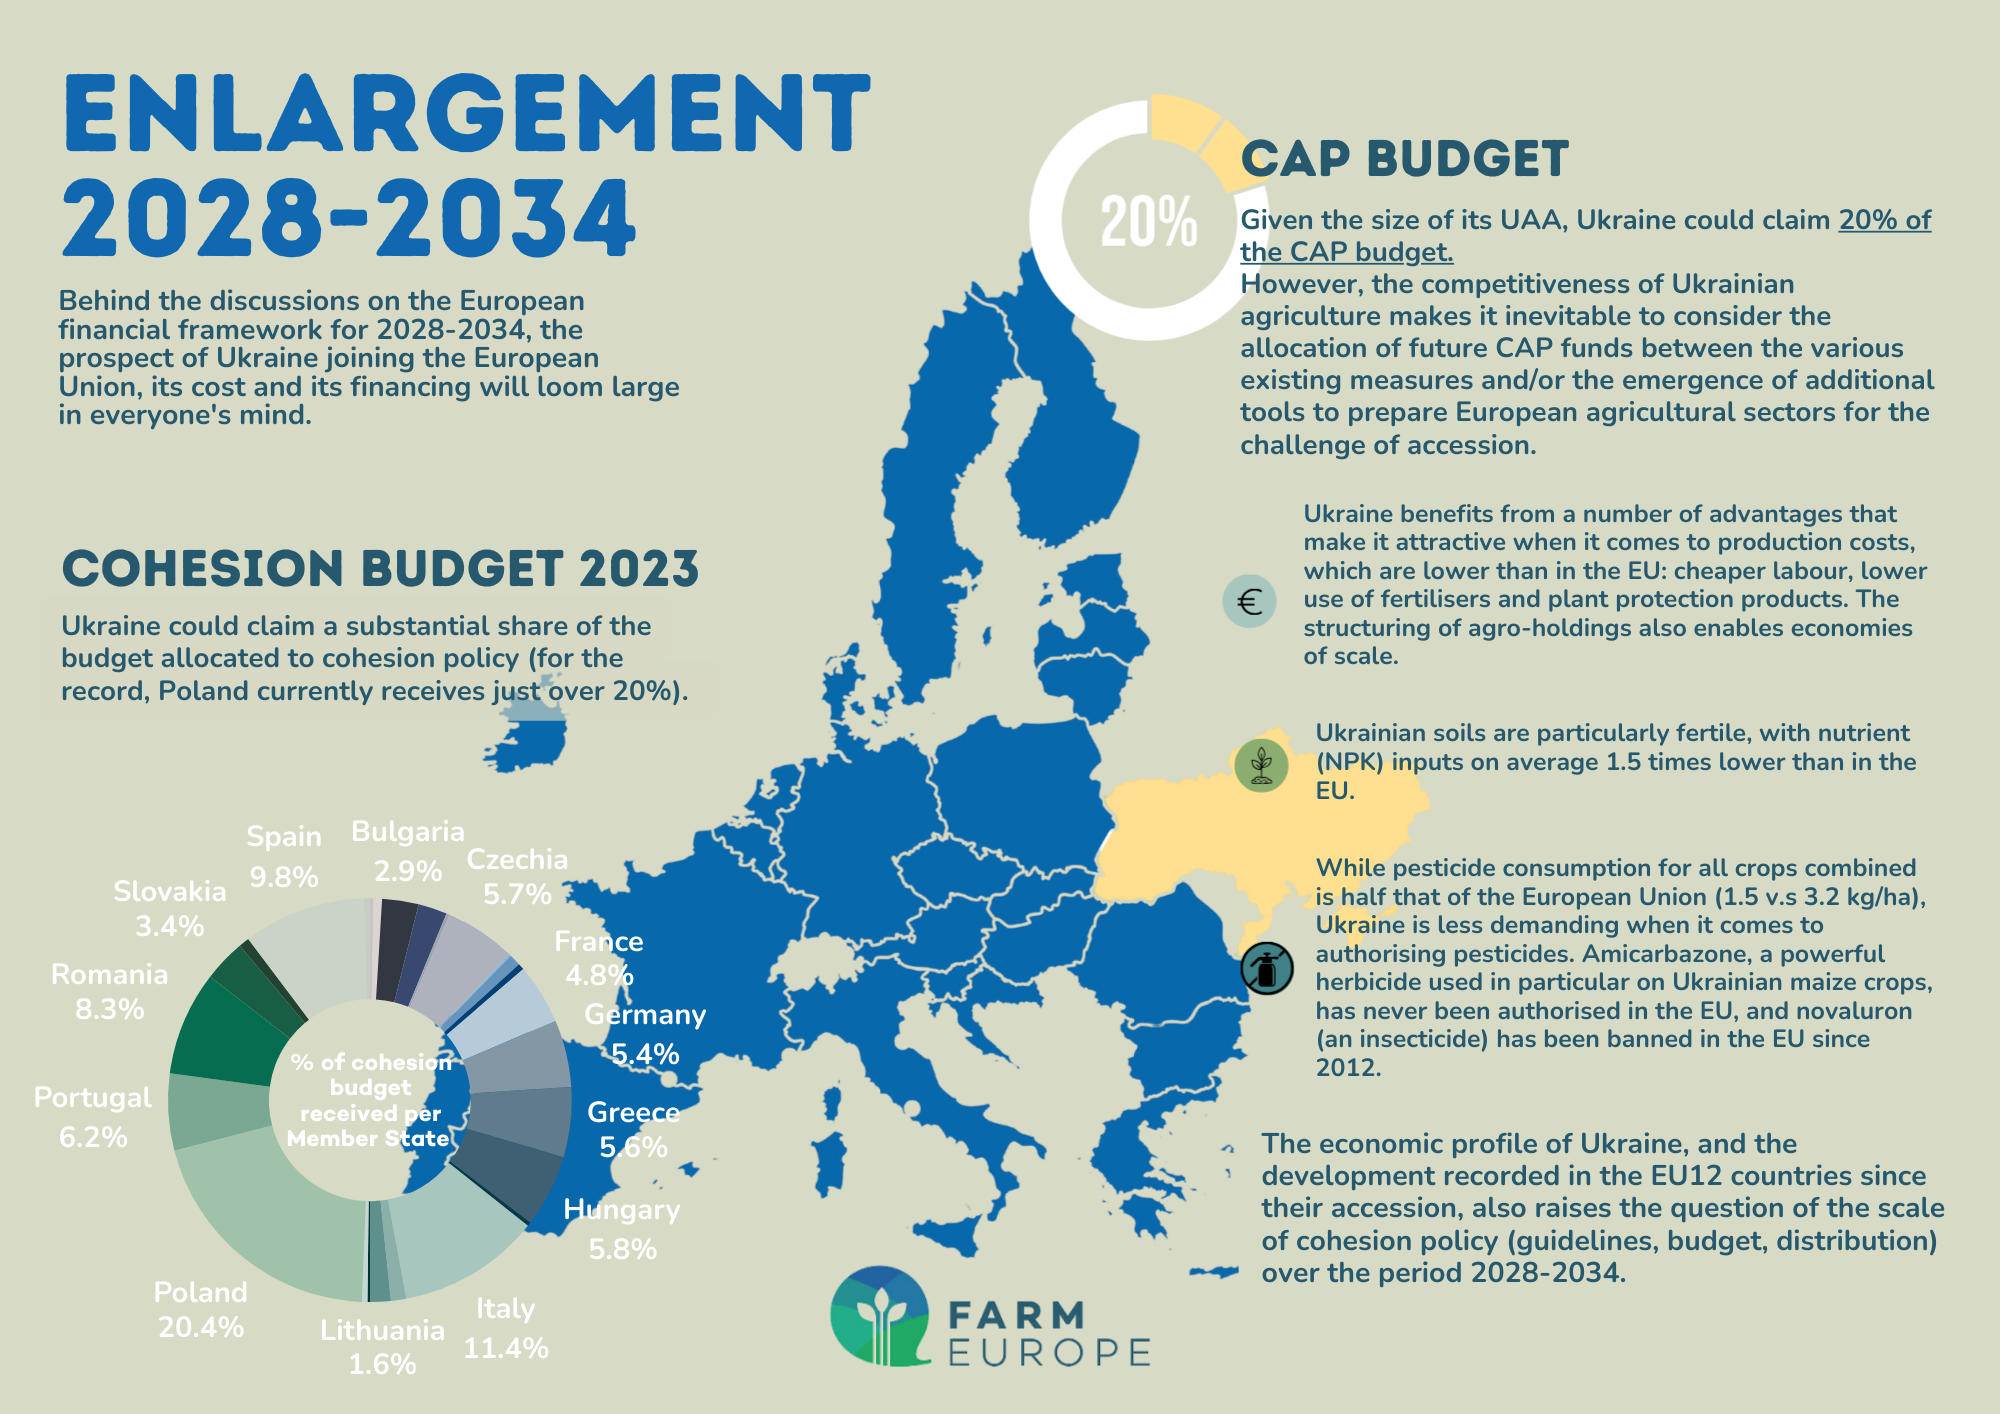
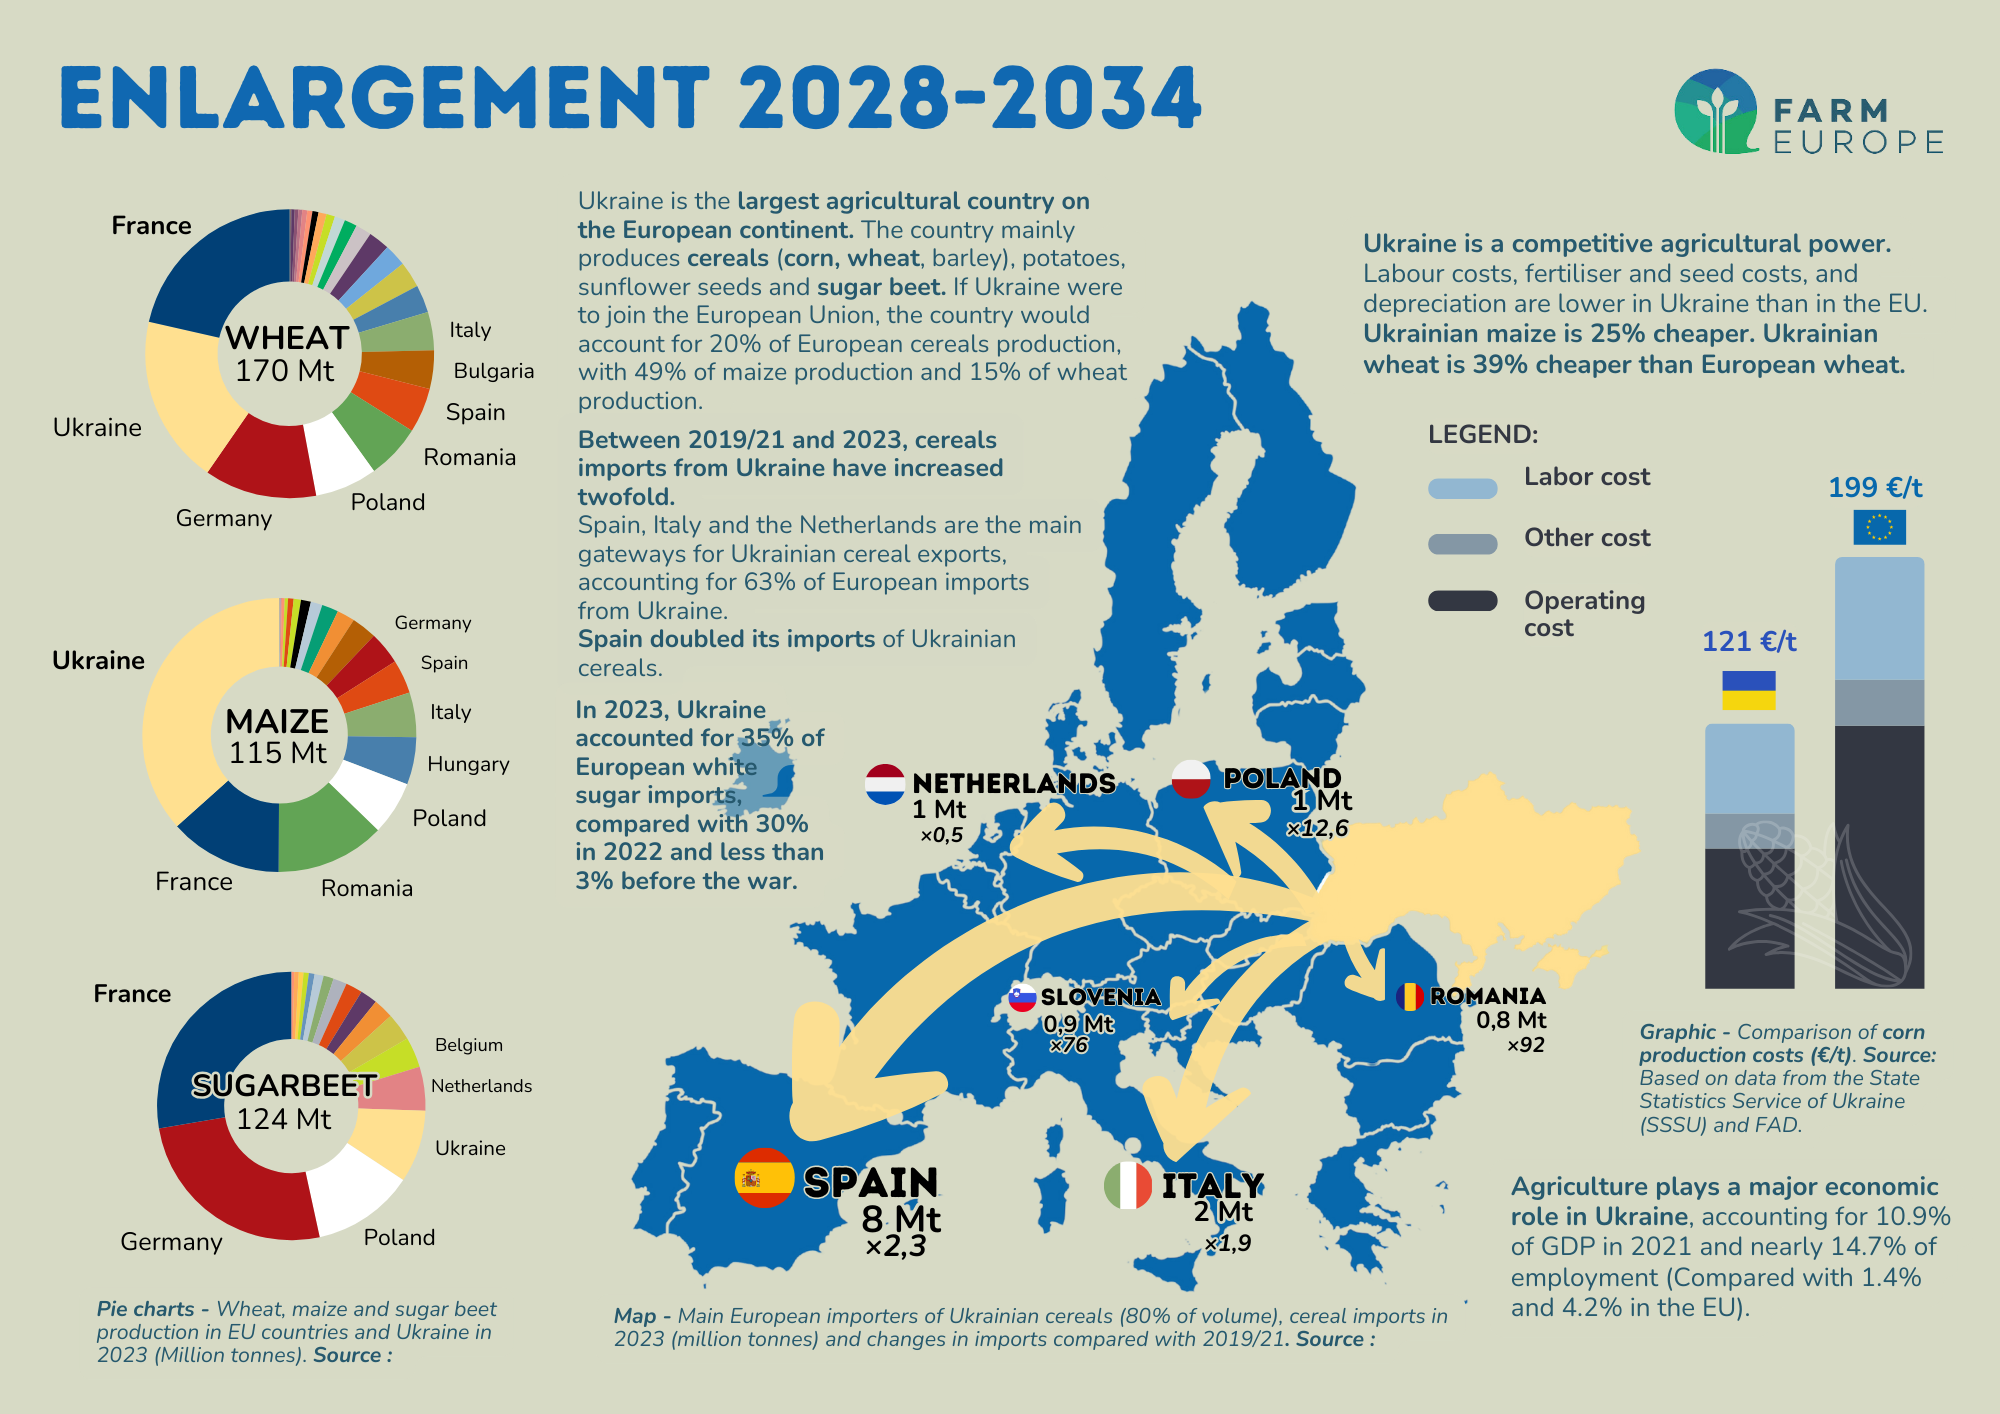
The EU must defend its agriculture offensive interests

It is now highly likely that the US decision to reinstate import duties on steel and alumina from the EU, and the inevitable EU response with retaliatory measures, will lead to the beginning of a trade war whose end is not in sight.

The EU has in the pipeline a decision to reinstate its retaliatory measures, suspended for several years following a negotiated truce, which include some US agriculture exports, such as maize and soya, but also other key products – such as bourbon – that could trigger the US to take other heavy counter-retaliation measures.

The US President has actually publicly declared that the US would up the ante to counter-retaliate, threatening 200% duties on EU wines.

The scene is set for a US-EU trade war, and unfortunately agriculture is part of it, although it was not the starting point.

We will examine what that means for the EU agriculture sector, who has the best cards, and what the outcomes could look like, which to a large extend depends on the capacity of the EU to stand together, leverage its firepower to protect its offensive interests, in particular in the agri-food sector already suffering from a lack of competitiveness and tensions with China.

THE RISK OF LOSING MARKET SHARE FOR EU AGRICULTURE & FOOD

The EU has enjoyed for a long period a large agriculture trade surplus with the US. In 2023 we exported EUR 27 180 million and imported EUR 11 744 million – a EUR 15 436 million surplus.

The US is our second largest export destination, after the UK, making 12% of our exports.

A closer look at the composition of EU trade with the US shows that it mainly exports some form of processed products, whereas it mainly imports commodities.

Looking at the very latest 2024 data, amongst our top exports are wines (EUR 4 894 million), spirits (EUR 2 890 million), olive oil (EUR 2 056 million), and cheeses (EUR 1 306 million). Beer, chocolate, pasta, hams, butter, other food preparations, also rank over the hundred million EUR worth of annual exports. 

The US top exports are soya (EUR 2 588 million), fruits and nuts (EUR 2 200 million), and spirits (EUR 1 076 million).

The disparity in the composition of our exports and imports raises another very important issue. Whereas the US can easily find other destinations for their soya exports in the event they are blocked in the EU, the same cannot be said regarding EU wine exports. Soya is a commodity, and if we stop importing from the US and instead import from South America, the many other world destinations will easily see previous South American exports be replaced by the US.

With respect to wine, if the EU is blocked in the US, it cannot simply shift exports to other destinations. The marketing and commercial specificities are totally different. It cannot easily compensate for the billions lost in the US by increasing exports to other markets. The EU would be able to increase to a certain extent its market share in other markets, but at the expense of lower prices and margins.

Unfortunately, the same reasoning applies to the EU cheese and ham exports, and to olive oil.

If the EU loses the US market for its top-quality cheeses and hams, it would face a close to impossible task to find alternative markets, or to grow in current markets. The case is even clearer regarding olive oil, where the EU is by far and large the world top producer facing little competition, which means there is little room to displace other competitors. In addition to that, it is close to impossible to displace other edible oils in the market, as both price and food habits are powerful head-winds.

We could go on making similar arguments on other high-value processed products.

The key conclusions to draw from this analysis are that:

  • As the EU enjoys a sizeable agri-food trade surplus with the US, it has potentially more to lose in this sector in an escalating trade war;
  • As the EU agri-food exports are more difficult to be diverted to other markets, the actual trade losses would be larger.
  • As the EU must defend its offensive interests in agriculture and food, retaliation measures and escalation must target other sectors and leverage the consumer markets that, for example, GAFAM cannot afford to lose. 

TRADE WARS BRING PAIN ACROSS THE BOARD

A trade war between the US and the EU will bring pain to both sides of the Atlantic. The economy will suffer, jobs will suffer. We will however focus on the consequences for the EU.

The extent of the pain depends on the width and depth of the dispute, on how many products it will concern and which tariff levels would be applied.

If the US completely scraps its WTO obligations, and imposes across-the-board higher duties on imports from the EU, the pain will be large and the US will not get out unscathed on the justified retaliation from the EU. The economic losses would be steep to both sides.

That is however not the likeliest scenario. Having said that, it makes little doubt that there will be some measure of application by the US of the new trade concept of reciprocity. At least for several products the US will impose tariffs that it finds commensurate to those it faces in the EU, with the aggravation that non-tariff barriers and VAT might be part of the calculations.

It is crystal clear that in so doing the US will tear apart the acquis of the GATT and the WTO.

Consolidated tariff schedules would become obsolete for the US. The US would no longer feel obliged by the world trade rules. 

The US openly admits that is precisely what it wants to do: fundamentally rebalance world trade.

The EU would feel compelled to apply retaliatory measures. In so doing the EU would stay in the boundaries of the WTO rules.

The US President has however indicated that if the EU retaliates, the US would escalate with counter-retaliations (200% tariff on wines). Where would it stop? What could be done to prevent a trade war that escalates with no end in sight?

A problem that negotiators will face is that the US and the EU would enter a potentially very harmful and escalating dispute following two radically different stances. 

The EU sees itself as a champion of WTO rules, will seek to impose respect of those rules, and is not prepared to break them. 

The US has departed from that standpoint, and seeks to pursue its national interest through the imposition of a new level playing field mixed with a mercantilist, or transactional, view.

This fundamental divergence makes it harder to find compromises. To give an example: if the EU and the US were to agree to a new set of tariffs to some products, the EU would feel obliged to apply those erga omnes, whereas that would be out of the equation for the US. To be clearer, the tariffs that the EU would agree with the US would apply to China and all the other WTO members, whereas the US would feel free to do as it sees fit.

Conceptually, under WTO rules, the only way for the EU to address the US push for reciprocity is through a Free Trade Agreement, but it is far from clear that the US is interested.

To make a solution to this dispute even more complex, we must factor in strategic, defence concerns, and unity of purpose and command.

The fact that the EU is dependent on the US to defend itself, and that even if it will now invest heavily on defence it will need some time to give all the expected fruits, gives the US an additional negotiating card that this Administration will not shy from using.

Moreover, EU Member States have different trade interests, different defence concerns and priorities, which might compound the difficulties of having to reach difficult decisions. On trade issues the EU has to some extent it easier to act, but this dispute has a strategic, and foreign policy dimension. 

CONCLUSION

The tensions initiated by the US are particularly harmful to the EU agriculture sector.

On agriculture, the EU has more to lose from an escalating trade war than the US. It has a sizeable trade surplus, and it exports products that cannot easily find alternative markets.

Whilst it is understandable and justified for the EU to retaliate, our core interests and cold-blood analysis call for working hard to minimize the impacts of those political developments, avoiding escalation and retaliations within the agriculture and food sector that would call for further measures from the US. 

The sector has every interest that a negotiated agreement be found. However, if such an agreement is out of reach for EU negotiators, they should try minimize the pain for agriculture and food, via retaliations outside this sector and also economic compensations to help the sector go through out the crisis until a solution is found, showing to the US that it is ready to protect European interests.

The EU is committed to the world trade rules, and its objective is to foster world trade under these rules.

The US pursues a paramount national interest policy (“America First”), and is seeking to change the rules to rebalance trade under a new reciprocity concept. 

It is important to strengthen the transatlantic partnership at a historic moment that demands cooperation to tackle global challenges – from climate change to food security and put into action any diplomatic effort aimed at fostering greater stability and sustainability in international trade.

Negotiators must find ways, out-of-the-box, to come to an agreement. As other strategic and defence issues are on the table, they could be addressed to settle the dispute as well, not mentioning the fact that on certain sectors like digital, trade relations is dramatically unbalanced in favour of the US, which the EU could target.

No clean industrial deal without a stronger EU agriculture

Today, the European Commission adopted its Clean Industrial Deal.

Presenting the roadmap and main policy initiatives to follow, the Executive Vice President, Stéphane Séjourné, summarized the ambition as a need to do more and better and create a real business plan, while underlining the will to focus on “Made in Europe.” This new political impetus is a welcome and clear step in the right direction for the European Commission. It will need to be the first milestone before further bold initiatives to truly reconcile competitiveness and the green transition.

The role of agriculture must be stressed in this context : there will be no Made-in-Europe Clean Industrial Deal without more and better agricultural products. Whether it concerns renewable energy, chemicals (including bioplastics), textiles, or biomaterials for buildings, a large share of input will have to come from agriculture.

The role of agricultural biomass must be further underlined and fully reflected into the future bioeconomy strategy. Also in this sector, Europe should seek for sustainable intensification, in other words, to produce more and better. The bioeconomy agricultural values chains are strategic if Europe is willing to build a sovereign, efficient and affordable carbon neutral economy.

Therefore, Farm Europe calls upon the European Commission :

•⁠ ⁠To further integrate its agricultural and industrial strategies to unlock the potential contribution of farmers to the bioeconomy without unnecessary obstacles. For example, the crop cap on biofuels should be increased, the limitations in the taxonomy lifted and additional incentives created for other bioeconomy sectors going beyond traditional targets to create markets ;

•⁠ ⁠To strengthen its controls and certification mechanisms to stop unfair competition from imported products and establish robust sustainable value chains. Currently, fraudulent labelling, certification practices and lack of controls undermine the development of Made in Europe bioproducts. For example the credibility Annex IX A biofuels require urgent actions from the European Commission.

EU / Ukraine: analysis of the main agricultural crop sectors

As part of the process of enlarging the European Union to include Ukraine, Farm Europe has analysed both the weight and comparative competitiveness of Ukraine’s main crop sectors compared to those of the European Union. 

The difference in competitiveness ranges from 19% to 39% depending on the sector, with structural factors accounting for most of the difference. To this must be added the ‘carbon’ competitiveness conferred by the natural richness of Ukraine’s soils. 

At a time when the steps and conditions of accession are about to be drawn up and the pre-accession programmes defined and launched, we feel it is important that objective data can serve as a basis to define the European Union’s roadmap, without bias or avoidance.

Ukraine & European Union: key figures for the main agricultural crops 

In 2022, Ukraine’s utilised agricultural area covered 41.3 million hectares, including 32.7 million hectares of arable land (State Statistics Service of Ukraine (SSSU)). This agricultural area makes Ukraine the largest agricultural country on the European continent. 45% of the country’s surface area is made up of humus-rich, particularly fertile soils known as ‘rich’ chernozems.


Marked by its communist past, the Ukrainian agricultural sector is characterised by 110 huge vertically integrated agricultural companies, known as agro-holdings, which control all or part of the production chain (crop-livestock, processing, trade). These entities aim to maximize returns on invested capital, investing heavily in cutting-edge, large-scale equipment and the use of inputs. Twenty of these companies are estimated to control 14% of Ukraine’s Utilised Agricultural Area (UAA), and 57% of the UAA is farmed by enterprises of more than 1,000 ha. Agriculture plays a major economic role in the country, accounting for 10.9% of GDP in 2021 and almost 14.7% of employment.

Sugar

The organisation and competitiveness of the Ukrainian sugar sector is very different from that in Europe: agro-holdings, huge vertically integrated farms, cultivate 93% of the sugar beet area. The average cultivated area is 23,700 ha, 1,763 times more than in the European Union. 

Ukraine has much lower labour and investment costs. What’s more, the presence of fertile soils means that fewer inputs are used on crops: up to 1.5 times less fertiliser than in the European Union

The opening up of the European market to Ukraine has resulted in an influx of sugar, which has led to an increase in European stocks. Exports of sugar from Ukraine to Europe have increased by 230% between 2022 and 2023, with a forecast export capacity to the EU of 800,000 tonnes to 1 MT. The introduction of safeguard measures now limits exports for the time they are in force. 

Detailed analysis for the sugar sector

Cereals

Cereal production is not as dominated by large farming structures as the sugar sector: 51% of production is carried out by structures of less than 1,000 ha. It should be noted, however, that 22% of production is carried out by companies with more than 3,000 ha

If Ukraine were to join the European Union, the country would account for 20% of European cereals production, with 49% of maize production and 15% of wheat production. 

Ukrainian cereal production costs are on average 30% lower than those in Europe. 

For these reasons, grain imports from Ukraine have doubled between 2019/21 and 2023. The European Union has become a pillar of support for the Ukrainian economy, accounting for 51% of wheat exports in 2023, compared to 30% in 2021.

Detailed analysis for the cereal sector

Sunflower

While 58% of production is carried out by structures of less than 1,000 ha, companies with more than 3,000 ha account for 17% of production. In 2023, Ukrainian production alone was greater than the entire EU’s production. As such, if Ukraine were to join the European Union, the country would become Europe’s leading producer of sunflower seeds, as well as sunflower oil. 

Ukraine has been the EU’s leading supplier of sunflower oil for around ten years now. The opening up of the European market to Ukraine has had no significant impact on the flow of sunflower oil from the country.

Detailed analysis for the sunflower sector

Rapeseed

Farms of less than 1,000 ha account for 73% of rapeseed production, but oil production is dominated by 5 companies which accounted for 92% in 2021.

In 2020, the cost of rapeseed production in Ukraine was, on average, 1.5 times lower than in France.

Compared to the 2018-2021 average, Ukrainian production of rapeseed and rapeseed oil has risen by 57% and 174% respectively. Similarly, exports grew by 37% and 170% respectively. If Ukraine were to join the European Union, it would become the leading rapeseed producer in the EU, accounting for 24% of seed production and 4% of oil and meal production.

The EU was already the largest importer of Ukrainian rapeseed products before the war.

However,  imports of rapeseed have increased, and the EU now receives 93% of Ukraine’s rapeseed exports, compared to 83% in 2020/21.

Detailed analysis for the rapeseed sector

(Click on the image to enlarge it)

Long term solutions needed to cope with the surge of imports from Ukraine

Yesterday, Agriculture Commissioner Janusz Wojciechowski intervened in the Agriculture Committee on the situation on the European cereals market in relation to the war in Ukraine and the end of the “Black Sea grain deal”.

The Commissioner wanted to explain in detail the enormous pressure that the import of Ukrainian cereals has brought to the market of the five neighboring countries (Poland, Romania, Slovakia, Hungary, Bulgaria) and which has justified the block of imports of maize, wheat, rapeseed and sunflower seeds in these countries until 15 September.

This protectionist measure will therefore soon expire and the Commissioner said he was concerned about the impact this could have on the markets. Mr Wojciechowski recalled that in 2022 Ukrainian grain poured into the five countries to the value of EUR 5 billion more than before the war. The Commissioner then presented his proposal -and he emphasized that it is his proposal that has not been validated by the Commission and will be discussed at the College- to break the deadlock.

According to the Commissioner, today it is possible to export from Ukraine through the solidarity corridors, but cereals still remain in the EU (and do not go to third countries as was previously the case) due to the increased transition costs of passing through several European countries and ports, greatly increasing the cost of Ukrainian cereals and making them uncompetitive for third countries. This is why the Commissioner is proposing European transit subsidies to cushion these additional costs and proposing compensation of €30 per tonne. The Commissioner believes it would therefore take a budget of EUR 600 million to cover 20 million tonnes of cereals.

According to our assessment this proposal of a transport subsidy would equal an export subsidy which would directly compete with local production in third countries. Therefore it will not probably not be accepted internally after the European Commission legal assessment. Instead, we consider that the focus of the European Union should be in fostering alternative logistic facilities and processing within the European Union in order to rebalance markets and invest in sustainable, long term solution instead of short term quick fix that are legally uncertain and not viable in the medium to long run.

However it is clear that solutions must be put on the table. Our infographic with the latest figures from European customs highlights the continuing dynamic of cereal and oilseed imports from Ukraine, a minima jusqu’au mois de juin pour lequel les données sont disponibles. Sugar imports, which did not exist before autumn 2022, have increased to significant levels, upsetting the balance of the domestic market.

During the 5 first months of 2023, the EU imported 3 Mt of wheat (meaning the whole 2022 imports), has increased by + 60 % its imports of maize compared to the same 2022 period (Jan-June), + 200% its imports of soja and by a dramatic 1180% the sugar imports.

Therefore, measures are needed to help Ukraine to export its productions while preserving a fair and balanced EU agri market. The EU should support investments in infrastructures and processing.

Are anti-erosion measures fair play for farmers in Wallonia?

In response to criticisms related to the complexity of the Common Agricultural Policy (CAP) and its disconnection from reality, the European Commission has proposed the implementation of national strategic plans, leaving it up to the Member States (or regions) to define the details of the measures to be implemented for farmers to get direct payments. This is a key feature of the new CAP, with serious impacts on the level playing field at EU level for farmers. The implementation of GAEC5 is shedding lights on this new reality, with farmers in Wallonia paying the high price.

Articles 12 and 13 of Regulation 2021/2115 of the Common Agricultural Policy (CAP) deal with conditionality, i.e., the set of obligations relating to good agricultural and environmental conditions (GAEC) that farmers must comply with to access funds from the first pillar of the CAP. The national plans submitted by the Member States must specify the details of these measures, indicating concretely how they intend to apply them to their farmers. Although this new approach, initially presented as a common-sense evolution in response to the failure of multiple attempts to simplify the CAP, it nonetheless presents a major obstacle. As far as basic aid is concerned, it places European farmers in the face of variable rules, with sometimes strongly divergent economic and agronomic impacts.

Each of these GAEC measures aims to address common environmental, health or animal welfare challenges, with the ambition of having a positive impact on a very large scale across the entire territory of the European Union, mobilizing a collective effort of all EU farmers. These actions must complement other specific measures and financed within the framework of eco-schemes or agro-environmental measures. All national (or regional) strategic plans are known. Even, many Member States are already preparing to adjust their initial plan, with the insights of one year of implementation. It is therefore useful to examine the details, analyzing not only their but also their socio-economic impacts. It appears that national or regional administrations are sometimes just as – if not more – creative than the European administration in terms of complexity, sometimes leaving farmers isolated in the face of an increased risk of inequitable treatment, without any real European debate.

In this regard, the analysis of GAEC 5 is particularly significant. Faced with the important challenge of soil erosion, the cross-compliance rule in the EU regulation states that it is necessary to “manage soil work in order to reduce the risk of degradation and erosion, taking into account the slope.” The objective to be pursued is that of “minimal land management reflecting specific local conditions in order to limit erosion.”

It plays an important role at the European level, alongside GAEC 4 and 6, in combating this phenomenon that affects the long-term fertility of soils. All other parameters are now the responsibility of the Member States or regions. They are the subject of the comparative study below. Previously, despite some flexibility, most of the details were fixed by a delegated act of 2014, which established the basic principles of minimum soil cover, the minimum area of farms that must be covered to comply with this GAEC, crop rotation or reduced tillage.

The challenge of erosion throughout the European Union

It is important to recall that erosion is a challenge affecting all regions of the European Union, without exception, as shown by the recently published data from the Joint Research Centre in the context of discussions on soil strategy. By far, the most significant vector of soil erosion, both quantitatively and geographically, is water. This affects most Member States, with a stronger impact on Mediterranean countries and Central European countries. Erosion caused by ploughing also has a very large geographical impact, affecting all Member States, with a lesser impact in part of Belgium, the Netherlands, some regions in northern Germany and Poland.

As for wind erosion or erosion caused by harvesting, they are indeed more localised: the former occurs on the northwest coast, some regions of the Black Sea, southern Italy, or northern Spain, and the latter occurs in crop areas where uprooting is involved. The latter represents a much smaller part of the erosion phenomenon at the EU level. Measures planned under GAEC5 have limited relevance regarding harvest erosion. Combating this requires technical means aimed at limiting the amount of soil carried away during the harvesting of potatoes or beets through gentle digging or the use of specific conveyor belts.

Diverging ways to define targeted areas

In the case of Wallonia, the GAEC5, which determines the granting of all aid to farmers, is particularly detailed and expensive. Wallonia’s approach is very different from that of the majority of other Member States. We will analyse it in detail.

One substantial difference lies in the criteria used by Member States to define the areas to take specific actions. The vast majority of Member States (BG, EE, EL, ES, FR, HR, IT, CY, LV, LT, HU, MT, PL, PT, SI) only mention the “slope” of the soil as a criterion for defining intervention areas and almost always refer to areas with a slope greater than 10%.

Regarding other national plans, the criteria are, however, different. Generally, they are related to differentiated slopes or measures that apply to all areas, regardless of their erosion risk.

For example, Austria’s strategic plan refers to a soil slope greater than 10% but also prohibits agricultural machinery from working on frozen, water-saturated, flooded, and snow-covered soil. Ireland refers to slopes greater than 15% and 20%, but also proposes criteria for all meadows. Plowing of all meadows is prohibited between October 16th and November 30th. For the Netherlands, measures exist for slopes greater than or equal to 2% and greater than 18%. And for Slovakia, specific measures for areas severely threatened by water or wind erosion are mentioned, without specifying criteria. The measures apply to slopes greater than 3%. Finland, Denmark, and Sweden introduce criteria related to the proximity of soils to watercourses.

The Wallonia Region, on the other hand, stands out for its approach. It identifies three zones (high erosion risk, very high erosion risk, extreme erosion risk) using an equation based on the revised universal soil loss equation (RUSLE), which takes into account the following factors: the rainfall erosivity index, the soil erodibility index characteristic of the soil type and its properties, and the topographical factor combining slope length and steepness.

The only national plans that, along with Wallonia, identify different territorial zones with differentiated erosion risks based on multiple criteria are those of Flanders, Germany, Luxembourg, and the Czech Republic. However, these Member States use this tool with significant differences to be taken into account compared to the plan of Wallonia.

The strategic plan of the Flemish Region also provides that “the sensitivity to erosion of a plot is determined based on a calculation model of the average annual potential erosion per hectare using the Revised Universal Soil Loss Equation (RUSLE). Thus, slope, slope length, and soil type are taken into account. There are six erosion sensitivity classes: very high (purple), high (red), medium (orange), low (yellow), very low (light green), and negligible (green). But the impact of this formula in Flanders is marginal compared to that for Wallonia, according to the respective simulations carried out by the Wallonian (FWA) and Flemish (Boerenbond) agricultural organisations (1).

The German strategic plan delegates the designation of erosion risk zones to the Länder, based on uniform criteria, such as soil erodibility factor, slope factor, rainfall and surface runoff erosion factor, and wind erosion risk. The Czech strategic plan identifies several erosion risk zones based on the following criteria: slope length and steepness, structure and texture of the arable layer, soil organic matter content, soil erosion sensitivity, protective effect of vegetation, effectiveness of anti-erosion measures, and soil profile permeability.

Finally, the Luxembourg strategic plan uses a methodology based on multivariate statistical learning (machine learning) for arable land for classifying erosion risk zones. The calculation of potential erosion from RUSLE is only used for grasslands. In addition, there are measures for all agricultural land, for example, existing retention terraces must be maintained on the entire UAA (in arable land, permanent grassland, and permanent crops).

Ambition divide: various approaches for the same measure

As for intervention measures, there are numerous ones. The most common ones are related to soil work restrictions, such as the prohibition of plowing during certain periods. Twenty national plans provide for such measures (AT, BE-FL, BE-WA, CZ, DE, DK, EE, IE, FR, IT, CY, LT, LU, HU, MT, NL, RO, SI, SK, SE). In addition, 13 strategic plans (AT, BG, DE, EE, EL, ES, FR, HR, LV, MT, PL, PT, RO) include measures on the orientation of soil work relative to slope. Twenty-three strategic plans (AT, BE-FL, BE-WA, BG, CZ, DE, DK, EE, IE, EL, FR, HR, IT, LV, LT, LU, HU, NL, PL, SI, SK, FI, SE) include measures related to vegetation cover.

In addition to these common measures, many Member States or regions are identifying other measures to combat soil erosion. For example, the “anti-erosion strip”. Denmark, Finland and Sweden refer to a buffer strip along watercourses with a ban on fertilisation, spraying, and soil work on a minimum width of three meters (six for Sweden), a measure that also meets GAEC4, but which they also consider as an anti-erosion measure. Germany and the Czech Republic mention buffer strips as an anti-erosion measure, but do not specify their length, with Germany leaving the details of the measures to the Länder. The Luxembourg strategic plan provides for the mandatory installation (except in the case of meadows) of anti-erosion grass strips with a minimum width of 3 meters in areas with a high and medium risk of erosion. France and Austria also provide for vegetated strips, with a minimum width of 5 meters in both cases, as an anti-erosion measure.

Conclusion

The analysis of the 28 strategic plans of the new Common Agricultural Policy (CAP) shows that only the Walloon and Flemish plans mobilise for all agricultural land in their region the RUSLE mapping methodology to target the implementation of GAEC5. Flanders is less concerned with this mapping, given the strong topographical differences with Wallonia.

These two plans also stand out for the size of the buffer strips, which can be up to 9 meters. The impact of the targeting methodology of the plots excluding most Flemish farmers from the system means that the choices made in implementing GAEC5 in Wallonia put farmers in a unique position in Europe of competition distortion compared to other European farmers, including those in very similar regions.

This is despite the fact that it is a cross-compliance measure that impacts all CAP support, not just a specific measure that is subject to ad hoc compensation or incentive. While the options taken by some Member States can be explained by particular agronomic, climatic or topographic conditions, it is difficult to single out Wallonia to justify such a difference in approach in the implementation of this GAEC.

The expected impact in Wallonia is disproportionate compared to the impact of the same measure elsewhere in the European Union. However, unlike agri-environmental measures or eco-schemes, it does not involve additional remuneration to compensate for these distortions. It is mandatory for all farmers concerned, and not just targeted to those who wish to engage in practices on a voluntary and specifically remunerated basis.