September 2018 The CAP has a few provisions that aim at tackling the crisis that all too often plague the agriculture sector. It can be argued that direct payments provide a welcome first layer of income stabilization, but they are not designed to respond to sudden crisis, climatic or market driven. The CAP also offers some support […]
Our Works
GROWTH - 6 December 2019
Economic and environmental performance of digital agriculture
December 2019
Introduction
In response to environmental and climate challenges and societal expectations, the post-2020 CAP project proposes to raise its environmental ambitions to facilitate and encourage the consideration of these issues in agricultural practices. A balance between the economic and environmental dimensions is essential to ensure stability and profitability for farmers and to establish a sustainable CAP (Jereb et al., 2017; COMAGRI, 2019).
The Ecoscheme plan is a new tool proposed in the post-2020 CAP reform that is intended to be a driving force in the transition to a more sustainable agriculture (COMAGRI, 2019). It replaces the greening of income support introduced in the 2013 reform. Like the greening measures, the Ecoscheme plan makes it possible to devote a share of direct payments to environmental and climate protection (COMAGRI, 2019).
The content of the Ecoscheme plan has the dual objective of ensuring unity of action and ambition while being flexible enough to respond to local issues. One idea to achieve this goal would be to stimulate the transition to more sustainable agricultural systems.
Faced with recurrent reproaches concerning the lack of quantification of the effects of the CAP, simple policy tools offering a solid follow-up of results across Europe are desired, both by actors in the agricultural world and by European decision-makers.
The link between agriculture and the environment should be maintained and strengthened, in continuity with previous CAPs. The new tools available to agriculture claim to ensure economic and environmental results. If this is the case, they would make it possible to achieve this dual economic and environmental performance. More widespread, they could ensure an accurate assessment of the effect of the policies put in place.
Thus, faced with the challenge of defining a European framework for Ecoscheme and of implementing it with concrete results, the aim of this study is to assess the economic and environmental performance of the different agricultural systems with and without recourse to precision farming.
Contents
1. BACKGROUND
1.1. The Common Agricultural Policy, CAP
1.1.1. An environmentally friendly CAP
1.1.2. Current CAP
1.1.3. Greening objectives
1.1.4. The results of this measure
1.2. Issues to be addressed in the reform of the future CAP 2021-2027
1.1.5. Environmental issues
1.1.6. Societal expectations
1.1.7. Economic issues of the agricultural sector at different scales
1.1.8. Balance sheet: the need for dual performance
1.3. Ecoscheme Plan
1.1.9. Purpose
1.1.10. Structure
1.1.11. Content
1.1.12. Stimulating the transition to certain farming systems
1.1.13. Monitoring the impact of this plan at farm level
1.1.14. The value of precision farming in improving the environmental performance of farms
1.4. Issues
2. STATE OF THE ART
2.1. Definition
2.1.1. Digital agriculture and smart farming
2.1.2. Automation of agriculture
2.1.3. Precision agriculture
2.2. Tools by type of production
2.2.1. Precision breeding
2.2.2. Tools related to the management of agricultural land
2.2.3. The cost of these tools
2.3. The different levels of input management tools in crop production
2.4. The development of digital agriculture in Europe
2.4.1. General data
2.4.2. Goals sought by farmers
2.4.3. The relevance of digital farming to European agricultural policies
2.4.4. Sustainability of European digital agriculture on a global scale
2.5. Factors hindering the development of digital agriculture
2.5.1. Farmers’ barriers to adopting these technologies
2.5.2. The complexity of technologies
2.5.3. Lack of infrastructure
2.5.4. Standards issues
2.5.5. Knowledge and expertise issues
2.5.6. Challenges in managing data from digital agriculture
2.6. Role of the European Union in relation to these challenges
2.7. The challenge of a quantitative analysis of the performance of these tools
3. METHODOLOGY
3.1. Data collection
3.1.1. Data providers
3.1.2. Crops concerned
3.1.3. Type of data collected
3.1.4. Cost of ODAs by input
3.2. Data processing
3.3. Results calculated from the data
3.3.1. Results to be calculated for a complete analysis
3.3.2. Results based on available data
4. EVALUATION OF ECONOMIC AND ENVIRONMENTAL PERFORMANCE
4.1. Irrigation management
4.1.1. Almond cultivation
4.1.2. Cotton cultivation
4.1.3. Olive growing
4.1.4. Peach cultivation
4.1.5. Pistachio cultivation
4.1.6. Potato cultivation
4.1.7. Grape growing
4.1.8. Maize cultivation
4.1.9. Performance assessment of DMOs related to irrigation management
4.2. Pesticide management
4.2.1. Almond cultivation
4.2.2. Beet growing
4.2.3. Wheat cultivation
4.2.4. Soft wheat
4.2.5. Cotton cultivation
4.2.6. Bean cultivation
4.2.7. Cultivation of kiwifruit
4.2.8. Olive growing
4.2.9. Barley cultivation
4.2.10. Peach cultivation
4.2.11. Pistachio cultivation
4.2.12. Chickpea cultivation
4.2.13. Potato cultivation
4.2.14. Grape growing
4.2.15. Stevia cultivation
4.2.16. Tomato cultivation
4.2.17. Assessment of the performance of DMOs related to pesticide management
4.3. Fertilisation management
4.3.1. Almond cultivation
4.3.2. Wheat cultivation
4.3.3. Rapeseed cultivation
4.3.4. Cotton cultivation
4.3.5. Growing lettuce
4.3.6. Olive growing
4.3.7. Barley cultivation
4.3.8. Peach cultivation
4.3.9. Potato cultivation
4.3.10. Grape growing
4.3.11. Tomato cultivation
4.3.12. Performance assessment of DMOs related to fertiliser management
4.4. Summary of ADO performance by crop
4.4.1. Almond cultivation
4.4.2. Wheat cultivation
4.4.3. Cotton cultivation
4.4.4. Olive growing
4.4.5. Barley crops
4.4.6. Peach cultivation
4.4.7. Pistachio cultivation
4.4.8. Potato cultivation
4.4.9. Grape growing
4.4.10. Tomato cultivation
5. DISCUSSION
5.1. Performance of ADOs
5.1.1. Environmental performance
5.1.2. Economic performance
5.1.3. Limitations and perspectives of the analysis
5.1.4. Assessment of ADO performance
5.2. Consequences of the implementation of digital agriculture
5.2.1. Impact on jobs
5.2.2. Digital agriculture in relation to farming systems
5.2.3. Digital agriculture and the diversity of European farms
5.3. Stimulating the transition to digital agriculture
CONCLUSION
BIBLIOGRAPHY
1. Context
1.1. The Common Agricultural Policy
1.1.1. An environmentally friendly CAP
The Common Agricultural Policy (CAP), created in 1962, aimed at providing affordable food in Europe and a decent living for farmers. In addition to this economic orientation, supporting agricultural markets and producers, an environmental dimension has been added since the 1990s (European Commission, 2019). In 1985, the Council introduced for the first time – in Article 19 of Regulation 795/85 – the notion of protection of agricultural habitats and landscapes. In 1991 the Commission stressed the importance of encouraging environmentally friendly production. The integration of environmental requirements into the CAP during the Mac Sharry reform in 1992 followed this orientation. Environmental protection has become increasingly important in the course of agricultural policy reforms, and has become one of the three main pillars of the 2013 Ciolos reform (European Commission, 2019).
Farmers, encouraged to minimise their environmental footprint by changing their practices, have achieved a 21% reduction in GHG emissions through more efficient use of fertilisers between 1990 and 2014 (COMAGRI, 2019). Today, European society seems to be expressing strong expectations regarding the link between agriculture and the environment. The sector is expected to provide answers, particularly with regard to climate change.
1.1.2. Current CAP
In order to improve the environmental and climatic performance of the CAP, the 2013 reform introduced a ‘greening’ measure, also known as a ‘green payment’. This measure represents 30% of direct payments. Put into practice in 2015, this measure remunerates farmers for carrying out practices that benefit the environment, providing basic public goods (Jereb et al., 2017).
1.1.3. Greening objectives
Greening aims to encourage simple and environmentally beneficial agronomic practices across the EU. These practices are implemented by millions of farmers, over large parts of the European territory. Greening measures have to meet three environmental objectives. The first one is to improve soil quality, in particular by increasing the level of organic matter through mandatory minimum crop diversification. The second one is to preserve and improve biodiversity by including a certain percentage of areas of ecological interest, EIS, on farms. Fallow land, catch crops and nitrogen-fixing plants, and certain topographical features are part of these EIS. The last environmental objective is the sequestration of carbon by permanent grasslands, by ensuring the protection of the latter (Jereb et al., 2017).
1.1.4. The results of the greening measures
The European Court of Auditors’ report questions the effectiveness of the greening measures put in place. The Court estimates that these measures have only led to positive changes for 5% of farmers. 65% of them would not have had to change their practices to be eligible for these aids (Jereb et al., 2017). However, in its assessment, the Court of Auditors only notes the positive changes in practices made by farmers. It does not take into account the maintenance of environmentally beneficial practices already implemented by farmers. According to the Commission, 77% of the European Union’s agricultural land is affected by greening.
These observations show the lack of clarity of the environmental objectives and raise the ambivalence of these measures. Should they encourage farms to become more environmentally friendly or should they reward farmers for environmentally beneficial practices?
However, it is stressed that the 2013 CAP has built coherence, based on common European objectives, between these greening measures, cross-compliance standards and requirements, and rural development commitments (Jereb et al., 2017).
1.2. Issues addressed in the 2021-20227 CAP reform
1.1.5. Environmental issues
The Court of Auditors raises among its recommendations the importance of establishing quantified environmental objectives. It also stresses the need to develop models that will monitor the impact of future CAP environmental measures on the environment and climate (Jereb et al., 2017).
In addition, many environmental commitments have been made by the European Union at international level since the 2013 reform. These include the target of a 40% reduction in GHG emissions by 2030, agreed at the Paris agreements in 2015 and the United Nations Sustainable Development Goals (SDGs) (European Commission, 2018). The themes of combating and adapting to climate change, sustainable management of natural resources (water, soil and air) and the preservation of biodiversity and ecosystems are among these objectives. The SDGs state that the achievement of these goals requires policies and strategies at the national level (United Nations, 2019). In the context of these commitments, three of the nine objectives of the 2023-2027 CAP are related to the environment and take up the themes of the SDGs.
1.1.6. Societal expectations
European citizens expect safe, nutritious and fairly priced food from the agricultural sector. At the same time, there is a growing desire for a more sustainable agriculture, including a greater focus on the origin and on quality of food. The of sustainability includes protecting the environment, combating climate change and defend/increase biodiversity and animal welfare (COMAGRI, 2019). The impact of agriculture on the health of producers is also a frequently raised issue. A European survey also highlighted the desire to strengthen the role of farmers in the food chain and to support rural communities and family farming (DGCOMM, 2016).
Many actors, including the agricultural unions, want farmers to be the driving force behind these changes and are calling for support in the agricultural transition, and for the CAP to be simplified in terms of administration, its use, and sanctions. Policies with concrete objectives, clear and rigorous indicators are expected.
1.1.7. Economic issues of the agricultural sector at different scales
Agricultural policies must enable farmers to produce quality food, public goods and services in response to consumer expectations while ensuring a decent income (European Commission, 2019). The imperative of food security is not negotiable both when it comes to EU consumers or answering to expectations of the world markets notably of our Mediterranean and African neighbours.
The agricultural sector must be supported in the form of remuneration for the non-market goods it produces, in view of the cost distortions linked to the societal choices that the European Union has made, as well as in view of the markets and their increasing volatility.
Besides the fair remuneration of non-market goods by the CAP, the challenge is to strengthen the position of farmers within supply chains -that tend to reduce the cost of raw materials (European Commission, 2019)-. It is also a matter of encouraging farmers to plan ahead by investing while giving them the tools to manage price and market volatility, besides protecting them against the impacts of deep crises of essentially exogenous origin.
On an international scale, Europe’s competitiveness must be strengthened so that the European Union can consolidate its position on the world markets for the various market segments – assuming its responsibility for the supply and stability of food markets – and reinforce its degree of autonomy, particularly in terms of protein.
1.1.8. Assessment: the need for dual performance
In response to environmental and climate challenges and societal expectations, the post-2020 CAP proposes to raise its environmental ambitions to facilitate and encourage the consideration of these issues in agricultural practices. A balance between the economic and environmental dimensions is essential to ensure stability and profitability of work for farmers and to establish a sustainable CAP (Jereb et al., 2017; COMAGRI, 2019).
1.3. Eco-schemes
1.1.9. Goal
The Eco-schemes are a new tool proposed in the post-2022 CAP that aims to be a driving force for a transition towards more sustainable agriculture. This measure replaces the greening of income support introduced in the 2013 reform. Like the greening, the Eco-schemes to earmark a share of the direct payments pillar to be devoted to environmental and climate protection (COMAGRI, 2019).
1.1.10. Structure
Eco-schemes involve per-hectare aid that, however, varies from one state to another (or even from one region to another) and from one measure to another, which farmers would receive annually depending on the environmentally and climatically beneficial practices they implement. It is mandatory for Member States to foresee eco-schemes in their national strategic plans. Nevertheless, they are free to choose the measures to be included and the environmental requirements of these measures, which are optional for farmers.
In order not to create overlaps with other CAP measures, the practices and schemes promoted by the eco-schemes should ensure higher environmental benefits than those required for environmental cross compliance[1] . This environmental cross-compliance should be implemented by Member States under the CAP. However, the Commission concedes a very high degree of subsidiarity in the actual requirements made on their farmers in this respect. The practices and benefits should also be different from the commitments of the GAEC[2] , Good Agri-Environmental and Climatic Measures, of the second pillar.
The European Parliament’s Agriculture Committee, COMAGRI, fought to include in the CAP deal the principles of benefit the environment as well as the economic side so to ensure stability and resilience for farmers. By combining these two performances, they aim at ensuring that a sustainable tool is built in the long term.
1.1.11. Content
25% of the direct payment budget should be dedicated to eco-schemes by Member States in their Strategic Plans. However, members of the European Parliament’s COMAGRI have defended the position according to which the aid should cover more than just compensation for the additional costs and loss of income associated with the implementation of such practices and devices (Farm Europe, 2019). In the agreed CAP deal, member states can decide to support annual or multi-annual commitments and premia can be set as ‘compensation’ payments (for the additional costs an income loss stemming from the practices concerned) or as payments going beyond compensation -provided that the relevant Green Box rules of the World Trade Organisations are respected-.
Co-legislators agreed also on the need of a ‘learning period’, going from 2023 to 2024, when an EU country may spend less than 25% in case of a lower take-up by farmers than planned.
Member States, when designing their strategic plans, can choose from a list of practices that will be considered part of their Eco-schemes (practices such as organic farming, agro-ecological practices, precision farming, agro-forestry, carbon farming, etc.). Each member state has to draw up a CAP strategic plan based on their national situation and needs of their territory. These plans -now submitted to the Commission by Member states within their proposition for the National Strategic Plan on the CAP, are under scrutiny[3] . For the Commission, adapting these measures at national or even regional level according to soil types, climates, land use and farm structures would make it possible to better respond to local environmental issues.
1.1.12. Stimulating the transition to certain farming systems
In order to respond to local issues without compromising the unity of Europe, one solution discussed during negotiations was to set the content of the Eco-schemes with broad objectives that can be achieved by different means. It would then be possible to adapt the means to achieve specific objectives to local conditions. Eventually, it was opted for a list of set measures that member states can choose from and that best adapt the national needs and farming system.
The aim would be to promote the transition to farming systems that are environmentally friendly and economically viable in the long term. The practices linked to these systems, once identified, correspond to the list of practices that can be promoted within Eco-schemes.
1.1.13. Monitoring the impact of this plan at farm level
Considering that the approved CAP is intended to be outcome-based (Etats membres de l’UE, 2019) it is necessary to measure the impact of eco-schemes in how effectively they favour the achievement the environmental objectives.
The European Commission has developed 178 indicators and over 900 sub-indicators to assess the performance of the CAP. This large number of indicators is intended to compare the effects of the CAP country by country. As recommended by the Court of Auditors, evaluating the Eco-schemes separately would allow a better measurement of their impact on the economic and environmental performance of farms (Jereb et al., 2017).
1.1.14. The value of precision agriculture in improving the environmental performance of farms
The Commission and co-legislators see knowledge, innovation and digitalisation as key tools to improve the environmental performance of the CAP and the European agricultural sector. Precision farming uses sensors to measure the needs of crops, animals and weather conditions. They make it possible to adjust inputs such as water, nutrients and plant protection products to the measured needs.
In such a system, farms generate data on the quantities of inputs used and the yields obtained. These data can eventually be used to generate indicators that will show the environmental performance of farms with much greater precision. However, in order to do this, the use of such tools must be sufficiently widespread on European farms to cover most of the areas and production carried out. This will only happen if precision farming ensures environmental performance and it brings economic benefit to farmers.
1.4. Issue
The tool of the Eco-scheme has the dual aim of ensuring unity of action and ambition while being flexible enough to respond to local issues, all while stimulating the transition to more sustainable agricultural systems.
In the face of recurrent criticism concerning the lack of quantification of the effects of the CAP, simple policy tools offering solid monitoring of results across Europe are desired, both by actors in the agricultural world and by European decision makers.
The link between agriculture and the environment must be maintained and strengthened, in line with previous CAPs. The new tools available to agriculture claim to ensure economic and environmental results. If this is the case, they would make it possible to achieve this dual economic and environmental performance. If they are more widespread, they could ensure a precise evaluation of the effect of the policies put in place.
In this context, this study has three objectives. The first one aims to qualitatively analyse different farming systems in order to discern which ones can promote an effective transition. The second one is to develop a set of indicators to quantitatively measure the impact of the plan on farms. The last objective evaluates the economic and environmental performance of different farming systems with and without the use of precision agriculture.
2. State of the art
2.1. Definition
2.1.1. Digital and smart agriculture
Digital agriculture integrates information and communication technologies (ICT) in agriculture. Global Positioning Systems (GPS), Geographic Information Systems (GIS), data clouds, Internet of Things (IOT), Radio Frequency Identification (FRID) techniques, data collection and management systems, drones and activators, attached to highly accurate sensors and cameras are technologies used in digital agriculture. For several decades, these digital tools have been used in animal husbandry, field crops, arboriculture, viticulture or market gardening (Zarco-Tejada, Hubbard and Loudjani, 2014; Schrijver, 2016; Souza et al., 2019)
Smart farming is the use of these technologies to collect data and create algorithms to process it. Smart farming provides both better traceability of agricultural products, guaranteeing their value, and a set of tools that farmers can rely on during production (Zarco-Tejada, Hubbard and Loudjani, 2014; Schrijver, 2016). The production tools provided by smart farming are linked either to precision agriculture or to the automation of agriculture.
Thus, digital agriculture could correspond to a set of digital tools that, when used for data collection and processing by smart farming, help with production or ensure product traceability. Figure 1 summarises this vision of digital agriculture.
| Digital agriculture |
| Smart farming |
| Production-related tools |
| Precision agriculture |
| Automation of agriculture |
| Traceability |
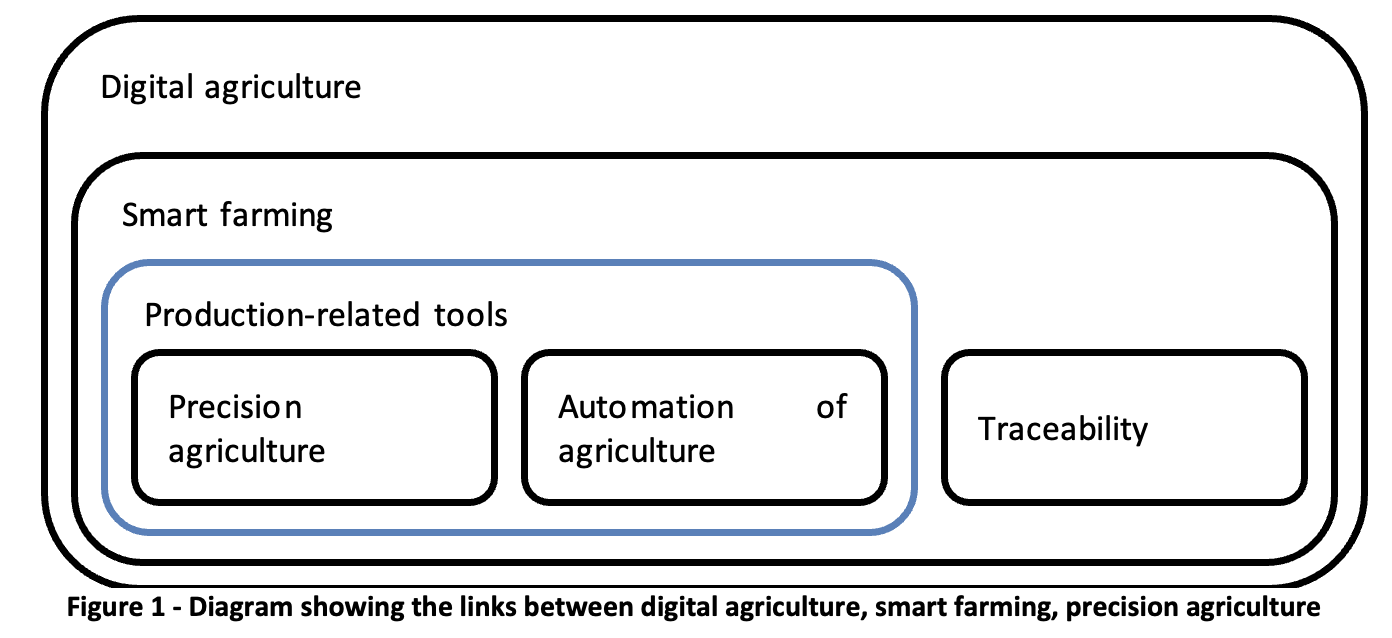
| Figure 1 – Diagram showing the links between digital agriculture, smart farming, precision agriculture |
Regarding agricultural production, digital agriculture is seen as a way to succeed in producing more while protecting nature by optimising inputs (seeds, pesticides, fertilisers, feed and livestock care) and ensuring well-being at work (Zarco-Tejada, Hubbard and Loudjani, 2014). This study focuses on the part of digital farming related to agricultural production.
2.1.2. Automation of agriculture
The emergence of robots, automatic controls and artificial intelligence within agricultural production is leading to the automation of agriculture. This leads to labour optimisation, and more efficient use of certain inputs such as feed rations. The use of pesticides can also be reduced (Zarco-Tejada, Hubbard and Loudjani, 2014; Brown et al., 2018).
Robotic scarecrows limit the nuisance of wildlife on crops. Others provide mechanical weeding or cleaning of stables. Some milking robots equipped with sensors and cameras operate automatically. The presence of cameras ensures the opening of the doors of a farm. Sensors can automatically trigger crop irrigation based on measured data. Ventilation and heating can be adapted to the needs of the animals. Feeding efficiency can be improved by automating the delivery of feed tailored to the animal’s physiological needs. Certain diseases can be detected in advance by sensors, thus enabling the anticipation of care in the farm. The same applies to the spraying of pesticides and fertilisers in crop production. Tractor equipment such as power steering facilitates operations such as sowing, treatment and harvesting (Zarco-Tejada, Hubbard and Loudjani, 2014; Brown et al., 2018).
2.1.3. Precision agriculture
Precision agriculture enables decisions to be made through decision algorithms and decision support tools (DSTs). Some of these relate to agronomic choices. They help with the implementation of rotations, crop associations, sowing and grazing management. Others advise on input management. They propose suitable products with low environmental impact. They target treatment dates and modulate the doses to be sprayed (Zarco-Tejada, Hubbard and Loudjani, 2014). Precision agriculture uses sensors, cameras and satellite images that report on the needs and presence of pathogens and diseases in both livestock and crop production (Zarco-Tejada, Hubbard and Loudjani, 2014; Brown et al., 2018).
2.2. Tools by type of production
2.2.1. Precision breeding
In meat, egg or milk production, the health status of the flock is monitored by collecting information at the individual animal level. The data obtained is used to improve the efficiency of rations and to monitor the behaviour of each animal. Together with data on their environment, this ensures their welfare. The time saved and the simplification of work tasks that this monitoring allows provide comfort to the farmer. As in crop production, environmental benefits are generated. These include the reduction of inputs and energy consumed, waste produced and emissions of polluting gases. The use of precision farming in livestock production is in its infancy. It is often coupled with tools that automate farming tasks. The cost of such devices and the lack of awareness among farmers seem to be the main reasons for their slow development (Zarco-Tejada, Hubbard and Loudjani, 2014; Brown et al., 2018).
2.2.2. Tools related to the management of agricultural areas
Digital farming is more widely used and publicised for agricultural land management than for livestock production, and is mainly developed for crops. In recent years, it has been deployed in market gardening, arboriculture and viticulture. DSTs can also help with the management of pastures and meadows (Zarco-Tejada, Hubbard and Loudjani, 2014; Brown et al., 2018).
Precision agriculture, through DSTs, proposes an adjustment of agricultural practices according to the measured conditions (soils, climatic conditions, type of crop, etc.). It can be coupled with robotic and automated tools (Brown et al., 2018). This combination of agricultural automation and precision agriculture in crop production mainly concerns input management.
Variable input rate application methods and tractor power steering are the two main types of tools that smart farming offers for input management in crop production (Zarco-Tejada, Hubbard and Loudjani, 2014). Variable input application methods adapt the quantities of water, pesticides and fertilisers to the needs of the plants or to infestation thresholds. In combination with power steering, these quantities can be sprayed locally, while without the use of digital technology, they are usually applied uniformly (Zarco-Tejada, Hubbard and Loudjani, 2014). This is called modulation rather than precision. The risk of human error can be reduced by controlling the deviation of the tractor’s trajectory when spraying with the power steering (Brown et al., 2018).
By preserving water resources and limiting the risk of leaching of fertilisers and pesticides, the impact of agriculture on the environment is reduced. The economic performance of farms can also be improved through more efficient use of inputs and possible yield increases (Zarco-Tejada, Hubbard and Loudjani, 2014).
This study therefore focuses on tools related to input management on agricultural land.
2.2.3. The cost of these tools
The cost of different digital tools related to production varies. Some DSTs are free, notably those concerning crop management, choice of cover and varieties (Arvalis, 2019). Others are not free but can offer a rapid return on investment. These are DSTs such as Farmstar®, GAIASENS® or weather stations. Other tools, related to agricultural automation, such as robots or digital tools may require larger financial investments. The degree of precision can be correlated with the amount of tools needed (GPS, cameras, guidance systems, nozzle cut-off systems…) and thus with the investment cost (Brown et al., 2018).
2.3. The different levels of input management tools in crop production
It is possible to classify digital tools into different levels according to their ability to limit the impact of inputs on the environment. Their affordability and the scale at which the adjustment of input quantities is assessed are taken into account. This classification, presented Tableau 1, applies to water, pesticides and fertilisers.
Table 1 – Ranking of tools according to their ability to reduce the environmental impact of inputs
| Level | Objective | Tools needed |
| 1 | Adjustment to the scale of a group of plots with the same crops, soil and climatic conditions and phytosanitary risks | Precision farming tools* |
| 2 | Adjustment at the plot level | Precision farming tools* |
| 3 | Intra-cellular scale adjustment | Precision farming tools* Dose modulation |
| 4 | Intra-plot adjustment and zero detectable residues for fertilisation and pesticides | Precision farming tools* Dose modulation
Robotisation for pesticide management Automation of irrigation |
| 5 | Adjustment at the plant level in the plot and zero detectable residues for fertilisation and pesticides | Precision farming tools* Dose modulation
Robotisation for pesticide management Automation of irrigation |
| *Sensors, weather stations, satellite images, cameras, input management DSTs.
** Power steering and local spraying of pesticides and fertilisers. |
||
2.4. The development of digital agriculture in Europe
2.4.1. General data
Europe is one of the regions of the world where the supply of digital agriculture is growing the most. Since the beginning of the 21st century, between 70% and 80% of agricultural equipment is equipped with components that can be linked to digital tools (Zarco-Tejada, Hubbard and Loudjani, 2014; Say et al., 2018). More than 450 different types of products are marketed by 4500 suppliers. The manufacture, distribution and services associated with these technologies generate more than 160,000 jobs, mainly in the private sector (Zarco-Tejada, Hubbard and Loudjani, 2014).
The adoption of digital farming is taking place on a wide range of agricultural surfaces, and the supply of technologies is constantly increasing. Nevertheless, some consider that the evolution of digital agriculture is lagging behind the development initially envisaged and compared to that observed in other major global agricultural regions (Zarco-Tejada, Hubbard and Loudjani, 2014). A 2016 survey of 287 European farmers shows that 50% of European farmers are in favour of adopting such tools (Kernecker et al., 2019). However, this type of technology is only used on 25% of farms (Say et al., 2018).
2.4.2. Goals sought by farmers
Increased yields, improved working conditions and comfort, and reduced workload are the main decision factors for its adoption by farmers, according to this survey (Kernecker et al., 2019). Reducing input costs, pollution and environmental impact are other interests mentioned in second place (Zarco-Tejada, Hubbard and Loudjani, 2014; Kernecker et al., 2019).
2.4.3. Interest of digital agriculture in European agricultural policies
In parallel to reducing the environmental impact of agriculture, deploying the use of digital tools in Europe would corollary quantify this impact at the farm level. Digital agriculture could make explicit the adequacy of farms with the standards of good practice. It would make it possible to better materialise the role of farmers in the production of public goods, and to better legitimise the public remuneration of this production (Kritikos, 2017).
Deployed on a large scale in Europe, the administrative burden could be simplified, especially in the implementation and enforcement of CAP measures. Data entry for each farm could be simplified, as could control procedures. The latter mainly concerns the identification of agricultural parcels, and their monitoring over time (Kritikos, 2017). Digital agriculture could also provide precise data that could be used for indicators to evaluate the policies implemented, as well as statistical data.
The advent of digital agriculture in Europe cannot take place without the support of the European Union. In view of the economic and environmental performance promoted by these tools, digital agriculture must be put forward in the future CAP. But to do so, it is essential to better understand the current and future potential of these tools. The challenges linked to their adoption and use need to be identified and the real economic and environmental benefits obtained by farmers need to be measured (Panagos et al., 2019).
2.4.4. Sustainability of European digital agriculture on a global scale
While digital farming is of economic and environmental interest at the European level, the sustainability of the solutions offered by such farming method can only be assessed at the global level. The environmental, economic and social impacts related to the extraction and processing of certain sensor components, such as rare earths, must be taken into consideration at the international level. These impacts include the high water and energy consumption of the mines, water shortages for the surrounding villages, and soil and crop pollution. Social considerations related to living and working conditions are also put forward.
The life cycle analysis of the solutions proposed by digital agriculture could make it possible to measure the environmental impact of these tools, from the extraction of the raw materials to their end of life. The social impact of these solutions outside Europe needs to be analysed and alternatives to be found.
2.5. Factors hindering the development of digital agriculture
2.5.1. Farmers’ barriers to adopt these technologies
2.5.1.1. The cost
The cost of the tools is only one part of the total expenses farmers have to make when they want to invest in digital tools. In addition to the cost of the software and hardware, the cost of information on these techniques and training has to be considered as well (Zarco-Tejada, Hubbard and Loudjani, 2014; Kernecker et al., 2019). There may also be expenses related to data processing. Investment in these technologies may be limited by some farmers’ access to credit (Kritikos, 2017).
Added to this is the fear of investing in the long term in tools that may quickly become obsolete due to the speed of technological progress.
2.5.1.2. Debated profitability
Return on investment and profitability are key criteria for the adoption of digital tools. The results of different studies contradict each other on the profitability of digital farming. Some claim that there are benefits, and others show that there are no statistically significant economic benefits over a 10-year period (Zarco-Tejada, Hubbard and Loudjani, 2014).
Some studies conclude that digital farming is only profitable for areas larger than 250 ha (Zarco-Tejada, Hubbard and Loudjani, 2014). This finding is supported by the 2016 survey showing that larger farms are more likely to adopt such technologies (Kernecker et al., 2019). However, it only concerns farms that pay for the investment on their own. Examples of organisations and groups of small farms show that it is possible to invest and make a profit from such tools collectively. This is the case of GAIA, for example, where the size of the plots where precision farming tools are used varies between 0.51 hectares and 37.23 hectares. In other words, the lack of visibility of the added value of digital agriculture works against its adoption (Kernecker et al., 2019).
2.5.2. The complexity of technologies
The time needed to format and enter data into software is another barrier for farmers hoping to save time in production. This data management step can be a barrier to the adoption of such technologies (Zarco-Tejada, Hubbard and Loudjani, 2014). The 2016 survey by Kernecker et al. (2019) shows that farmers who do not use these tools feel that they are too complicated to use. Farmers who are ready to adopt these technologies fear that they will have difficulties interpreting the data (Kernecker et al., 2019).
2.5.3. Lack of infrastructure
Digital agriculture generates large amounts of data. Its proper functioning depends on the presence of high-speed infrastructure (Zarco-Tejada, Hubbard and Loudjani, 2014; Kritikos, 2017). However, broadband coverage (30mbps) is covered in less than 50% of the European rural areas. This is particularly the case for 14 Member States (Ivanova et al., 2018).
2.5.4. Standards issue
Tools from different vendors are not always compatible, preventing data sharing between different systems. The creation of standards, both in terms of interfaces and data codes, would allow interoperability between the different tools, thus facilitating their accessibility to farmers (Zarco-Tejada, Hubbard and Loudjani, 2014; Kritikos, 2017; Kernecker et al., 2019).
2.5.5. Knowledge and expertise issues
There is a lot of research work related to digital agriculture. The lack of communication and knowledge transfer between researchers, institutes, cooperatives and farmers is one of the causes of the slow development of digital agriculture in Europe (Zarco-Tejada, Hubbard and Loudjani, 2014; Kritikos, 2017; Kernecker et al., 2019).
This transfer of knowledge could take place in the form of training, enabling farmers to learn the skills needed to use these techniques (Schrijver, 2016). Demonstrations and demonstration plots are other ways of introducing these tools to agricultural stakeholders.
Farmers also state the need for expertise and unbiased advice, from entities independent of the manufacturers of digital farming tools (Kernecker et al., 2019).
2.5.6. Challenges in managing data from digital agriculture
New players are entering the agricultural sector. These companies from agribusiness, finance, chemicals or even distributors and agri-food industries focus mainly on data collection, analysis and management. The coded data is not primarily aimed at the farmers who produce it or at farmers’ organisations, but rather at those companies that base their work on it. This raises questions about data ownership, confidentiality, protection and use (Zampti, 2019).
Protecting farmers’ rights to data from their farms against the risk of abuse of data management and use is paramount (Kritikos, 2017; Paraforos et al., 2019). To this end, charters, certifications and codes of conduct are set up by different agricultural unions and cooperatives at national or European level (COGECA, 2018; data agri, 2018). European policies have an important role to play in order to protect the centrality of farmers in the production and management of these data (Kritikos, 2017).
2.6. Role of the European Union in relation to these challenges
Data management should take place at European level, following on from what the private sector has already put in place (Zarco-Tejada, Hubbard and Loudjani, 2014). A European legislative framework dealing with data ownership, confidentiality and protection needs to be organised. Issues of liability, human security, technical controls must also be addressed (Kritikos, 2017). To enable the development of digital agriculture, the identified obstacles related to the lack of infrastructure, standards and knowledge transfer must be addressed.
In this context, the European Union should define a framework for data sharing between the actors of the agri-food chain and strengthen the place of farmers in the production chain. It should be able to inform farmers about the costs, benefits and economic returns of digital agriculture. Training and courses to learn how to use these technologies could be supported under the CAP (Kritikos, 2017).
Given the diversity in farm size, farm type, farming practices, farmer training and yields, the opportunities and concerns of digital farming may vary from state to state. Agricultural policies must take this differences into account (Schrijver, 2016).
2.7. The challenge of a quantitative analysis of the performance of these tools
Digital farming is being promoted as a way of using inputs more effectively. However, data on digital farming is scattered and held by manufacturers and traders who are not necessarily inclined to share it.
Farmers’ fears about the cost and lack of return on investment of these technologies may be correlated with the lack of quantification of the benefits of such way of farming. The tools offered by digital agriculture span a wide range of cost and precision, as illustrated by Table 1. The tools related to precision agriculture correspond to the first level, and they are, usually, relatively cheap. If they meet the economic and sustainability objectives of digital agriculture, their development could be supported on a European scale.
Finally, it should be noted that an estimate of the profitability and benefits of digital tools in agricultural production must be made in relation to reference systems without the use of such tools
3. Methodology
3.1. Data collection
3.1.1. Data providers
To assess the economic and environmental performance of DSTs on the amounts of fertiliser, pesticides and water applied, data were collected from distributors offering various DSTs.
Farmstar is a tool designed by Airbus Defence and Space and two French technical institutes, Arvalis – Institut du végétal – and Terre Inovia. This combination of agronomy and remote sensing provides information on the condition of crops, their stand, their nutrient status and on disease risks. The precision of this tool, down to the intra-plot level, makes it possible to modulate the application of inputs according to needs. Farmstar is marketed to service distributors, mainly cooperatives and chambers of agriculture, which then offer it to farmers.
Terrena is a French agricultural cooperative located in Pays de Loire, Poitou-Charentes and Brittany. The cooperative offers its members in the cereal sector the possibility of using Farmstar coupled with monitoring by an advisor. This nitrogen management service is called FertiloSat. For pesticide management, it is called Fongipro.
GAIA EPICHEIREIN was created in 2014 from a broad coalition of farmers and agricultural cooperatives (71 agricultural cooperatives and associations, 150,000 farmers) working throughout Greece in all sectors of plant and animal production. These agricultural actors have joined forces with partners from the banking and IT sectors sharing a common vision for a more sustainable and competitive Greek agricultural model. GAIA EPICHEIREIN is the entity that coordinates the cooperation and marketing networks of the GAIASENSE smart farming system developed and operated by NEUROPUBLIC SA.
The BTI, the Beet Technical Institute, offers an interactive map informing on the global fungal risk and on the number of treatments carried out concerning cercosporiosis, powdery mildew, rust and ramularia. This DST is fed from weekly data produced by the BTI, from the technical services of the sugar factories and from the observers of the biological monitoring network of the territory.
3.1.2. Crops concerned
Data on almonds, beetroot, soft and durum wheat, rape, cotton, beans, kiwifruit, lettuce, maize, olives, barley, peaches, pistachios, chickpeas, potatoes, grapes, stevia and tomatoes were collected.
Table 2 summarises the crops studied according to the type of input.
Table 2 – Crops studied by type of input
| Culture | Type of input | ||
| Water | Pesticides | Fertilizer | |
| Almonds | x | x | x |
| Beets | x | ||
| Wheat (soft and/or hard) | x | x | |
| Rape | x | ||
| Cotton | x | x | x |
| Beans | x | ||
| Kiwis | x | ||
| Lettuce | x | ||
| Maize | x | ||
| Olives | x | x | x |
| Barley | x | x | |
| Peaches | x | x | x |
| Pistachios | x | x | |
| Chickpeas | x | ||
| Potatoes | x | x | x |
| Grapes | x | x | x |
| Stevia | x | ||
| Tomatoes | x | x | |
3.1.3. Type of data collected
For each input, the data requested, for plots monitored by DSTs and for plots not monitored by DSTs are:
- The quantities of input used
- In m3 .ha-1 for water
- In U.ha-1 for fertilisers
- In kg.ha-1 for pesticides
- The cost of this use, in €.ha-1
- The yields obtained, in q.ha-1 .
The plots of land that are not monitored by DSTs are the control ones. The input quantities of the plots monitored by digital tool correspond to the quantities recommended by them. This study is based on the assumption that the quantities recommended by the DSTs are applied.
In order to know the sample size, the number of land plots from which the data are agglomerated is indicated for the modalities with/without DST. The number of years over which the data was gather is detailed. Although it is necessary to have more than 3 years of data, in order to smooth out the variability linked to climatic conditions and the presence of pests, data are only available over two years for some inputs and some crops. The cost of the DST is also reported because it is taken into account in the calculations of the difference in costs and the gross margin linked to the use of the tool.
3.1.4. Cost of DST by input
Depending on the provider, DSTs can be free of charge or have a price tag ranging from €3 to €20 per hectare. Some tools offer a range of costs that adjust according to the additional services provided, such as additional advice. Other DSTs have a price that is adapted to the type of crop, the area and number of plots covered by its services and, of course, the number of producers sharing the tool.
For each input, the highest price offered by the DST provider is used for the cost and gross margin calculations.
3.2. Data processing
The data collected is then aggregated by crop type. Each crop has its own nitrogen, potassium, magnesium and water requirements. Their susceptibility to certain diseases varies according to their type and the order of magnitude of yields can vary greatly from one crop to another.
As the aim is to evaluate the performance of these DSTs on a European scale, no comparison between different locations is made.
3.3. Results calculated from the data
3.3.1. Results to be calculated for a complete analysis
In order to have a complete evaluation of the economic and environmental performance of DSTs on input management, a set of elements to be analysed has been identified. These elements are, for each crop and each type of input:
- The difference between the average amounts of inputs that are applied per hectare with or without DST, in m3. ha-1 for water, in U.ha-1 for fertilisers, in kg.ha-1 for pesticides, as shown in Equation 1.
Equation 1 – Calculation of the difference between the average quantities of inputs applied per hectare with and without DST
- The percentage of input saved on average per hectare through the use of DSTs.
- The difference in average costs per hectare induced by the difference between the quantities of inputs that are applied with and without DST, in €.ha-1 , as shown in Equation 2.
Equation 2 – Calculation of the average load difference per hectare
- The average percentage of savings per hectare achieved through the use of DSTs.
- The difference in average yield with and without DST, in q.ha-1 , as shown in Equation 3.
Equation 3 – Calculation of the difference in average yield with and without ADO
- The difference in gross product from the yield obtained with or without DST, in €.ha-1 , as shown in Equation 4.
Equation 4 – Calculation of the difference in gross product from
- The difference in gross margin between plots with DST and plots without DST in €.ha-1 , as shown in Equation 5.
Equation 5 – Calculation of the gross margin difference
The gross margin here is the difference between the gross product and the expenses. For plots with DST, their cost is added to the expenses, as shown in Equation 6.
Equation 6 – Calculation of the gross margin obtained with DST
3.3.2. Results based on available data
The type of data obtained varies according to the type of input and the crop. For each input, the available data are detailed, as well as the results they allow to be calculated.
3.3.2.1. Results obtained for DSTs related to irrigation management
Data on the average cost of irrigation and the average amount of water consumed with and without DST are available. From these data it can be calculated:
- The difference in the average amount of water consumed
- The percentage of water saved on average
- The difference in average irrigation costs per hectare
- The average percentage of financial savings that DSTs provide.
No information on the difference in yield with and without DST is available. The difference in gross product, gross margin and irrigation efficiency could not be calculated.
3.3.2.2. Results obtained for DSTs related to pesticide management
Data on the average cost of pesticide use and the average amounts of pesticides used with and without DST are available for almonds, beetroot, cotton, beans, kiwifruit, olives, peaches, pistachios, chickpeas, potatoes, grapes, stevia, and tomatoes. From these crops, data can be calculated:
- The difference in the average amount of pesticides applied
- The average percentage of pesticide savings
- The difference in average costs related to pesticide management
- The average percentage of financial savings that DSTs provide.
No information on average yields with or without DST is available for these crops. Therefore, gross revenues and gross margins cannot be calculated.
Average differences in costs and yields, as well as average percentages of financial savings are given for durum wheat, common wheat and barley. From these data, it can be calculated:
- The difference in average costs related to pesticide management
- The average percentage of financial savings that DSTs provide
- The difference in average gross product
- The difference in average gross margins.
For these crops, the calculation of efficiency is not possible because no information on the quantities of pesticides applied is provided.
3.3.2.3. Results obtained for DSTs related to fertilisation management
Data on the average cost of fertilisation with and without DST are available for all crops. From these data, it can be calculated:
- The difference in average fertilisation costs
- The average percentage of financial savings achieved by DSTs.
The average amounts of nitrogen, phosphorus and potassium applied with and without DST are given for almonds, cotton, lettuce, olives, peaches, potatoes, grapes and tomatoes. Only the average amounts of nitrogen applied with and without DST are available for wheat, oilseed rape and barley. From these data, it can be calculated:
- The difference in the average amount of nutrients applied
- The average percentage of nutrient savings for each crop.
The average yields obtained with and without DSTs are given for wheat, barley and oilseed rape. From these data, it can be calculated:
- The difference in average gross product
- The difference in average gross margin.
4. Evaluation of economic and environmental performance
4.1. Irrigation management
The performance of a DST related to irrigation management was measured for almonds, cotton, olives, peaches, pistachios, potatoes and grapes. The economic performance for each crop is analysed based on the difference in irrigation costs with and without DST. These costs include the maximum cost of the DST, which is €20. The environmental performance is evaluated from the difference in the amount of water consumed with or without the use of a DST.
A reduction in the average volume of water consumed when using DSTs can be seen in the Figure 2. A reduction in the average volume of water consumed when using DSTs is noted. Table 3 details the percentages of water saved on average per crop.
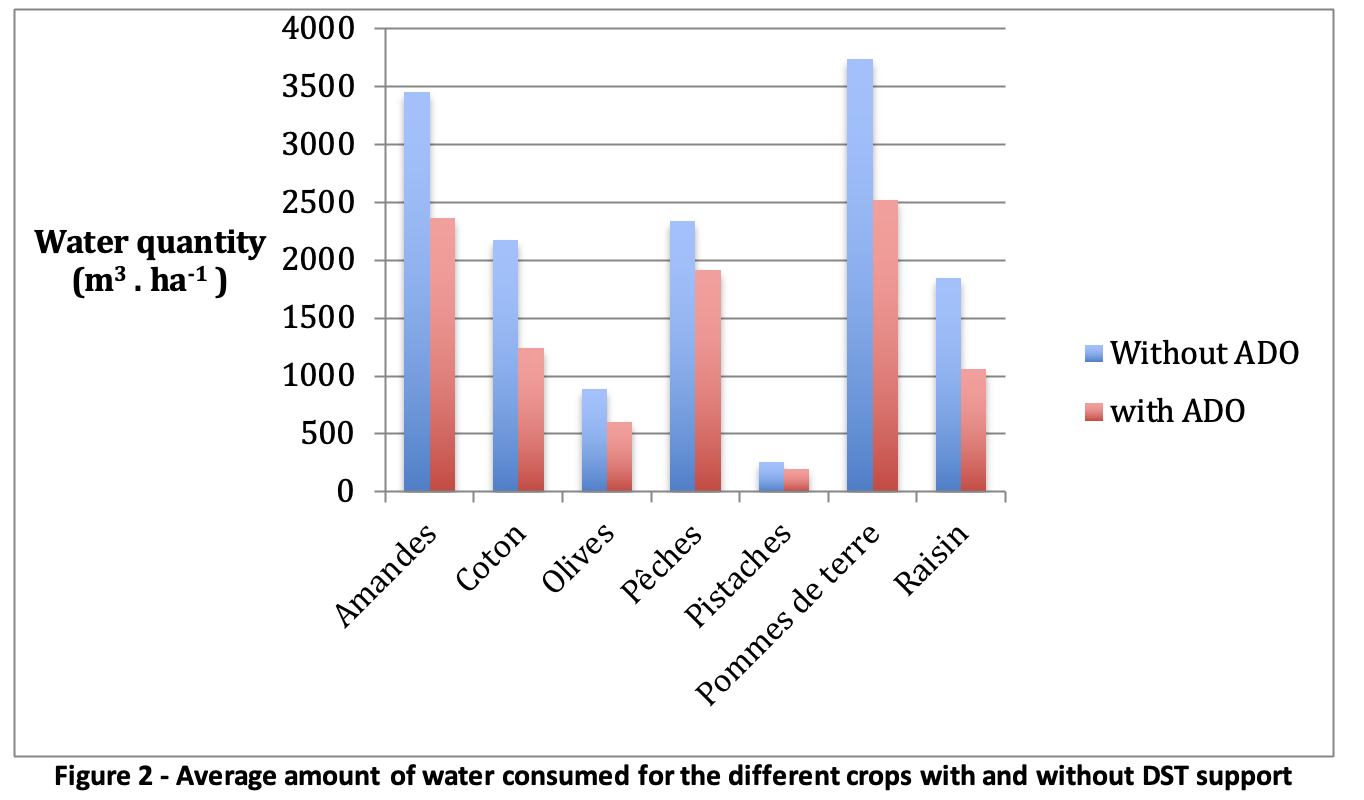
| Figure 2 – Average amount of water consumed for the different crops with and without DST support |
Table 3 – Average percentage of water saved per crop
| Almonds | Cotton | Olives | Peaches | Pistachios | Potatoes | Grapes | |
| Percentage of water saved by using a DST | 31,70 % | 42,97% | 32,50% | 18,54% | 24,61% | 32,56% | 42,71% |
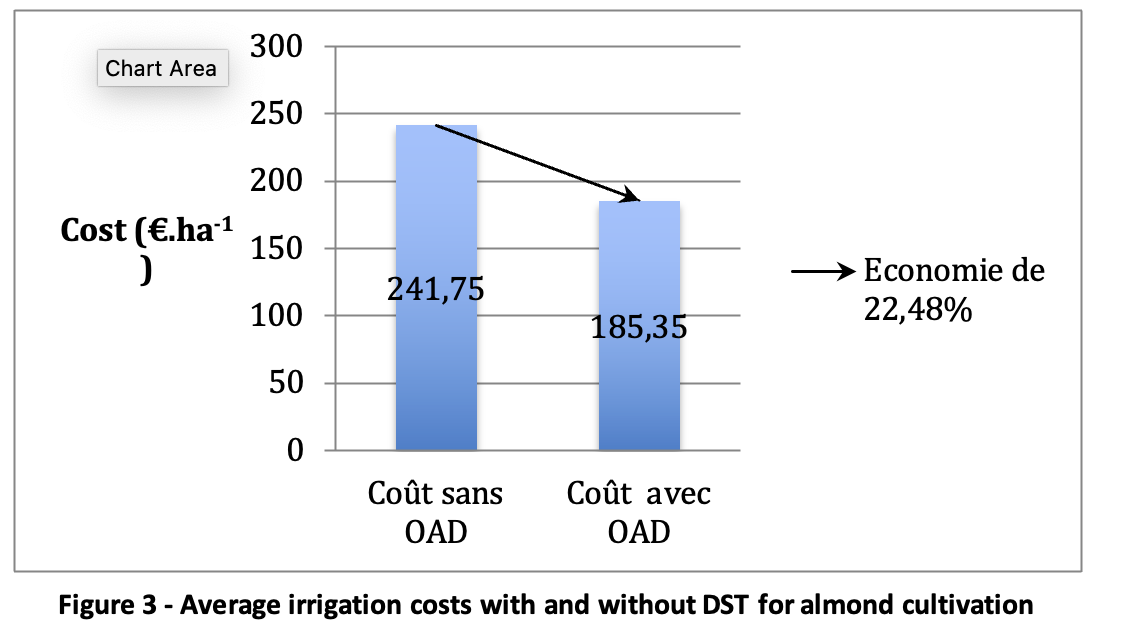
4.1.1. Almond cultivation
A DST related to irrigation management for almond cultivation was evaluated in 2017 and 2018. The use of this DST allows for an average reduction of 22.48% in irrigation-related expenses, i.e. an average saving of €56.40 per hectare, as shown in Figure 3.
| Figure 3 – Average irrigation costs with and without DST for almond cultivation
|
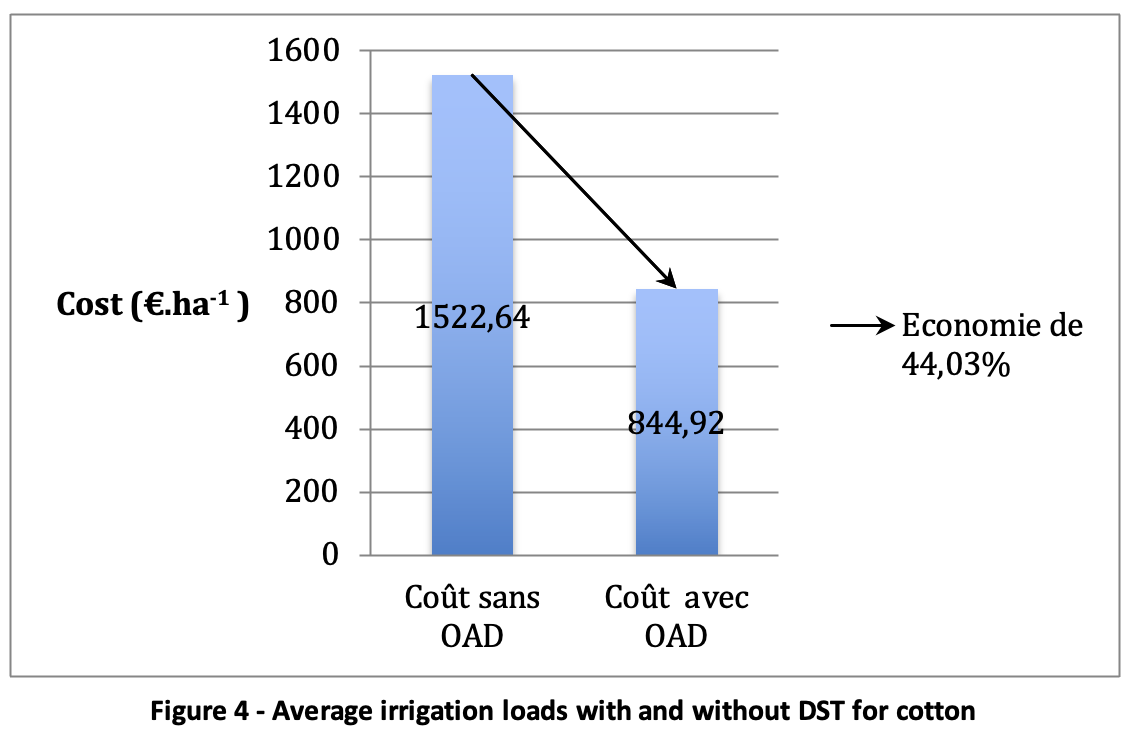
4.1.2. Cotton growing
The use of a DST was evaluated in 16 cotton land plots in 2017 and 2018. This specific DST allows for an average reduction of 44.03% in irrigation-related costs, i.e. an average saving of €697.72 per hectare, as shown in Figure 4.
| Figure 4 – Average irrigation loads with and without DST for cotton
|
4.1.3. Olive growing
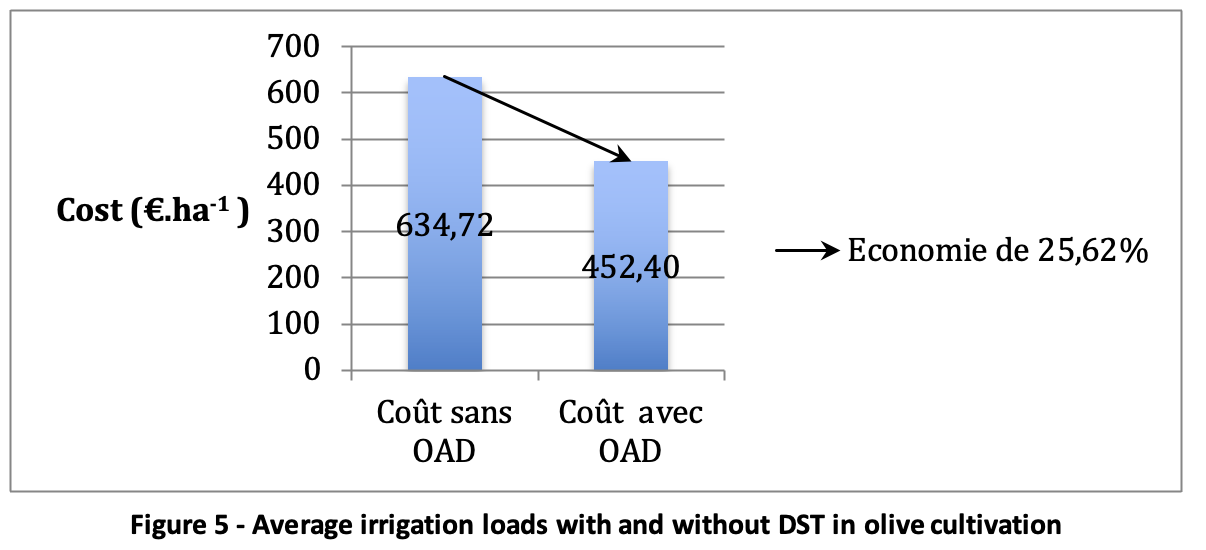
Ten olive plots were evaluated with and without DST during 2017 and 2018. The use of this DST allows to reduce, on average, 25.62% of the expenses related to irrigation, i.e., to achieve a saving of 182.32€ per hectare. Findings are shown in Figure 5.
| Figure 5 – Average irrigation loads with and without DST in olive cultivation
|
4.1.4. Peach growing
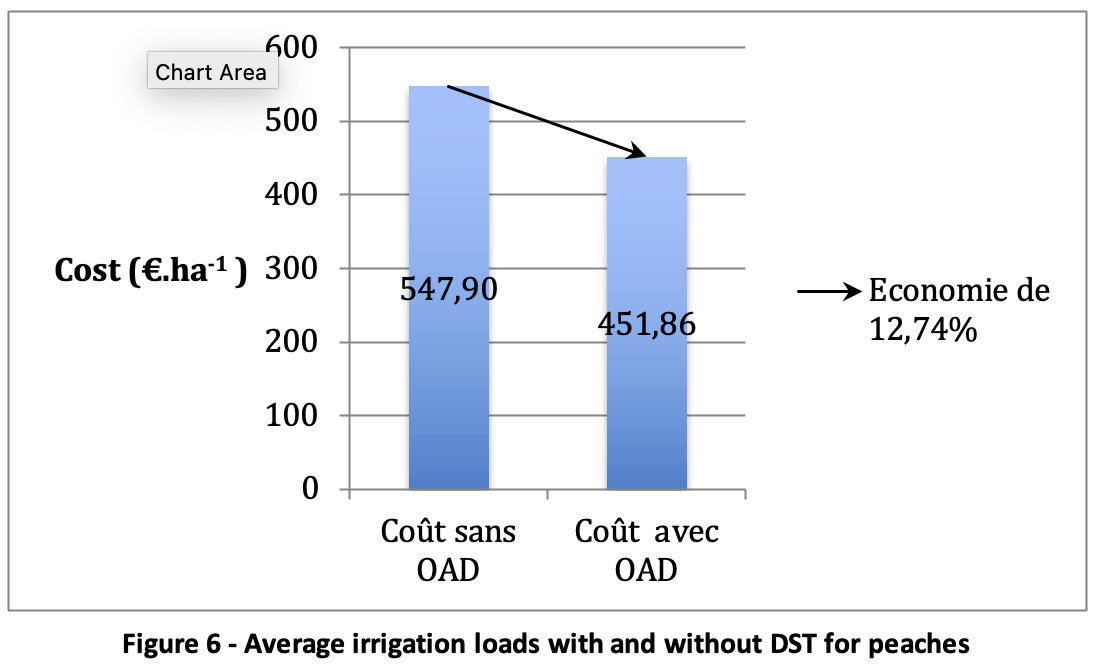
The use of a DST was evaluated in 26 peach orchards in 2017 and 2018. This DST allows for an average reduction of 12.74% in irrigation costs, i.e., an average saving of €96.04 per hectare, as shown in Figure 6.
| Figure 6 – Average irrigation loads with and without DST for peaches
|
4.1.5. Pistachio cultivation
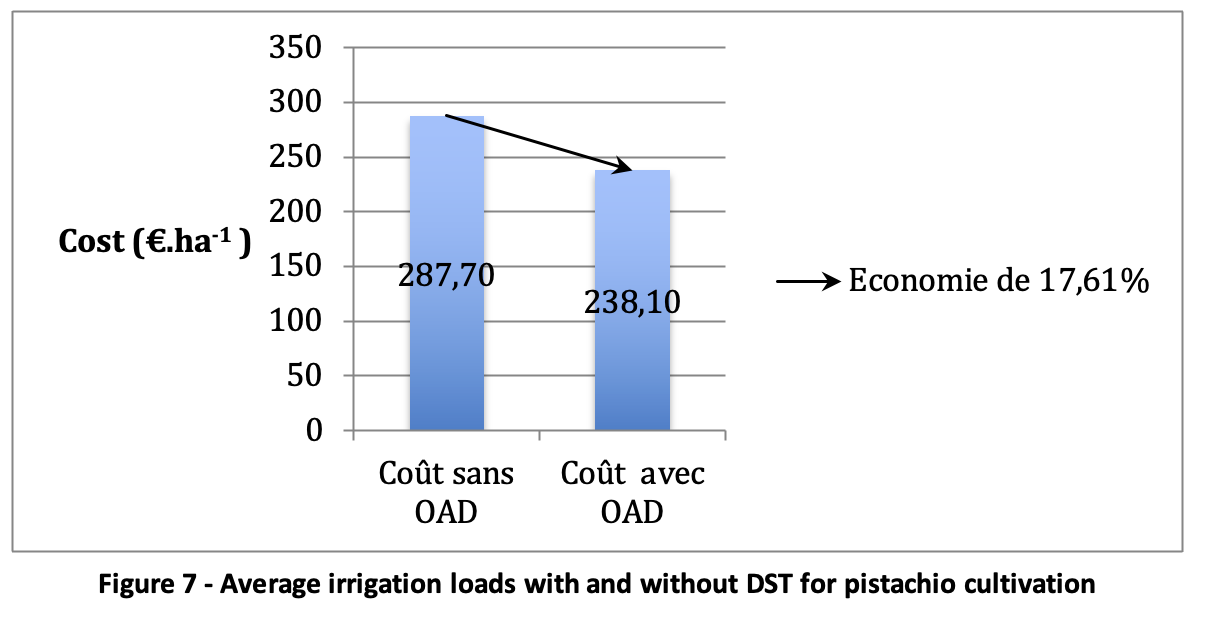
The use of a DST was evaluated in 4 pistachio plots in 2017 and 2018. This DST allows for an average reduction of 17.61% in irrigation-related expenses, i.e., a saving of €49.60 per hectare on average, as shown in Figure 7.
| Figure 7 – Average irrigation loads with and without DST for pistachio cultivation
|
4.1.6. Potato cultivation
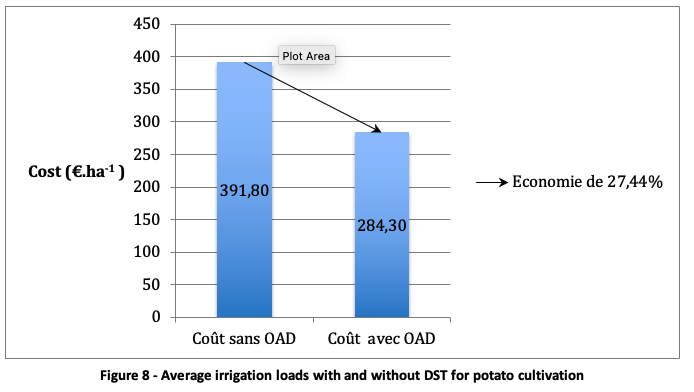
The use of a DST was evaluated in 5 potato plots in Mediterranean areas in 2017 and 2018. This DST allows for an average reduction of 27.44% in irrigation costs, i.e., an average saving of 107.50€ per hectare, as shown in Figure 8.
| Figure 8 – Average irrigation loads with and without DST for potato cultivation
|
4.1.7. Grape growing
The use of a DST was evaluated in 12 vineyard plots in Mediterranean regions (Greece) in 2017 and 2018. This DST allows for an average reduction of 41.97% in irrigation-related expenses, i.e. a saving of €1155.34 per hectare on average, as shown in Figure 9.
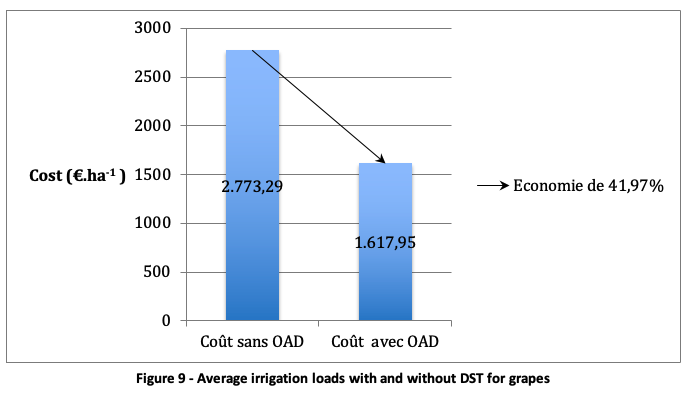
| Figure 9 – Average irrigation loads with and without DST for grapes
|
4.1.8. Maize crop
Since 2019, a DST has been implemented for maize management. According to the experimental data, this DST allows to save 40€ per hectare on average.
4.1.9. Performance review of DSTs related to irrigation management
The DSTs linked to irrigation management make it possible to reduce the average volume of water consumed for all the analysed crops. Similarly, for all the crops studied, the amounts saved are higher than the maximum cost of the DSTs, thus ensuring a return on investment.
In order to have a better analysis of the performance of DSTs concerning irrigation management, it would be interesting to complete these gains linked to the reduction of production costs with the gains in gross product. It would then be possible to evaluate the difference in gross margin obtained with or without DST. Such elements are also useful in order to remove the common fear of producers that less irrigation could lead to a decrease in yield, even though more finely managed irrigation could, on the contrary, lead to an increase.
4.2. Pesticide management
The environmental performance of DSTs related to pesticide management is assessed from the difference in the quantity of pesticides applied with or without a DST. When this data is not available, this evaluation is based on the difference in costs related to pesticide management. The cost of the tool is included in these costs. The economic performance is also evaluated from the difference in expenses related to pesticide management as well as from the differences in gross products and gross margins, depending on the data available.
4.2.1. Almond cultivation
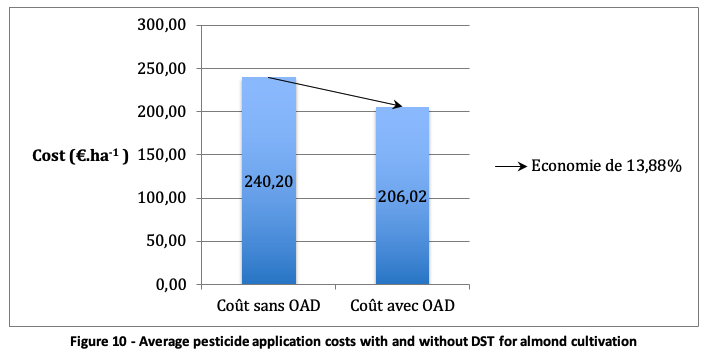
The use of a DST was evaluated in six almond plots in 2017 and 2018. This DST reduces pesticide management costs by an average of 13.88%, resulting in an average saving of €34.18 per hectare, as shown in Figure 10.
| Figure 10 – Average pesticide application costs with and without DST for almond cultivation
|
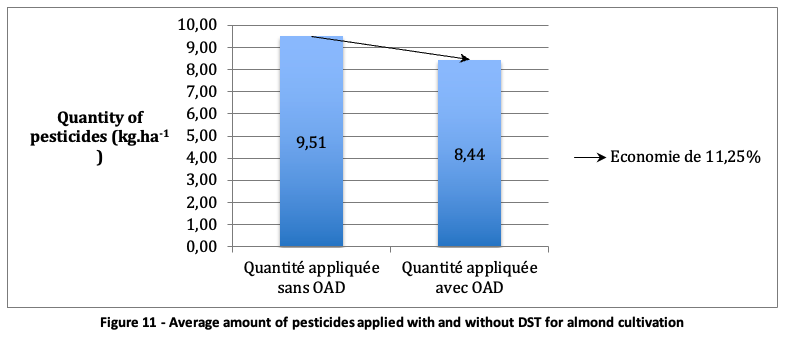
The use of DSTs reduces the amount of pesticides applied by 11.25% on average compared to not using DSTs, saving 1.07 kg of pesticides per hectare, as shown in Figure 11.
| Figure 11 – Average amount of pesticides applied with and without DST for almond cultivation
|
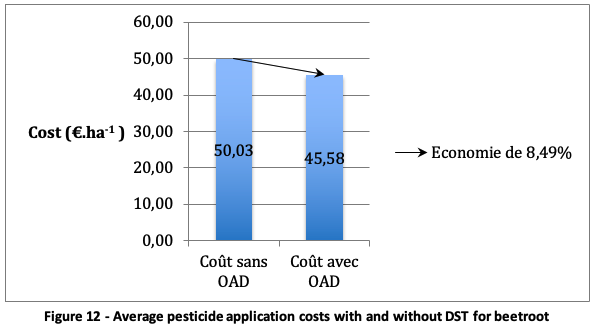
4.2.2. Beet growing
The use of a DST was evaluated in 300 plots of beet cultivation between 2006 and 2015. This DST allows for an average reduction of 8.49% in pesticide management costs, i.e., an average saving of €4.44 per hectare, as shown in Figure 12.
| Figure 12 – Average pesticide application costs with and without DST for beetroot
|
4.2.3. Wheat crop
The use of DSTs was evaluated for wheat cultivation between 2007 and 2018. On average, these DSTs increase the yield by an additional 2 quintals, increasing the gross product by €15 per hectare and the gross margin by €21 per hectare on average, as shown in Table 4. The cost of the tool is taken into account in the gross product and gross margin for wheat and in the expenses and gross margin for durum wheat and soft wheat.
Table 4 – Economic performance of DSTs related to pesticide management in wheat
| Wheat | Durum wheat | Soft wheat | |
| Investment in pesticides saved through the use of DST (€/ha) | 10,92 | 7,01 | |
| Percentage of costs saved through the use of DST (%) | 26 | 16,67 | |
| Additional production (q/ha) | 2 | 0,2 | 4,7 |
| Difference in gross product (€/ha) | 15* | 3 | 65,8 |
| Difference in gross margin (€/ha) | 21* | 1,92* | 60,01* |
| * the cost of the tool is included in the gross margin | |||
4.2.3.1. Durum wheat
The use of DSTs was evaluated in 457 durum wheat plots between 2007 and 2018. These DSTs reduce pesticide management costs by an average of 26%, or €10.92 per hectare on average. An additional production of 0.2 quintals per hectare takes place on average, increasing the gross product by €3 per hectare and the gross margin by €1.92 per hectare on average, as illustrated in Table 4.
4.2.4. Soft wheat
The use of DSTs was evaluated on 2912 soft wheat plots between 2007 and 2018. These DSTs reduce pesticide management costs by an average of 16.67%, or €7.01 per hectare on average. An additional production of 4.7 quintals per hectare takes place on average, increasing the gross product by €65.80 per hectare and the gross margin by €60.01 per hectare on average, as illustrated in Table 4.
4.2.5. Cotton growing
The use of a DST was evaluated in 14 cotton plots in 2017 and 2018. This DST allows for an average reduction of 31.81% in pesticide management costs, i.e., an average saving of €97.27 per hectare, as shown in Figure 13.
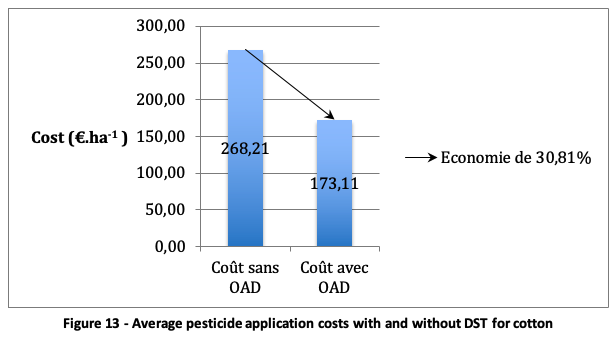
| Figure 13 – Average pesticide application costs with and without DST for cotton
|
The use of DSTs reduces the amount of pesticides applied by 50.61% on average compared to not using DSTs, saving 2.07 kg of pesticides per hectare, as shown in Figure 14.
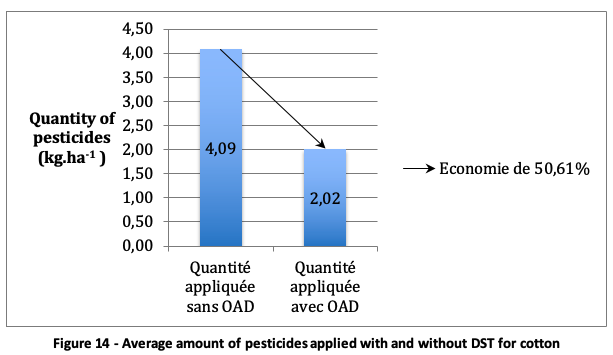
| Figure 14 – Average amount of pesticides applied with and without DST for cotton
|
4.2.6. Bean cultivation
The use of an DST was evaluated in five bean plots in 2017. This DST recommends a lower number of pesticides, compared to a standard application without a DST. Without adding the cost of the tool to the expenses related to pesticide management, a margin of 2€ per hectare is observed on average. The cost of the DST used to calculate the average costs of pesticide application is €20 per hectare. This is the highest cost of the DSTs studied. Pesticide management by a DST increases the costs related to pesticide management by 37.88% on average, i.e., by €17.88 per hectare, as shown in Figure 15.
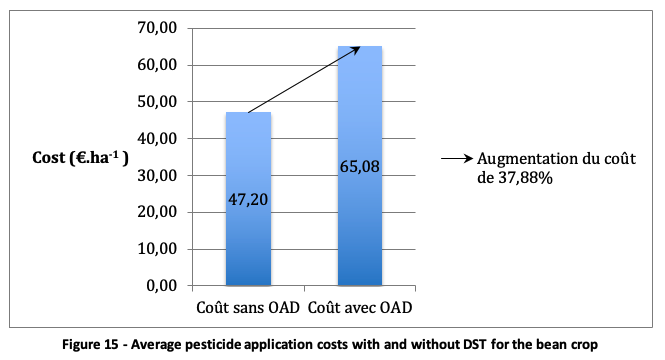
4.2.7.
| Figure 15 – Average pesticide application costs with and without DST for the bean crop
|
Cultivation of kiwifruit
The use of an DST was evaluated in two kiwifruit plots in 2018. This DST recommends the same amount of pesticides as a standard application without DST. Thus, the cost of the tool increases the expenses related to pesticide management with DST compared to the expenses related to standard pesticide management.
4.2.8. Olive growing
The use of a DMO was evaluated in ten olive plots in 2018. This DMO allows for an average reduction of 64.46% in pesticide management costs, i.e., an average saving of €212.62 per hectare, as shown in Figure 16.
| Figure 16 – Average costs related to the application of pesticides with or without ADO in olive growing |
The use of DSTs reduces the amount of pesticides applied by 37.66% on average compared to not using DSTs, saving 4.77 kg of pesticides per hectare, as shown in Figure 17.
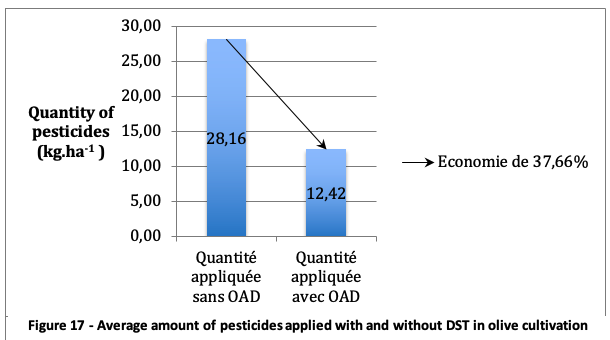
| Figure 17 – Average amount of pesticides applied with and without DST in olive cultivation
|
4.2.9. Barley cultivation
The use of DSTs was evaluated in 694 barley plots between 2007 and 2018. These DSTs reduce pesticide management costs by an average of 32.5%, or €1.44 per hectare on average. An additional production of 1.3 quintals per hectare takes place on average, increasing the gross product by €19.5 per hectare on average and the gross margin by €8.94 per hectare on average.
4.2.10. Peach growing
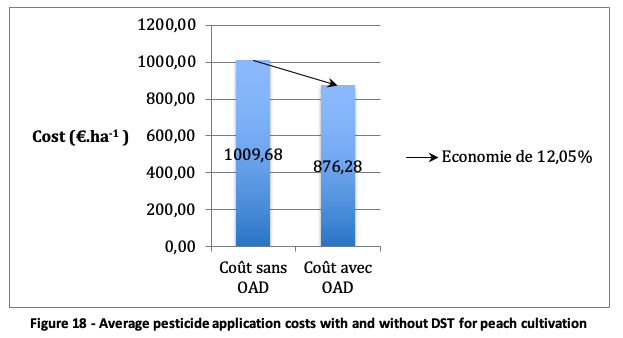
| Figure 18 – Average pesticide application costs with and without DST for peach cultivation
|
The use of a DST was evaluated in 28 peach plots in 2017 and 2018. This DST allows for an average reduction of 12.05% in pesticide management costs, i.e., an average saving of €133.40 per hectare, as shown in the Figure 18.
The use of DSTs reduces the amount of pesticides applied by 12.44% on average compared to not using DSTs, saving 2.95 kg of pesticides per hectare, as shown in Figure 19.
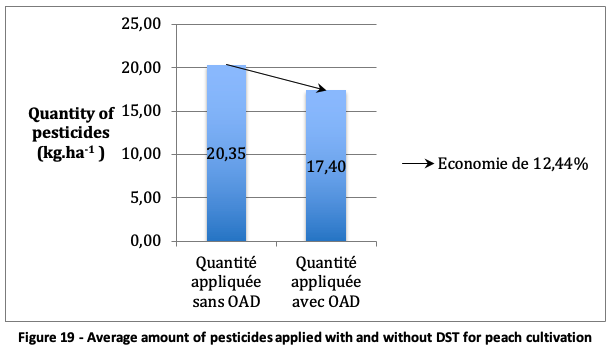
| Figure 19 – Average amount of pesticides applied with and without DST for peach cultivation
|
4.2.11. Pistachio cultivation
The use of a DST was evaluated in four pistachio plots in 2017 and 2018. This DST allows to reduce on average by 36.46% the expenses related to pesticide management, i.e., to save 29€ per hectare on average, as shown in the Figure 20.
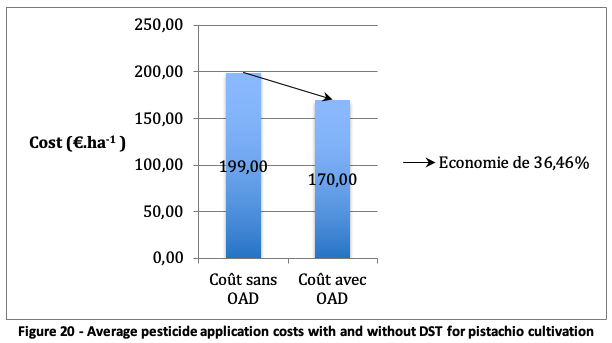
| Figure 20 – Average pesticide application costs with and without DST for pistachio cultivation
|
4.2.12. Chickpea cultivation
The use of a DST was evaluated in two chickpea plots in 2018. This DST allows for an average reduction of 58.97% in pesticide management costs, i.e., an average saving of €28.75 per hectare, as shown in Figure 21.
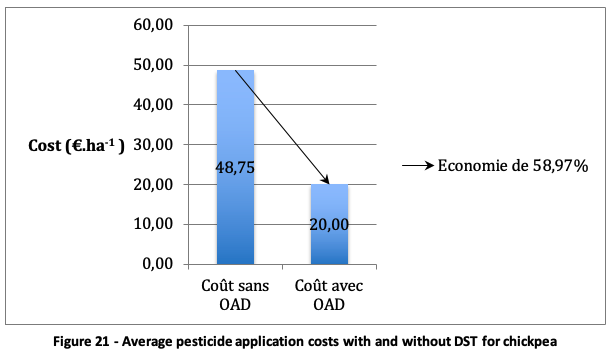
| Figure 21 – Average pesticide application costs with and without DST for chickpea
|
4.2.13. Potato cultivation
The use of a DST was evaluated in five potato plots in 2017 and 2018. This DST reduces pesticide management costs by an average of 6.47%, resulting in an average saving of €35.52 per hectare, as shown in Figure 22. However, the amount of pesticides recommended is on average the same as that applied without the use of a DST.
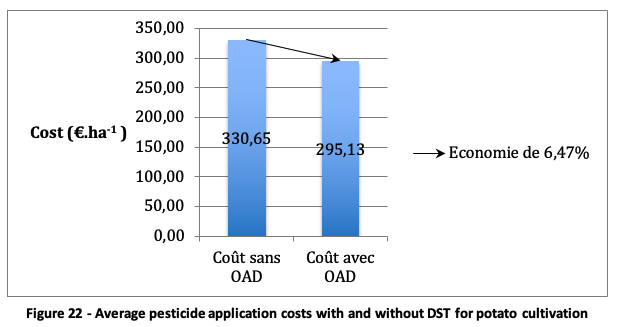
| Figure 22 – Average pesticide application costs with and without DST for potato cultivation
|
4.2.14. Grape growing
| Figure 23 – Average pesticide application costs with and without DST for grapes
|
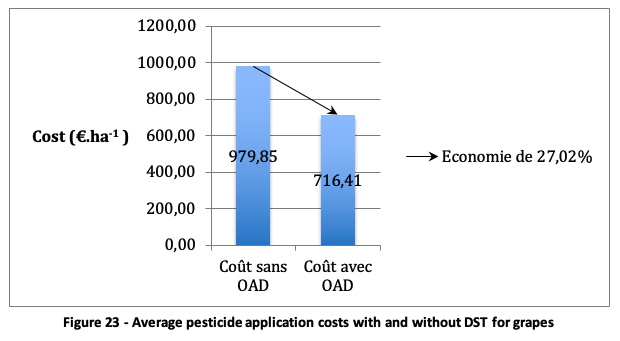
The use of an DST was evaluated in 12 grape plots in 2017 and 2018. This DST reduces pesticide management costs by an average of 27.02%, resulting in an average saving of €263.44 per hectare, as shown in Figure 23.
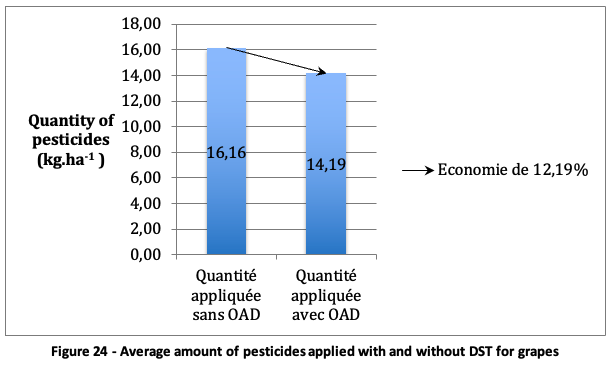
The use of DSTs reduces the amount of pesticides applied by 12.19% on average compared to not using DSTs, saving 1.97kg of pesticides per hectare, as shown in Figure 24.
4.2.15. Stevia cultivation
The use of an DST was evaluated in two stevia plots in 2018. This DST recommends the same amount of pesticides as a standard application without an DST. Thus, the cost of the tool included in the expenses related to pesticide management with DST increases the latter compared to the expenses related to standard pesticide management.
| Figure 24 – Average amount of pesticides applied with and without DST for grapes
|
4.2.16. Tomato cultivation
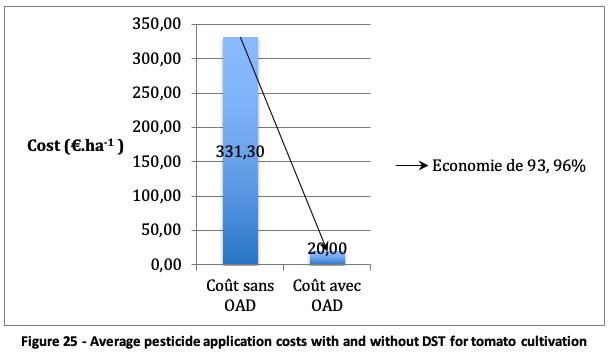
The use of a DST was evaluated in a tomato plot in 2018. This DST allows for an average reduction of 93.76% in pesticide management costs, i.e., an average saving of €311.3 per hectare, as shown in Figure 25.
| Figure 25 – Average pesticide application costs with and without DST for tomato cultivation
|
The DST recommends no pesticide application compared to not using the DST, saving 0.65kg of pesticides per hectare, as shown in Figure 26.
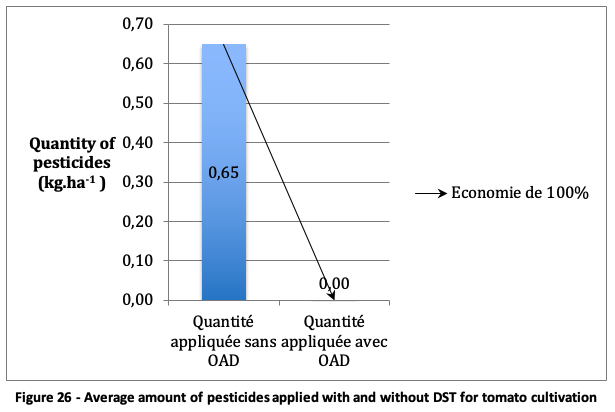
| Figure 26 – Average amount of pesticides applied with and without DST for tomato cultivation
|
4.2.17. Performance review of DST related to pesticide management
4.2.17.1. Environmental performance
The amount of pesticides applied with an DST is, on average, lower for almonds, beets, wheat, cotton, beans, olives, barley, peaches, pistachios, chickpeas, grapes and tomatoes, leading to a substantial decrease in costs. However, these amounts do not change for kiwi and stevia crops, leading to an increase in costs (related to the use of the Digital Support Tool).
The average amounts of pesticides recommended for potato cultivation with and without DST are the same, yet the average pesticide loads are lower with DST. These contradictory results reveal the need for further data agglomeration in order to have a more realistic representation of the average water consumption by these crops.
4.2.17.2. Economic performance
For almonds, beetroot, cotton, olives, peaches, pistachios, chickpeas, potatoes, grapes and tomatoes, the savings from pesticide use are greater than the cost of the DST. This is not the case for bean crop. As the same amount of pesticides are applied with or without DST for the stevia and kiwi crops, the cost of the tool is not reimbursed by the reduction in expenses.
For all these crops, no information is given on the yields obtained with or without DST. Such data would allow to measure the difference in gross product and the difference in gross margin.
In contrast to the first crops, the load difference, gross product difference and gross margin difference are given for wheat and barley. The DSTs used for these crops allow, on average, to increase the gross product and the gross margin compared to a standard production.
No conclusions can be drawn about the economic performance of crops other than wheat and barley without adding up the margin from reduced input costs and the gain from any additional production. This is especially true for the data obtained for beans, kiwis and stevia. Indeed, the cost of the tool can eventually be reimbursed by a higher gross product, obtained with the help of DST.
4.3. Fertilisation management
The environmental performance of DST related to fertilisation management is assessed from the difference in the amount of nutrient applied with or without a DST. When this data is not available, this evaluation is made from the difference in fertilisation costs. The cost of the tool is included in these costs. The economic performance is also assessed from the difference in fertilisation costs as well as from the gross products and gross margins, depending on the data available.
4.3.1. Almond cultivation
The use of a DST was evaluated in 24 almond cultivation plots in 2017 and 2018. This DST allows for an average reduction of 53.62% in fertilisation costs, i.e., an average saving of €261.25 per hectare, as shown in Figure 27.
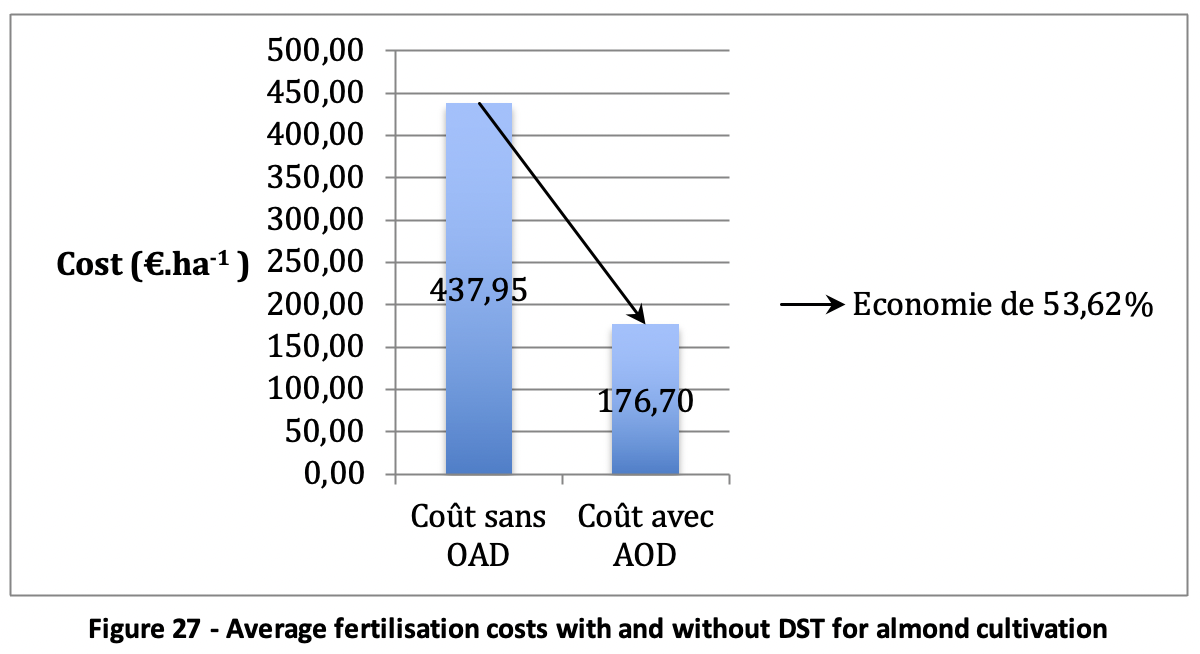
| Figure 27 – Average fertilisation costs with and without DST for almond cultivation
|
The use of DST reduces the amount of nutrients applied by 44.11% on average compared to not using DST, saving 131.90 kg of nutrients per hectare, as shown in Figure 28.
These observations are made on a small number of plots and years. The drastic reduction in nutrients obtained with the help of DSTs can only be assessed over a longer period of time, of at least three years.
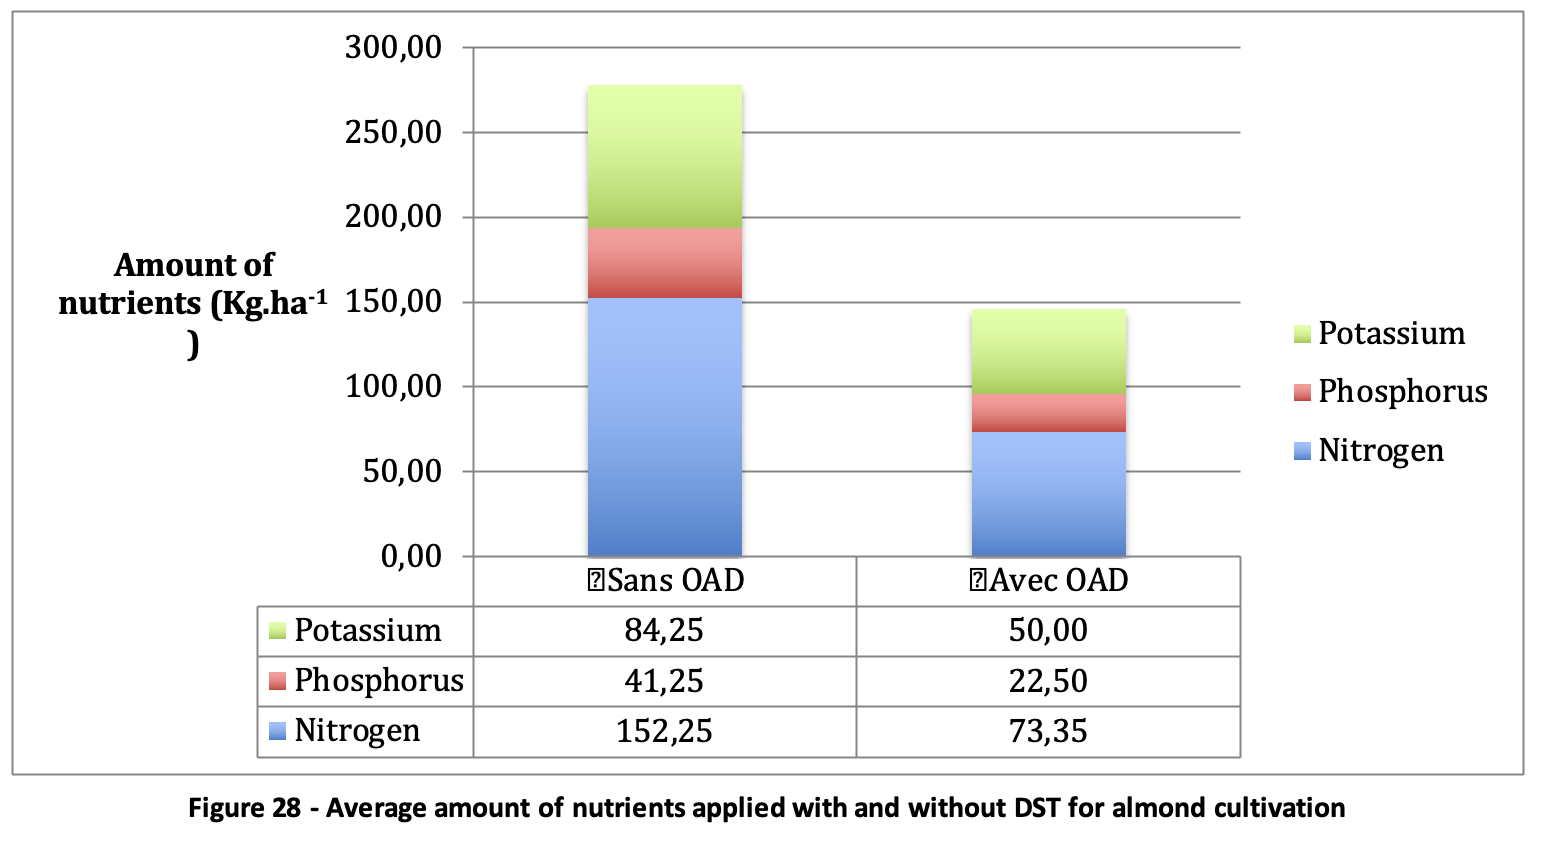
| Figure 28 – Average amount of nutrients applied with and without DST for almond cultivation
|
4.3.2. Wheat crop
The use of several DSTs evaluated on 3749 plots was compared to 11831 control plots for wheat cultivation over 17 years. These DSTs allow a saving of 7.65% of nutrients compared to a standard application. Without adding the cost of the tool to the fertilisation costs, a margin of 9€ per hectare is observed on average. Nutrient management with a DST reduces fertilisation costs by an average of 5.88%. Yet, the total cost per hectare of production, including the cost of the DST, increases by an average of €2.13 per hectare, as shown in the table below Figure 29.
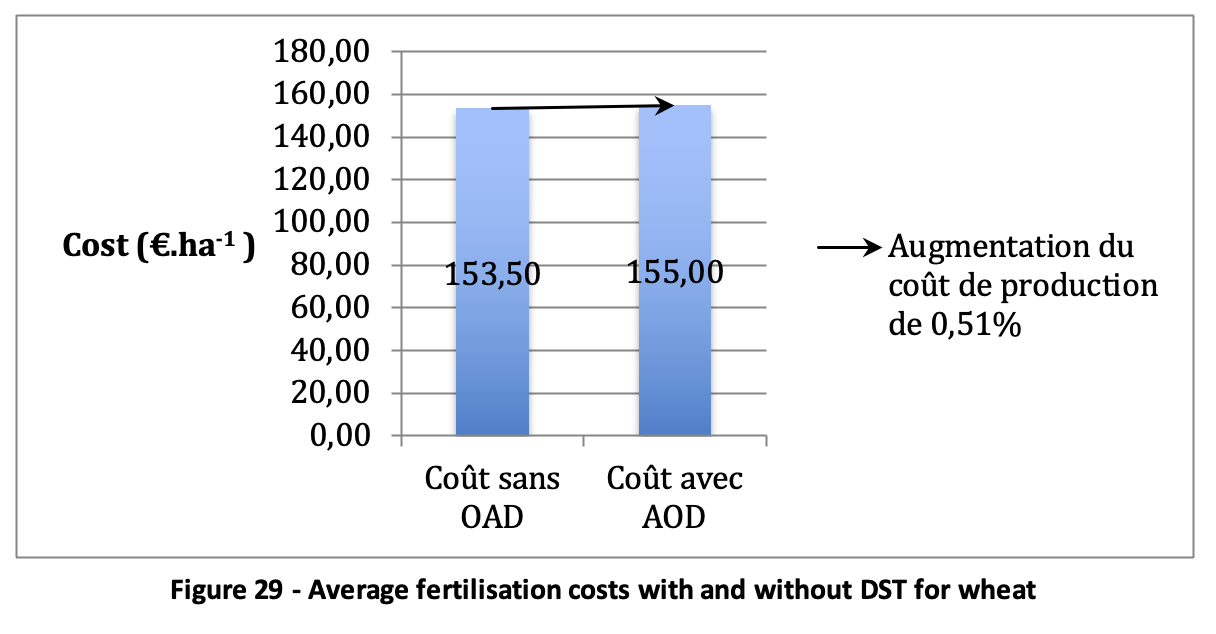
| Figure 29 – Average fertilisation costs with and without DST for wheat
|
But at the same time, an additional production of 3.93 quintals per hectare takes place on average thanks to the use of DST, increasing the gross product by €41.23 per hectare. An increase in gross margin of €31.97 per hectare on average is thus achieved.
4.3.3. Rapeseed crop
The use of several DST evaluated on 1383 plots was compared to 2732 control plots for oilseed rape cultivation between 2008 and 2010 and between 2017 and 2018. These DSTs reduce fertilisation costs by an average of 8.38%, i.e., an average saving of €18.26 per hectare, as shown in Figure 30. These DSTs allow for a 16% saving in nutrients, or €34.08 compared to a standard application without DST.
An additional production of 1.43 quintals per hectare takes place on average, increasing the gross product by €58.90 per hectare. An increase in gross margin of €51.20 per hectare on average is achieved.
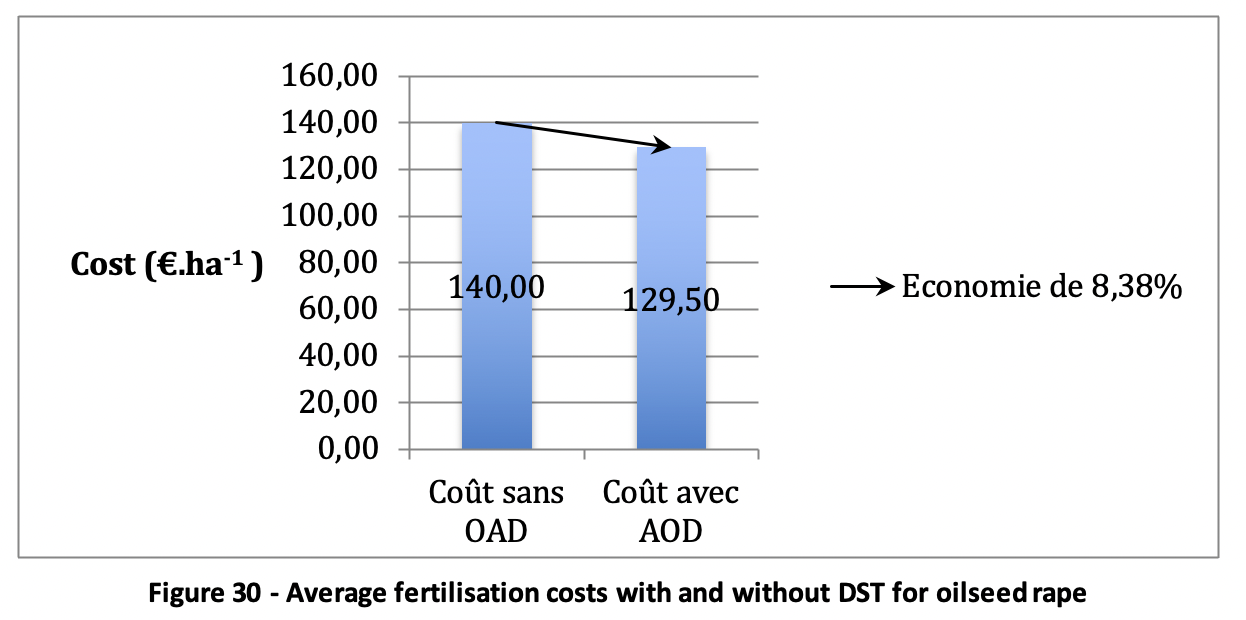
| Figure 30 – Average fertilisation costs with and without DST for oilseed rape
|
4.3.4. Cotton growing
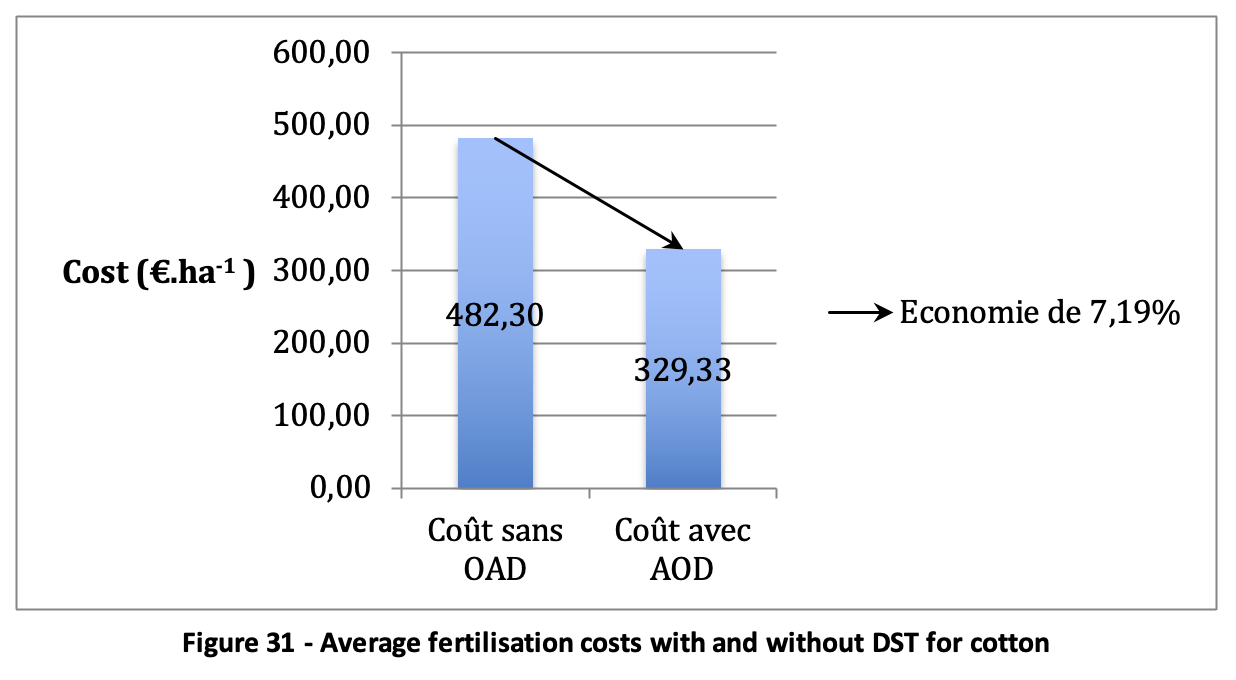
The use of a DST was evaluated in 48 cotton plots in 2017 and 2018. This DST allows for an average reduction of 7.19% in fertilisation costs, i.e. an average saving of €152.97 per hectare, as shown in Figure 31.
| Figure 31 – Average fertilisation costs with and without DST for cotton
|
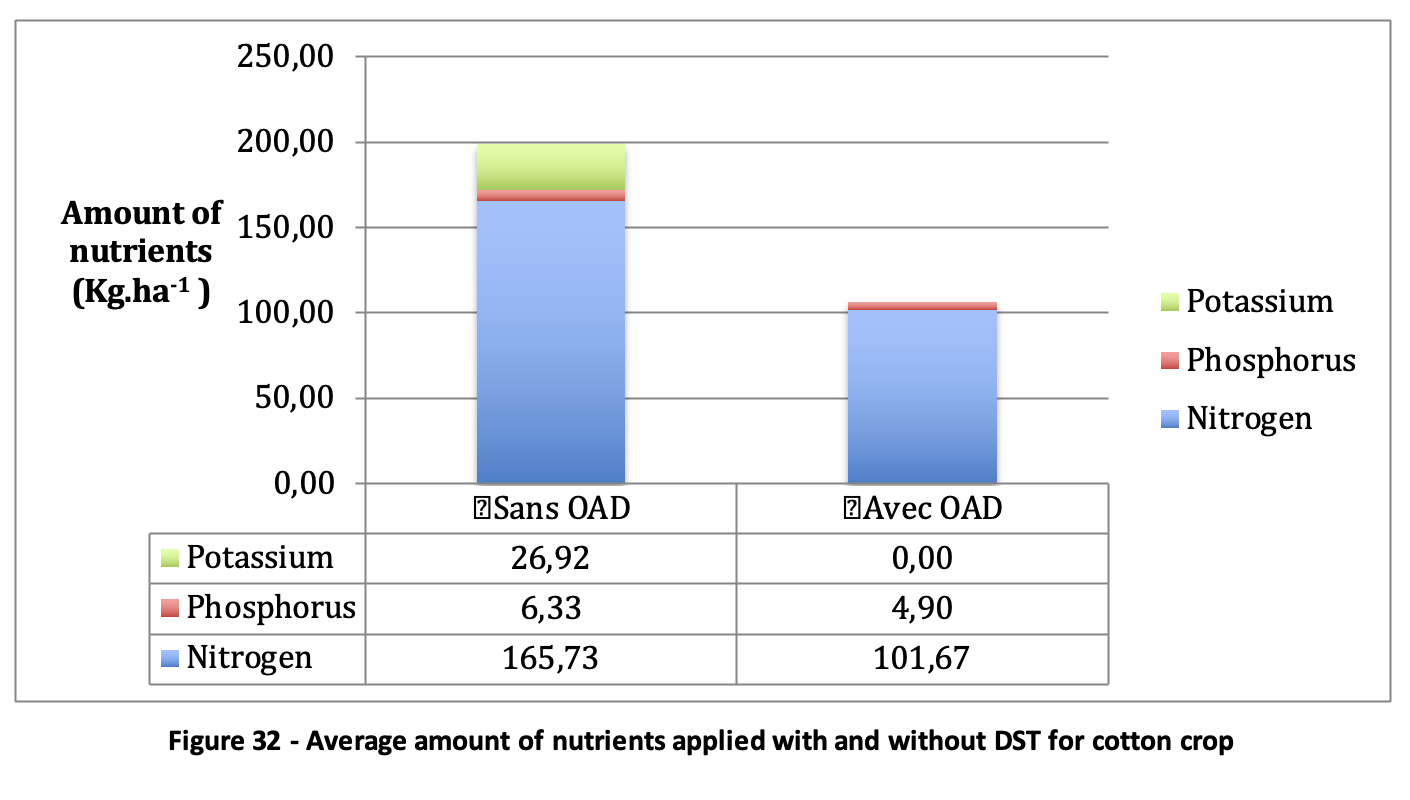
The use of DST reduces the amount of nutrients applied by 41.32% on average compared to not using DST, saving 92.42 kg of nutrients per hectare, as shown in Figure 32.
These observations are made on a small number of plots and years. The drastic reduction in nutrients obtained with the help of DSTs can only be assessed over a longer period of time, of at least three years.
| Figure 32 – Average amount of nutrients applied with and without DST for cotton crop
|
4.3.5. Growing lettuce
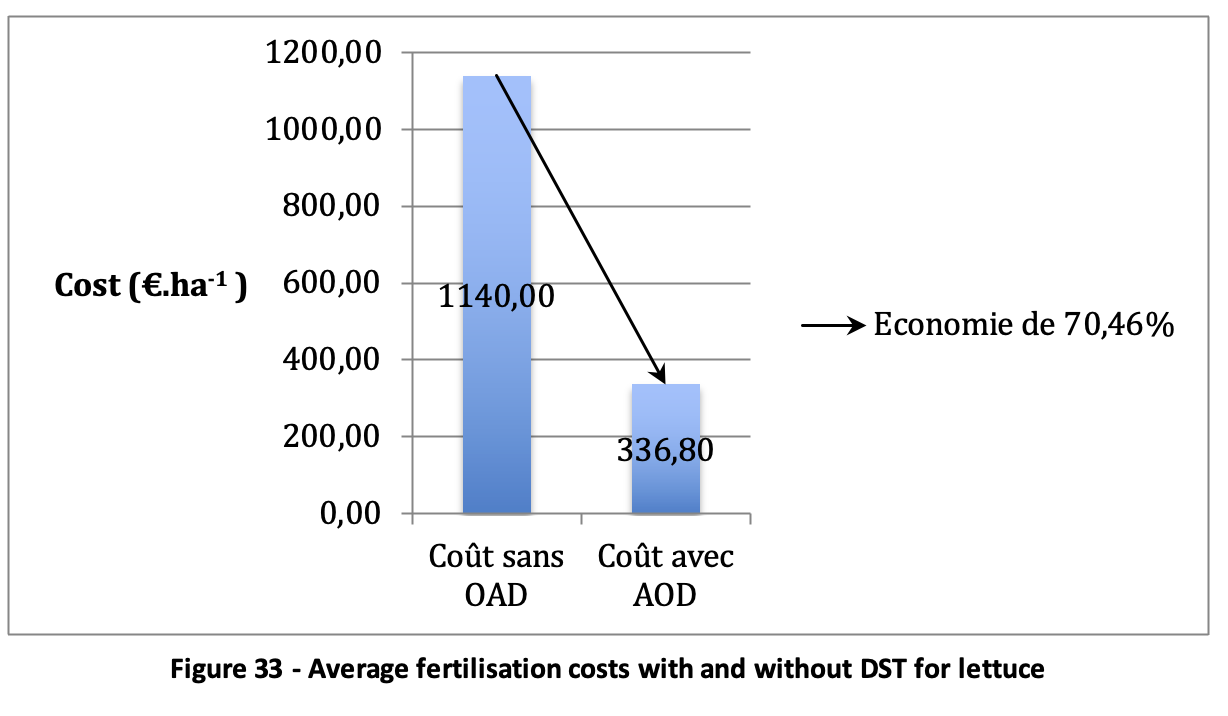
The use of a DST was evaluated in two lettuce plots in 2018. This DST reduces fertilisation costs by an average of 70.46%, i.e., an average saving of €803.20 per hectare, as shown in Figure 33.
| Figure 33 – Average fertilisation costs with and without DST for lettuce
|
The use of DST reduces the amount of nutrients applied by 77.50% on average compared to not using DST, saving 327.20 kg of nutrients per hectare, as shown in Figure 34.
These observations are made on a small number of plots and years. The drastic reduction in nutrients obtained with the help of DSTs can only be assessed over a longer period of time, of at least three years.
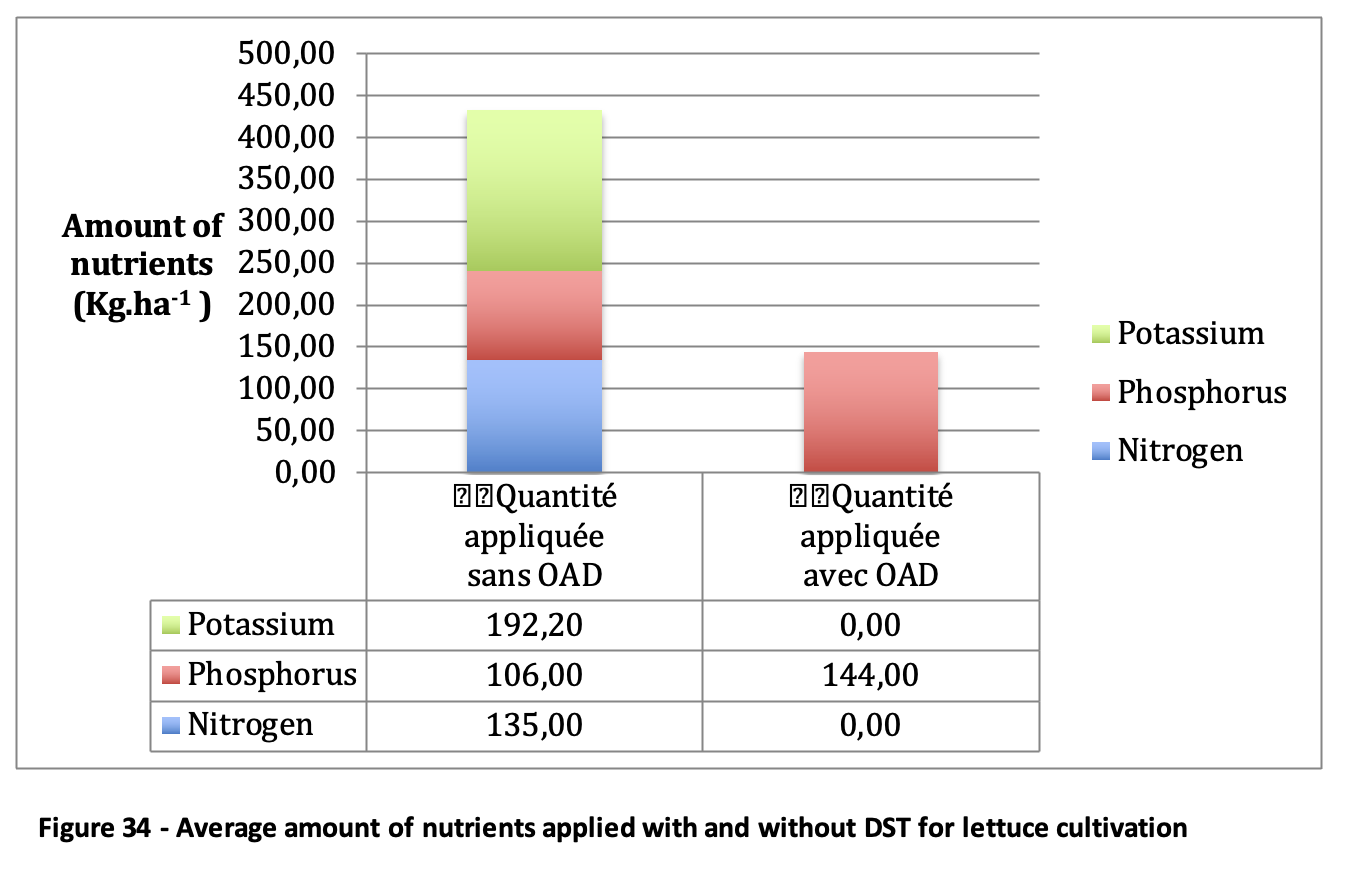
| Figure 34 – Average amount of nutrients applied with and without DST for lettuce cultivation
|
4.3.6. Olive growing
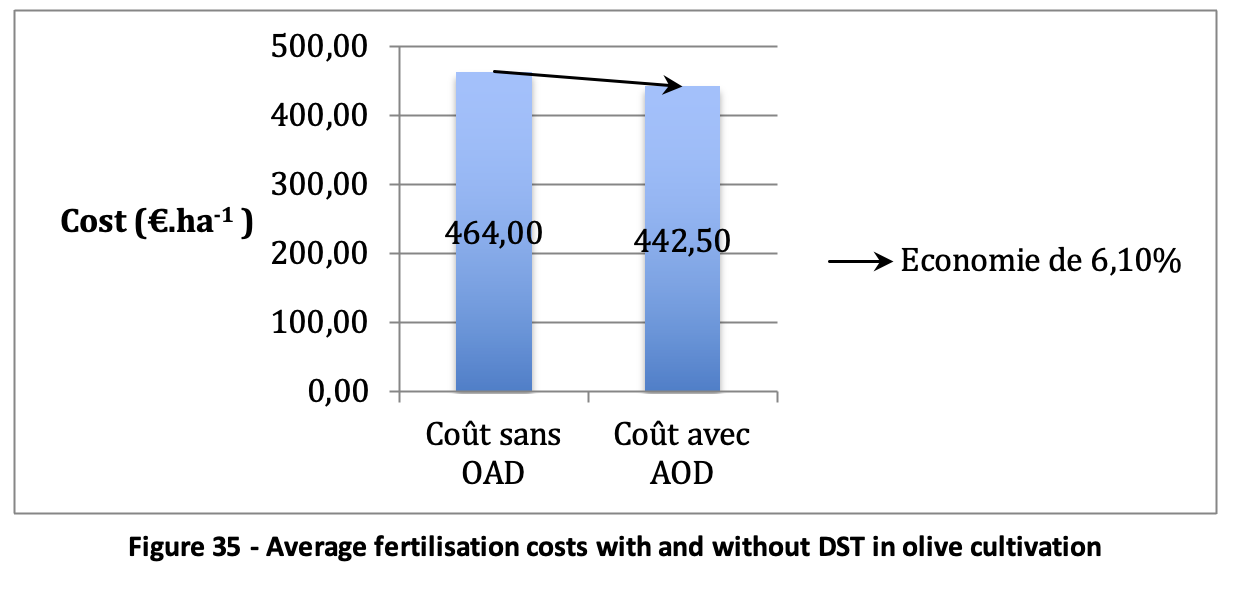
The use of a DDT was evaluated in 16 olive plots in 2017 and 2018. This DST allows for an average reduction of 6.10% in fertilisation costs, i.e. an average saving of €21.50 per hectare, as shown in Figure 35.
| Figure 35 – Average fertilisation costs with and without DST in olive cultivation
|
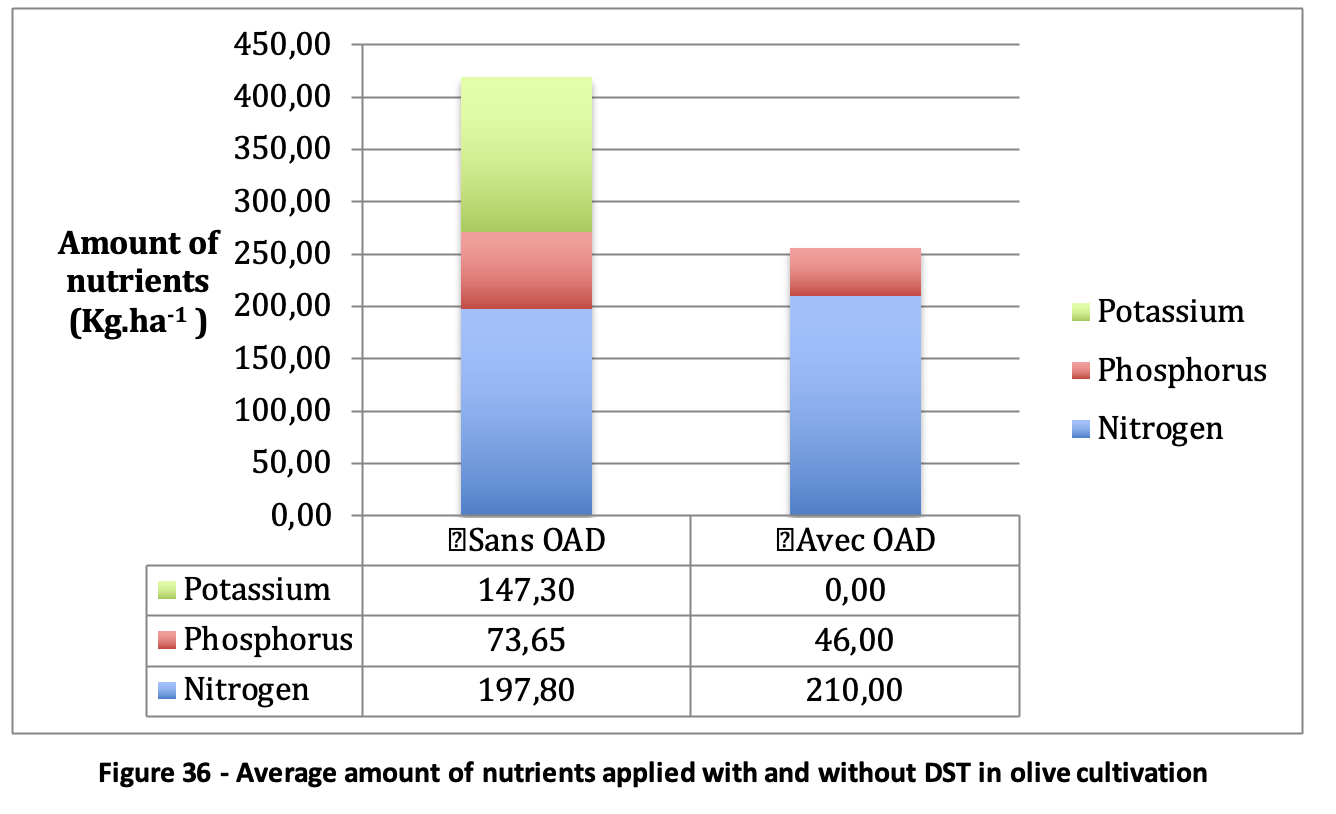
The use of DST reduces the amount of nutrients applied by an average of 38.87% compared to not using DST, saving 162.75 kg of nutrients per hectare, as shown in Figure 36.
| Figure 36 – Average amount of nutrients applied with and without DST in olive cultivation
|
These observations are made on a small number of plots and years. The drastic reduction in nutrients obtained with the help of DSTs can only be assessed over a longer period of time, of at least three years.
4.3.7. Barley cultivation
The use of several DSTs evaluated on 202 plots was compared to 2211 control plots for the barley crop between 2008 and 2010. This DST recommends on average the same amount of nutrients as a standard application without DST. Thus, the cost of the tool included in the fertilisation costs per hectare with DST increases the latter compared to standard fertilisation costs.
An additional production of 3.5 quintals per hectare takes place on average due to the use of DST, increasing the gross product by €52.50 per hectare. An increase in gross margin of €43.50 per hectare on average is thus achieved.
4.3.8. Peach growing
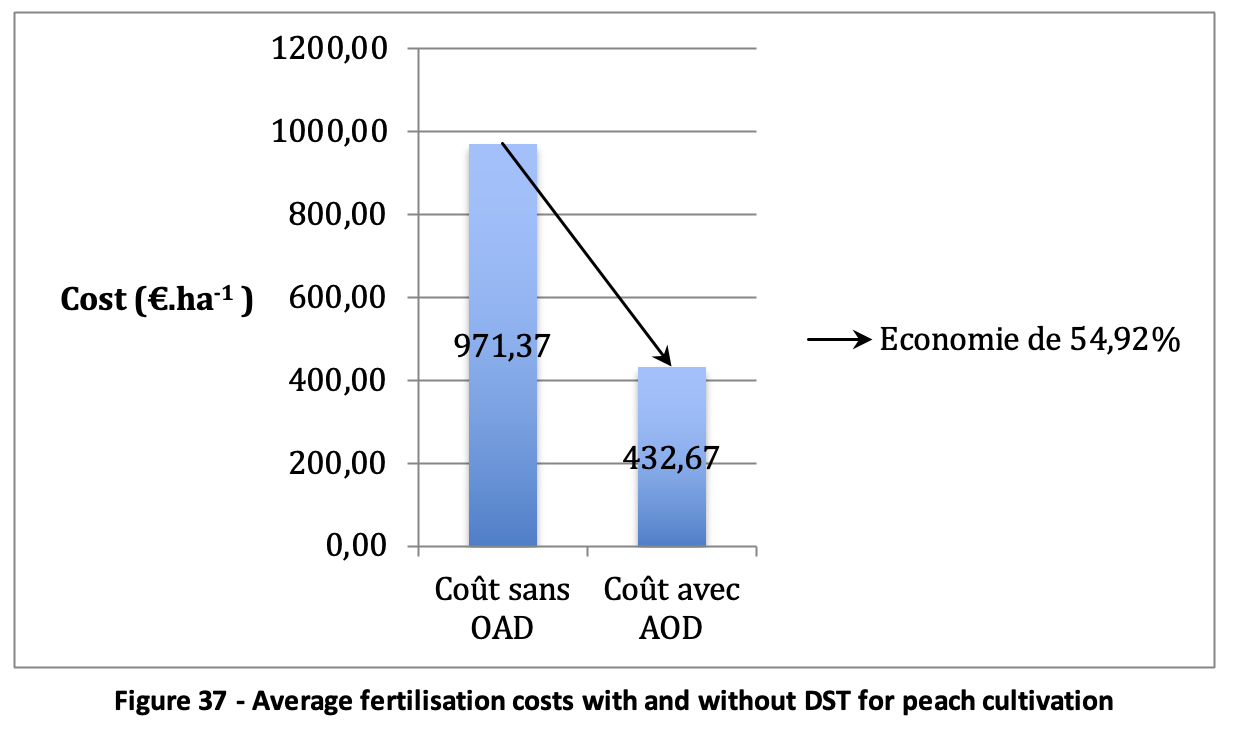
The use of a DST was evaluated in 24 peach orchard plots in 2017 and 2018. This DST allows for an average reduction of 54.92% in fertilisation costs, i.e., an average saving of €538.70 per hectare, as shown in Figure 37.
| Figure 37 – Average fertilisation costs with and without DST for peach cultivation
|
The use of DST reduces the amount of nutrients applied by 65.05% on average compared to not using them, saving 239.88 kg of nutrients per hectare, as shown in Figure 38.
These observations are made on a small number of plots and years. The drastic reduction in nutrients obtained with the help of DSTs can only be assessed over a longer period of time, of at least three years.
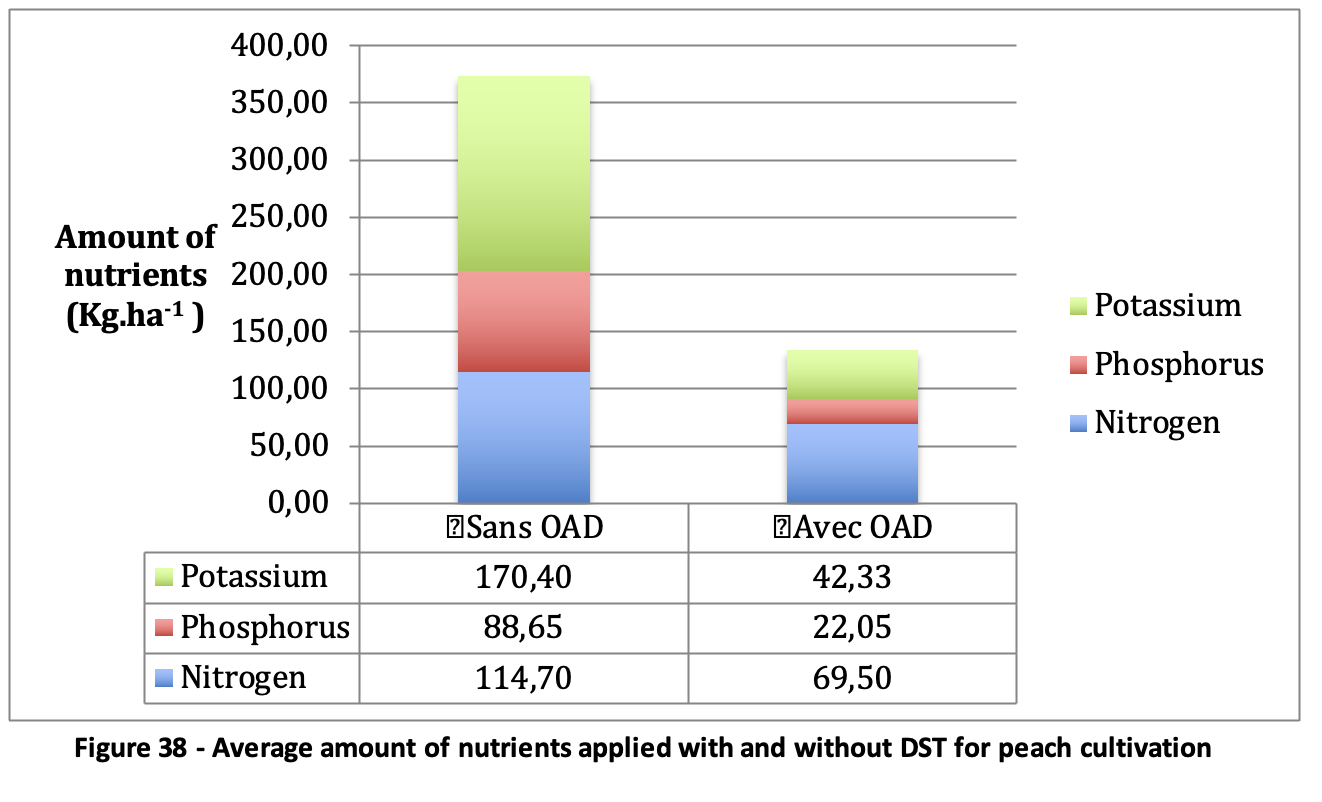
| Figure 38 – Average amount of nutrients applied with and without DST for peach cultivation
|
4.3.9. Potato cultivation
| Figure 39 – Average fertilisation costs with and without DST for potato crops
|
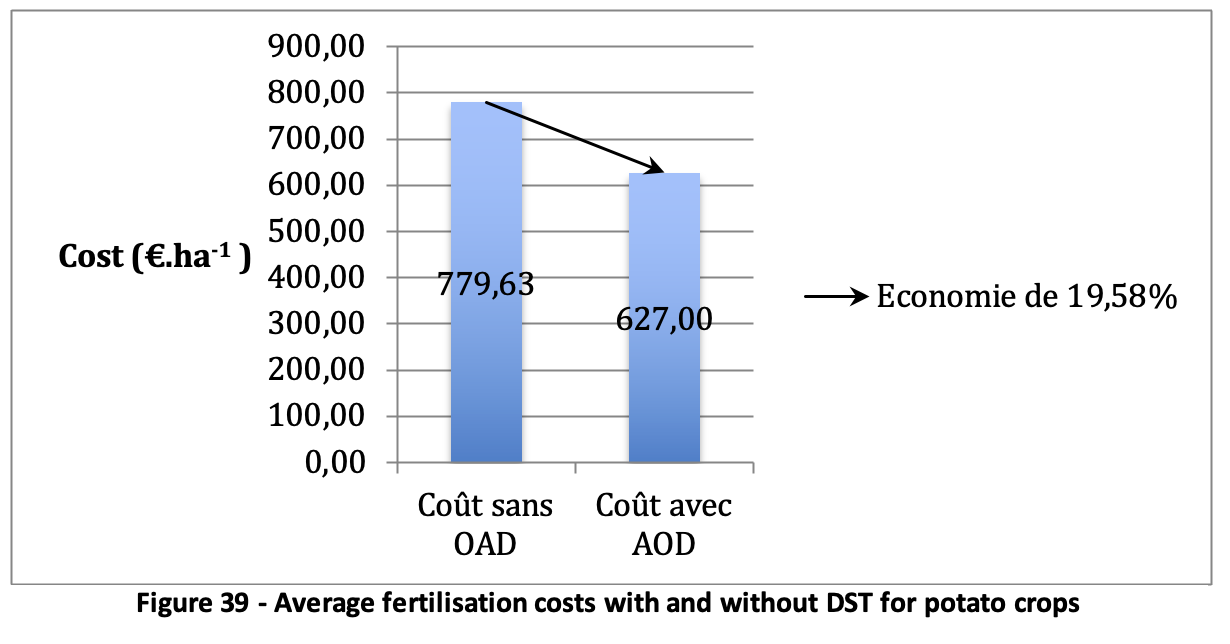
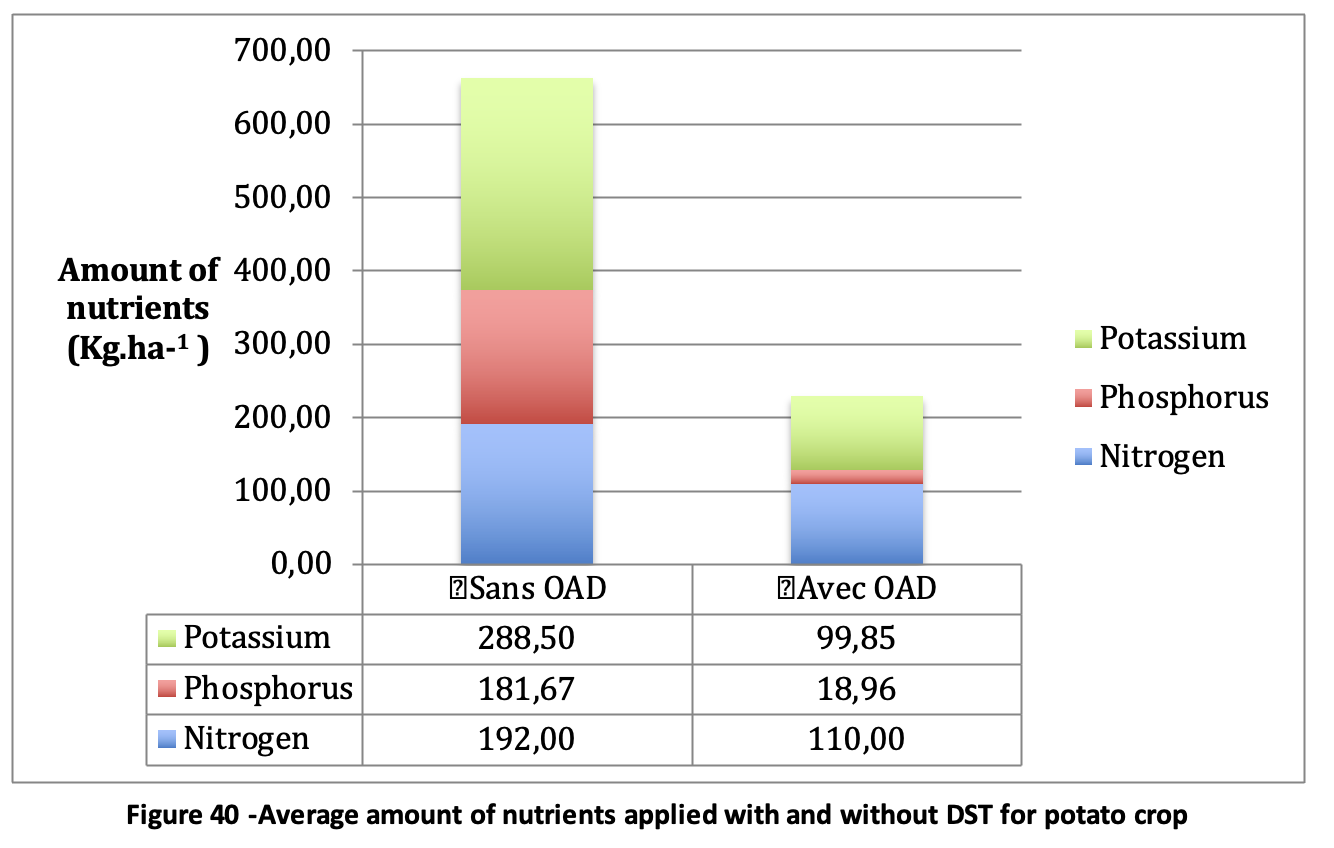
The use of a DST was evaluated in 12 potato plots in 2017. This DST reduces fertilisation costs by an average of 19.58%, resulting in an average saving of €152.63 per hectare, as shown in Figure 39.
The use of DST reduces the amount of nutrients applied by 65.45% on average compared to not using DST, saving 433.36 kg of nutrients per hectare, as shown in Figure 40.
These observations are made on a small number of plots and years. The drastic reduction in nutrients obtained with the help of DSTs can only be assessed over a longer period of time, of at least three years.
| Figure 40 -Average amount of nutrients applied with and without DST for potato crop
|
4.3.10. Grape growing
The use of an ADO was evaluated in 24 grape growing plots in 2018. This DMO allows for an average reduction of 40.13% in fertilisation costs, i.e. an average saving of €243.30 per hectare, as shown in Figure 41.
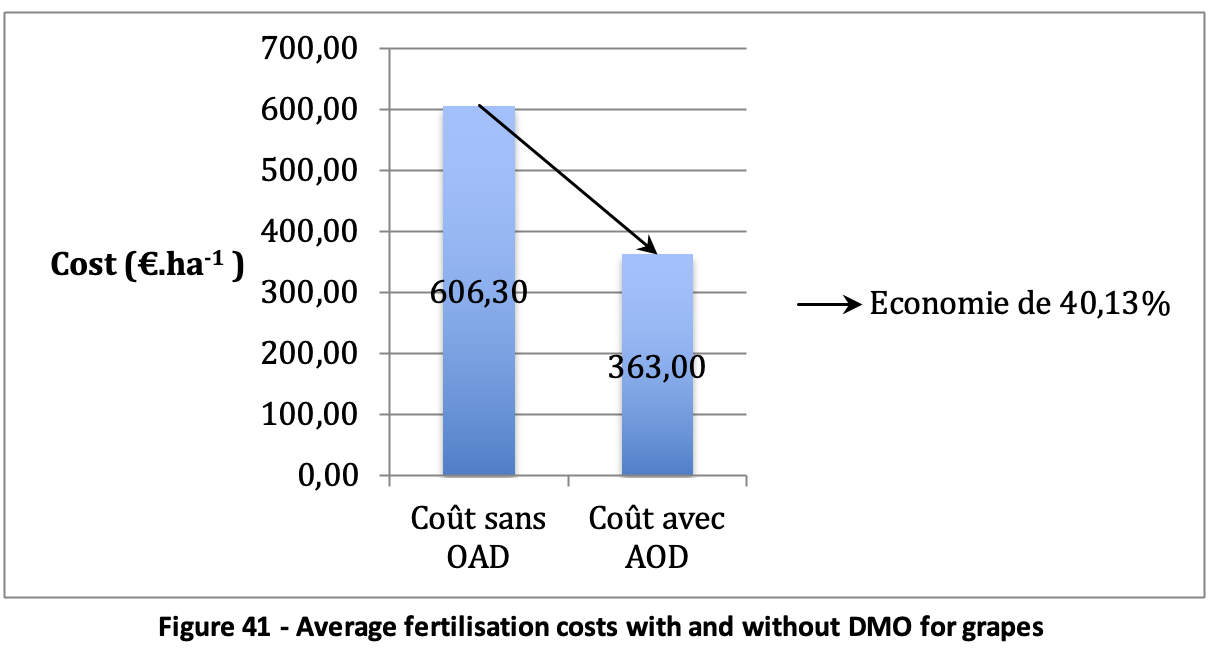
| Figure 41 – Average fertilisation costs with and without DMO for grapes
|
The use of DMO reduces the amount of nutrients applied by 33.56% on average compared to not using DMO, saving 74.77 kg of nutrients per hectare, as shown in Figure 42.
These observations are made on a small number of plots and years. The analysis of the difference in economic gain and inputs consumed with or without DMO can only be assessed over a longer period of at least three years.
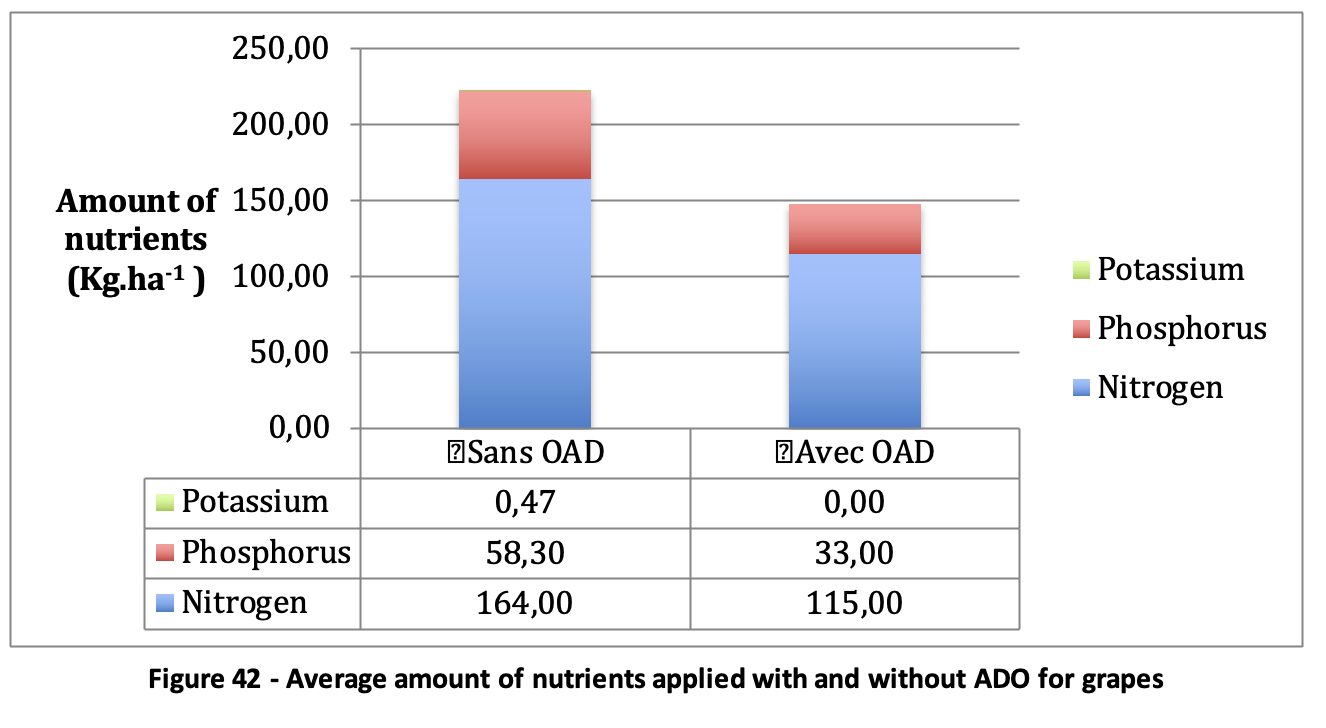
| Figure 42 – Average amount of nutrients applied with and without ADO for grapes
|
4.3.11. Tomato cultivation
The use of an DST was evaluated in four tomato plots in 2018. An increase of 43.60% in fertilisation costs was found on average with the use of the DST, increasing costs by an average of €217.70, as shown in Figure 43. The amount of these expenses is higher than the cost of the DST, meaning an increase in the recommended quantities of nutrients.
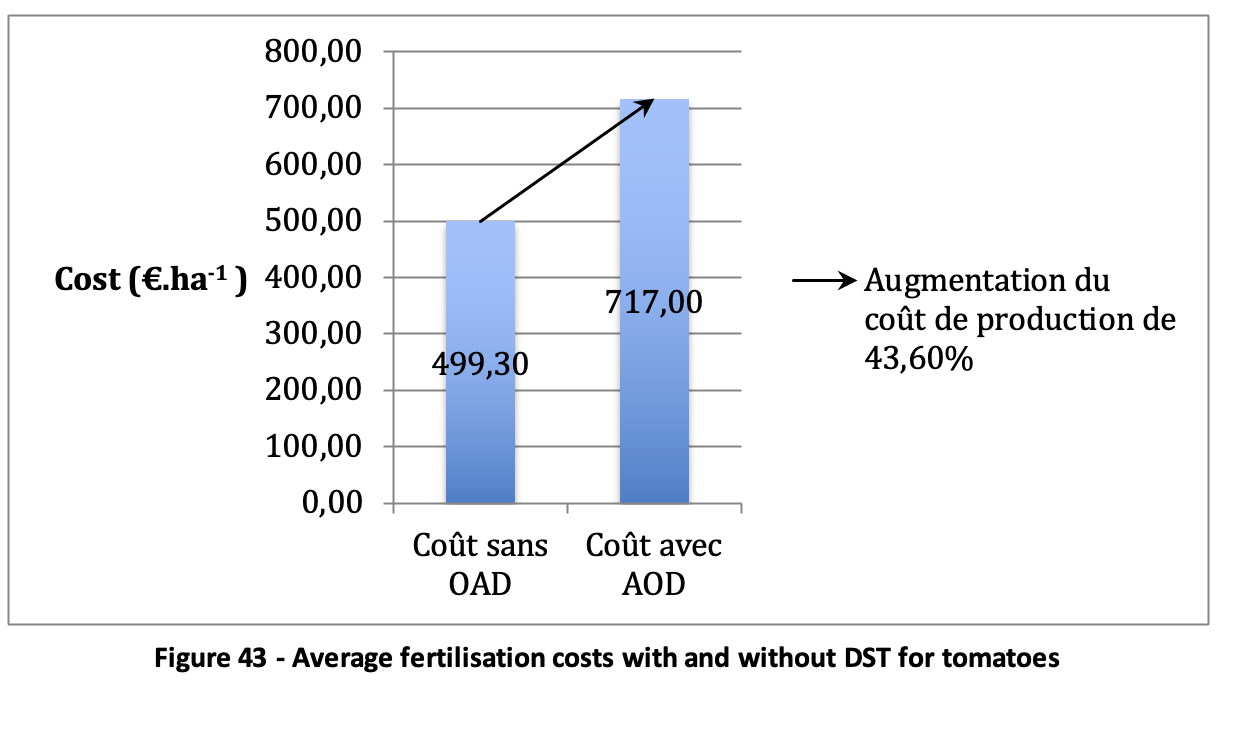
| Figure 43 – Average fertilisation costs with and without DST for tomatoes
|
However, the use of DST reduces the application of nitrogen, phosphorus and potassium by 9.73%, resulting in a saving of 41.30 kg per hectare, compared to not using DST, as shown in Figure 44. The increase in fertilisation costs corresponds to the application of other nutrients, as this DST also recommends application amounts for nutrients such as iron and magnesium.
These observations are made on a small number of plots and years. The analysis of the difference in economic gain and inputs consumed with or without DST can only be assessed over a longer period of at least three years.
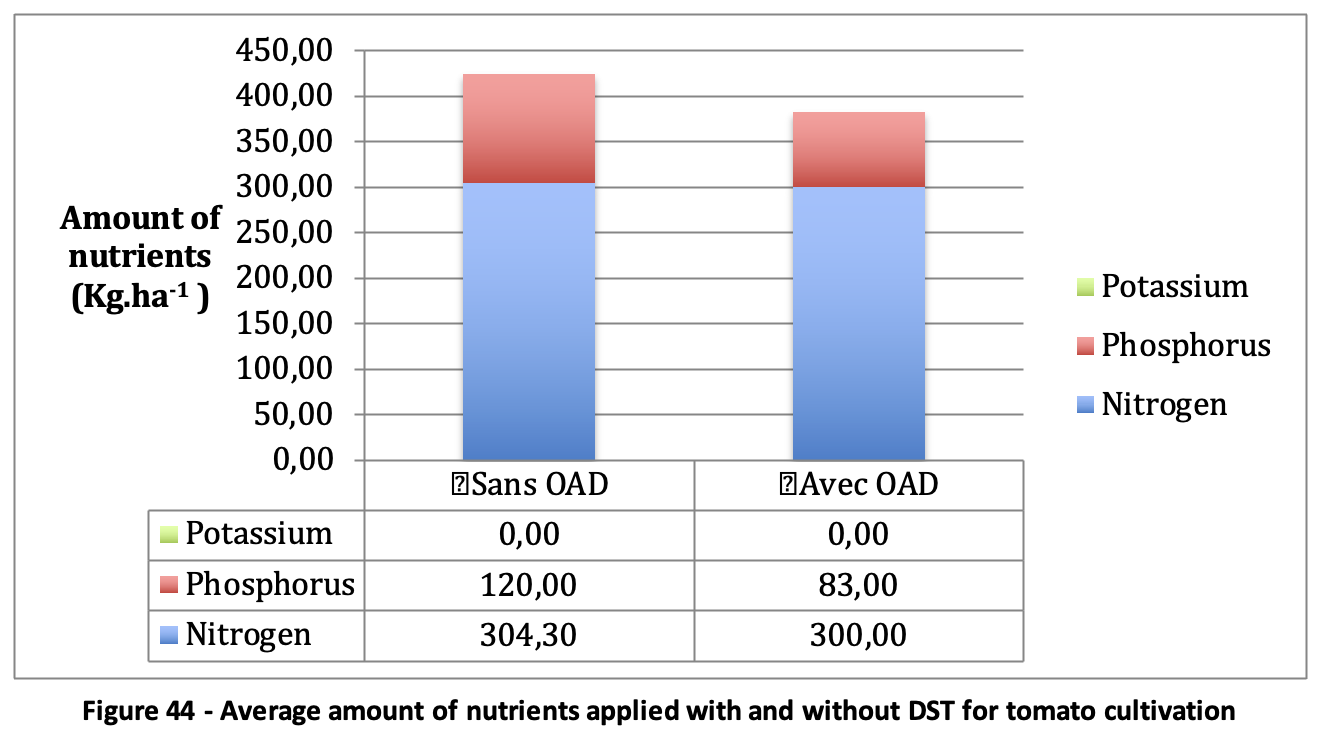
| Figure 44 – Average amount of nutrients applied with and without DST for tomato cultivation
|
4.3.12. Performance review of DSTs related to fertiliser management
4.3.12.1. Environmental performance
The amount of nutrients applied with an DST is on average lower for almonds, wheat, rape, cotton, lettuce, olives, peaches, potatoes, grapes and tomatoes. These amounts are equal for the barley crop.
4.3.12.2. Economic performance
On average, the use of DSTs results in a higher gross margin, compared against not using them for wheat, barley and oilseed rape.
DSTs can reduce fertilisation costs for almonds, cotton, lettuce, olives, peaches, potatoes and grapes. This is not the case for tomato crops. For these crops the study could not be conducted by analysing the yields per hectare with or without DSTs, unlike for wheat, barley and rape. Such data would allow to measure the real difference in gross product and the difference in gross margin.
Conclusions on economic performance cannot be drawn without adding up the margin from reduced input costs and the gain from any additional production. This observation is all the more valid for the data obtained for the tomato crop. Indeed, the cost of the tool can possibly be reimbursed by a higher gross product, obtained with the help of DSTs.
4.4. Summary of DST performance by crop
In order to assess the overall performance of the DSTs for each crop, the performance related to the management of the different inputs studied is summarised by crop for almonds, wheat, cotton, olives, barley, peaches, pistachios, potatoes, grapes and tomatoes.
The performance of the DSTs was evaluated on single input management for oilseed rape, beetroot, lettuce, maize, beans, kiwi, pistachio, chickpea and stevia. Figure 5 describes the performance assessed for each crop and links to the section detailing that performance.
Table 5 referring to the sections detailing the performance of oilseed rape, beetroot, lettuce, maize, beans, kiwifruit, pistachios, chickpeas and stevia
| Culture | Type of input | Part detailing the performance of ADOs |
| Rape | Fertilisers | 4.3.2 Colza |
| Beets | Pesticides | 4.2.2 Beet |
| Lettuce | Fertilizers | 4.3.4 Lettuce |
| Maize | Irrigation | 4.1.8 Maize |
| Beans | Pesticides | 4.2.6 Beans |
| Kiwi | Pesticides | 4.2.7 Kiwi |
| Chickpeas | Pesticides | 4.2.12 Chickpeas |
| Stevia | Pesticides | 4.2.15 Stevia |
4.4.1. Almond cultivation
Figure 6 summarises the economic and environmental performance of DSTs for almond cultivation.
Table 6 – Economic and environmental performance of DSTs for almond cultivation
| Environmental performance | Economic performance | |||
| Average input reduction | Average amount of inputs saved | Average input costs saved by DSTs | Average input costs saved
(€.ha-1 ) |
|
| Irrigation management | 31,70 % | 1091.35 m3 .ha-1 | 22,48% | 56,40 |
| Pesticide management | 11,25% | 1.07 kg.ha-1 | 13,88% | 34,18 |
| Fertilisation management | 42,11 % | 131.9 kg.ha-1 | 53,62% | 261,25 |
4.4.2. Wheat crop
Table 7 summarises the economic performance of DSTs for wheat cultivation. Table 8 shows the maximum nitrogen requirements and the gains obtained by these requirements, according to high vegetative development, over-fertilisation, low vegetative development and under-fertilisation. In this table, the cost of nitrogen is 1.kg-1 and the selling price of wheat is 15€.q-1 and the maximum tool cost is 15€.ha-1.
Table 7 – Economic performance of DSTs for wheat cultivation
| Average reduction in input costs | Average input costs saved
(€.ha-1 ) |
Average additional yield
(q.ha-1 ) |
Average additional gross product
(€.ha-1 ) |
Additional average gross margin
(€.ha-1 ) |
|||
| Durum wheat | Soft wheat | Durum wheat | Soft wheat | ||||
| Pesticide management | 78% | 50% | 32,76 | 21,00 | 2 | 15 | 21 |
| Fertilisation management | 0,51% | -7,27 | 3,93 | 54,23 | 44,97 | ||
Table 8 – Gains obtained for the maximum doses prescribed by the DSTs according to the condition of the wheat crop
| Crop condition | Maximum recommendation
(kg. ha-1 ) |
Yield (q. ha-1) | Economic gain (€. ha-1 )* |
| Strong vegetative development | -20 | same | 5 € |
| Over-fertilisation | -40 | same | 25 |
| Weak vegetative development | 20 | 2 | -5 |
| Under-fertilisation | 21,5 | 4,6 | 32,5 |
| *The maximum cost of the tool is taken into account. | |||
4.4.3. Cotton growing
Table 9 summarises the economic and environmental performance of DSTs for cotton cultivation.
Table 9 – Economic and environmental performance of DSTs for cotton cultivation
| Environmental performance | Economic performance | |||
| Average input reduction | Average amount of inputs saved | Average input costs saved by DSTs | Average input costs saved
(€.ha-1 ) |
|
| Irrigation management | 42,97% | 933.94 m3 .ha-1 | 44,03% | 677,72 |
| Pesticide management | 50,61% | 2.07 kg.ha-1 | 30,81% | 97,27 |
| Fertilisation management | 41,32 % | 92.42 kg.ha-1 | 7,19% | 152,97 |
4.4.4. Olive growing
Table 10 summarises the economic and environmental performance of DSTs in olive cultivation.
Table 10 – Economic and environmental performance of DSTs in olive growing
| Environmental performance | Economic performance | |||
| Average input reduction | Average amount of inputs saved | Average input costs saved by DSTs | Average input costs saved
(€.ha-1 ) |
|
| Irrigation management | 32,50% | 285.86 m3 .ha-1 | 25,62% | 182,32 |
| Pesticide management | 37,66% | 4.77 kg.ha-1 | 64,46% | 212,62 |
| Fertilisation management | 38,87% | 162.75 kg.ha-1 | 6,10% | 21,50 |
4.4.5. Barley crops
Table 11 summarises the economic and environmental performance of DSTs for barley cultivation. Table 12 shows the maximum nitrogen requirements and the gains obtained by these requirements, depending on high and low vegetative development. In this table, the cost of nitrogen is 1.kg-1 and the selling price of barley is 15€.q-1 and the maximum tool cost is 15€.ha-1 .
Table 11 – Economic performance of DSTs for barley cultivation
| Average input reduction | Average input costs saved
(€.ha-1 ) |
Average additional yield
(q.ha-1 ) |
Average additional gross product
(€.ha-1 ) |
Additional average gross margin
(€.ha-1 ) |
|
| Pesticide management | 65% | 15,3* | 1,3 | 19,5 | 12 |
| Fertilisation management | 0% | 0 | 3,50 | 52,50 | 43,50 |
| *The price of the DST is included in the charges | |||||
Table 12 – Gains obtained for the maximum rates prescribed by the DSTs according to the condition of the barley crops
| Crop condition | Maximum recommendation
(kg. ha-1 ) |
Yield (q. ha-1) | Economic gain (€. ha-1 )* |
| Strong vegetative development | -20 | same | 5 |
| Weak vegetative development | 20 | 3,5 | 17,5 |
| *The maximum cost of the tool is taken into account.
|
|||
4.4.6. Peach growing
Table 13 summarises the economic and environmental performance of DSTs for peach cultivation.
Table 13 – Economic and environmental performance of DMOs for peach cultivation
| Environmental performance | Economic performance | |||
| Average input reduction | Average amount of inputs saved
|
Average input costs saved by DSTs | Average input costs saved
(€.ha-1 ) |
|
| Irrigation management | 18,54% | 422.58 m3 .ha-1 | 12,74% | 96,04 |
| Pesticide management | 12,44% | 2.95 kg.ha-1 | 12,05% | 133,41 |
| Fertilisation management | 65,05% | 239.88 kg.ha-1 | 54,92% | 538,70 |
4.4.7. Pistachio cultivation
Table 14 summarises the economic and environmental performance of DSTs for pistachio cultivation.
Table 14 – Economic and environmental performance of DSTs for pistachio cultivation
| Environmental performance | Economic performance | |||
| Average input reduction | Average amount of inputs saved | Average input costs saved by DSTs | Average input costs saved
(€.ha-1 ) |
|
| Irrigation management | 24,61% | 60 m3 .ha-1 | 17,61% | 49,60 |
| Pesticide management | No data | 36,46% | 29 | |
4.4.8. Potato cultivation
Table 15 summarises the economic and environmental performance of DSTs for potato cultivation.
Table 15 – Economic and environmental performance of DSTs for potato cultivation
| Environmental performance | Economic performance | |||
| Average input reduction | Average amount of inputs saved | Average input costs saved by DSTs | Average input costs saved
(€.ha-1 ) |
|
| Irrigation management | 32,56% | 1220.5 m3 .ha-1 | 27,44% | 107,50 |
| Pesticide management | 0% | 0 kg.ha-1 | 6,47% | 35,52 |
| Fertilisation management | 65,45% | 433.36 kg.ha-1 | 19,58% | 152,63 |
4.4.9. Grape growing
Table 16 summarises the economic and environmental performance of DSTs for grape growing.
Table 16 – Economic and environmental performance of DSTs for grape growing
| Environmental performance | Economic performance | |||
| Average input reduction | Average amount of inputs saved | Average input costs saved by DSTs | Average input costs saved
(€.ha-1 ) |
|
| Irrigation management | 42,71% | 782.8 m3 .ha-1 | 41,97% | 1155,34 |
| Pesticide management | 12,19% | 1.97 kg.ha-1 | 27,02% | 263,44 |
| Fertilisation management | 33,56% | 74.77 kg.ha-1 | 40,13% | 243,30 |
4.4.10. Tomato cultivation
Table 17 summarises the economic and environmental performance of DSTs for tomato cultivation.
Table 17 – Economic and environmental performance of DSTs for tomato cultivation
| Environmental performance | Economic performance | |||
| Average input reduction | Average amount of inputs saved | Average input costs saved by DSTs | Average input costs saved
(€.ha-1 ) |
|
| Pesticide management | 100% | 0.65 kg.ha-1 | 93,96% | 311,3 |
| Fertilisation management | 9,73% | 41.30 kg.ha-1 | -43,60% | -217,70 |
5. Discussion
5.1. Performance of DSTs
5.1.1. Environmental performance
The quantities of water, pesticides and the main nutrients (nitrogen, phosphorus and potassium) recommended by the DSTs are on average less than or equal to the quantities applied with traditional methods.
5.1.2. Economic performance
The economic performance of a DST can be due to a reduction in input costs and an increase in yield, and, therefore, gross product. Only gross products are given for wheat, rape and barley. The gross margins for these crops are positive for all three types of inputs studied.
The economic performance of DSTs for almonds, beetroot, cotton, beans, kiwifruit, lettuce, maize, olives, peaches, pistachios, chickpeas, potatoes, grapes, stevia and tomatoes was assessed using the cost of production, in the absence of the raw products for these crops.
For all the inputs studied, the quantities recommended by the DSTs for these crops generally allow a reduction in the cost of production. As the cost of the DSTs is included in the cost of production, the input savings achieved with the help of the technology ensure a return on investment.
The return on investment of the tool through the cost of production does not occur when the recommended quantities are equal to the quantities usually applied. This is notably the case for the quantities of pesticides recommended on average for kiwi and stevia crops. It does not occur either when the amount of expenses saved by the use of a DST is lower than the cost of the DST. This is the case for the bean crop for pesticide management.
5.1.3. Limitations and perspectives of the analysis
The measurement of environmental performance is based on the analysis of the quantities of inputs used. For pesticide management, quantitative data are not available for all crops. It would be useful to obtain data for all crops in order to be able to assess the environmental performance of each crop in a consistent manner.
Access to the raw product would allow full quantification of economic performance for each crop based on gross margin. It would then be possible to know whether investments in DSTs are cost-effective for pesticide management of beans, kiwis and stevia crops, through the additional gross revenue generated.
The yields obtained are influenced by the interaction of many factors, including the inputs applied. Inputs not considered in the analysis may come into play, as in the case of fertilisation management for the tomato crop.
Data must be aggregated over at least three years to take into account interannual variability (Lebacq, Baret and Stilmant, 2013). This is the case for wheat, barley and beet crops, whereas data for other crops are only aggregated over one or two years. Similarly, the number of land plots studied should be as large as possible. The economic and environmental performance of DSTs studied on less than 30 different plots is not very representative. This is the case for almonds, cotton, beans, kiwis, olives, peaches, pistachios, chickpeas, potatoes, grapes, stevia, and tomatoes.
The averages for each crop are obtained from data from France and Greece. The evaluation of the performance of precision agriculture is intended to be valid on a European scale, but the quantities of inputs applied are highly dependent on climatic conditions. For this reason, it would be useful to supplement the data obtained for each crop with data from other European regions or other countries.
This study does not cover all the components of digital agriculture. It illustrates the concrete results of precision agriculture on farms. These tools have, a priori, an economic and environmental interest that confirms the performances observed during the experiments. The orders of magnitude obtained for the percentages of savings need to be refined. This is why it would be interesting to continue this work by aggregating the data that will be obtained in the years to come and by expanding the number of crops analysed, the number of regions and the number of plots studied.
5.1.4. Assessment of the performance of DSTs
Adjusting input amounts at the inter- or intra-plot scale limits leaching risks. The use of pesticides adapted to pressures reduces the presence of chemical residues while ensuring production. Automated precision farming or farming coupled with robotics would be more precise and could reduce traces of input residues to zero. However, these tools are expensive and do not yet provide a return on investment (Zarco-Tejada, Hubbard and Loudjani, 2014) unlike precision farming tools, such as sensors, weather stations, satellite images, cameras, and input management DSTs.
The reduction in the amount of inputs often achieved shows that agriculture can produce more with less. With the help of precision tools, used in levels 1, 2 and 3 of precision agriculture, agriculture can contribute to food safety and food security.
Other benefits on soil quality are obtained for higher levels, using automated driving and robotisation. These include a reduction in soil compaction due to less frequent use of lighter farm machinery (Zarco-Tejada, Hubbard and Loudjani, 2014).
5.2. Consequences of the implementation of digital agriculture
Digital farming will affect many aspects, first and foremost working conditions and farming practices. Farms may gain in sustainability, but in return they may become more dependent on consultancies. On a larger scale, food security can be enhanced, as can social cohesion. However, traditional knowledge and the use of local genetic resources will need to be preserved. These effects depend in part on the accessibility of techniques, the transparency of algorithms and the good governance of the data shared and held (Kritikos, 2017).
5.2.1. Impact on jobs
There are mixed views on the impact of the advent of digital farming on agricultural jobs. Some fear that the fall in the number of farmers will get worse (Kritikos, 2017). Others argue that digital farming would increase employment in rural areas and in the agricultural sector, particularly through the attraction generated by the use of digital technology (Schrijver, 2016).
Precision farming tools – sensors, weather stations, satellite images, cameras, and input management DSTs – do not replace farmers’ work in the way that robots might. Implemented in levels 1, 2 and 3 of digital farming, they do not have such an impact on farming jobs.
Jobs are also being created in other sectors. Digital agriculture offers the agricultural supply sector new avenues of conversion, in line with societal expectations related to the reduction of input use.
5.2.2. Digital agriculture in relation to farming systems
Digital farming is seen as cutting across agricultural systems. The tools offered by digital farming can be implemented in all farming systems.
Although digital farming can increase input efficiency, it can be implemented in agricultural systems whose practices can sometimes be harmful to the environment. This is particularly the case in conventional agriculture, where monoculture remains a widespread practice (Kritikos, 2017).
The development of digital agriculture would therefore be done in parallel with the promotion of farming systems that are both economically and environmentally efficient. The latter will help to strengthen the environmental performance of farms, as will the implementation of measures to protect the environment and increase biodiversity.
5.2.3. Digital agriculture and the diversity of European farms
The size and structure of farms in Europe are very diverse. At present, digital tools are mainly used on large farms that can make the investment profitable on their own (Kritikos, 2017).
Alternatives exist to facilitate access to these tools for small farms. Such investments can be made jointly through cooperatives or farmer groups. These investments can also be supported by a third party organisation, as it is the case for GAIA. The size of the farm is therefore not the limiting factor for the development of digital farming as such. Rather, it is the management and organisation mode.
5.3. Stimulating the transition to digital agriculture
Digital farming can boost the economic and environmental performance of farms. It also has the potential to simplify the administration of the CAP and to more accurately measure the effects of policies such as the Eco-schemes.
In view of the potential of digital agriculture at farm level and at EU political one, it seems worthwhile for the CAP and for a specific European plan of investment in Agriculture to support investment in the transition to these tools. The Commission proposed a recovery plan of €20 billions for Agriculture. European council reduced it to €8 billions to be shared between MS which used them to finance some priorities not only innovation and investments. Thus, an investments plan of at least €15 billions is still needed to support precision and digital transition of EU farms and training for farmers.
Conclusion
Among the digital tools, the ones related to precision agriculture make it possible to combine productivity and sustainability in Europe. These sensors, weather stations, satellite images, cameras, and input management DSTs correspond to levels 1, 2 and 3 of digital agriculture.
They seem to ensure, at the European farm level, a more efficient management of inputs and an increase in yields. These elements guarantee a return on investment, and confirm the performances observed during the experiments. The measurement of these performances should be continued in the coming years, by extending the number of crops, the number of regions and the number of plots studied, in order to refine the orders of magnitude.
These digital tools are transversal to agricultural systems.
The generalisation of digital tools on a European scale would also make it possible to reduce the administrative burden of the CAP. The data generated by such tools could be used to feed indicators that would automatically assess the environmental performance of farms with much greater accuracy.
Digital farming can therefore boost the economic and environmental performance of farms. It also has the potential to simplify the administration of the CAP and to more accurately measure the effects of policies such as the Eco-schemes.
In view of the potential of digital agriculture at farm level and at the level of the CAP, it seems worthwhile for the CAP to support investment and the transition to these tools.
This support can be envisaged in both pillars of the CAP. It could take place through flat-rate transition incentives in the framework of the Eco-schemes, and through the creation of a priority support for green double performance investments in agriculture allowing to support a European plan of 20 billion € of such investments over the next 7 years (investments financed at 50% by the CAP by mobilising 3% of the CAP envelope in each Member State).
Certifications ensuring that these tools are used in good manners and conditions could complement this support.
Digital agriculture also presents question marks in Europe. Threats related to the management of farm data, autonomy and the position of farmers in relation to other actors, are risks to be considered in the context of digital development. In order to benefit from these tools and minimise the threats to individual farms, it is necessary to put in place, in parallel, a European legislative framework concerning its use. The promotion of quantified benefits and training for farmers should be developed.
Bibliography
Arvalis (2019) OAD – Crop management. Available at: https://www.arvalis-infos.fr/tous-les-outils-d-aide-a-la-decision-conduite-des-cultures-@/view-1457-arvstatiques.html (Accessed: 23 August 2019).
Bourguignon, D. (2017) EU Pesticide Policy and Legislation: Plant Protection Products and Biocides. Brussels. Available at: http://www.europarl.europa.eu/thinktank.
Brown, A. et al (2018) Threats to Precision Agriculture. Available at: https://www.dhs.gov/sites/default/files/publications/2018 AEP_Threats_to_Precision_Agriculture.pdf.
COGECA, C. (2018) ‘EU Code of conduct on agricultural data sharing by contractual agreement’, Copa Cogeca, pp. 1-11. Available at: http://cema-agri.org/sites/default/files/publications/EU_Code_2018_web_version.pdf.
COMAGRI (2019) The Common Agricultural Policy After 2020: Environmental Ambition and Simplification. Available at: https://ec.europa.eu/info/sites/info/files/food-farming-fisheries/key_policies/documents/cap-post-2020-environ-benefits-simplification_fr.pdf.
data agri (2018) Charter on the use of agricultural data.
DGCOMM (2016) Europeans, Agriculture and the Common Agricultural Policy (CAP). Brussels.
EU Member States (2019) A smart and sustainable digital future for European agriculture and rural areas.
European Commission (2018) Regulation of the European Parliament and of the Council laying down rules governing support for strategic plans to be drawn up by Member States under the common agricultural policy (‘CAP strategic plans’). Brussels.
European Commission (2019) Common Agricultural Policy. Available at: https://ec.europa.eu/info/food-farming-fisheries/key-policies/common-agricultural-policy_fr (Accessed: 25 July 2019).
Farm Europe (2019) Adopted positions by the Agriculture Committee of the European Parliament Next steps.
Ivanova, I. et al. (2018) Broadband in the EU Member States: despite progress, not all the Europe 2020 targets will be met.
Jereb, S. et al. (2017) Greening: increased complexity of the income support scheme and still no environmental benefit.
Kernecker, M. et al. (2019) ‘Experience versus expectation: farmers’ perceptions of smart farming technologies for cropping systems across Europe’, Precision Agriculture. Springer US, pp. 1-17. Available at: https://doi.org/10.1007/s11119-019-09651-z.
Kritikos, M. (2017) Precision agriculture in Europe: Legal, social and ethical considerations. Brussels. Available at: http://www.europarl.europa.eu/RegData/etudes/STUD/2017/603207/EPRS_STU(2017)603207_EN.pdf.
Lebacq, T., Baret, P. V. and Stilmant, D. (2013) ‘Sustainability indicators for livestock farming. A review’, Agronomy for Sustainable Development, 33(2), pp. 311-327. doi: 10.1007/s13593-012-0121-x.
United Nations (2019) Sustainable Development Goals. Available at: https://www.un.org/sustainabledevelopment/fr/ (Accessed: 1 July 2018).
Panagos, P. et al (2019) Cap Specific Objectives, brief 5 – EFFICIENT SOIL MANAGEMENT.
Paraforos, D. S. et al. (2019) ‘Agricultural data ownership and use: digital farming perspective’, in Montpellier, S. (ed.) Poster Proceedings of the 12th European Conference on Precision Agriculture, July 8-11, Montpellier, France. Montpellier, pp. 144-145.
Say, S. M. et al (2018) ‘The Online Journal of Science and Technology’, TOJSAT, 8(1), pp. 7-15.
Schrijver, R. (2016) Precision agriculture and the future of farming in Europe. Brussels.
Souza, E. et al. (2019) ‘AGDATABOX: Web platform of data integration, software and methodologies for digital agriculture’, in SupAgro Montpellier (ed.) Poster Proceedings of the 12th European Conference on Precision Agriculture, July 8-11, Montpellier, France. Montpellier.
Zampti, F. (2019) ‘Ethical and legal aspects of open data in agriculture and nutrition’, in SupAgro Montpellier (ed.) Poster Proceedings of the 12th European Conference on Precision Agriculture, July 8-11, Montpellier, France. Montpellier, pp. 198-199.
Zarco-Tejada, P. J., Hubbard, N. and Loudjani, P. (2014) Precision agriculture: an opportunity for Eu farmers-potential support with the CAP. Brussels.
[1] The latter corresponds to a set of basic standards, GAEC, Good Agricultural Environmental Conditions, and SMR, Regulatory Management Requirements, which farmers receiving CAP support must respect (COMAGRI, 2019).
[2] Agri-environmental and climate commitments are payments per hectare or per head, based on the implementation of environmentalpractices over several years (COMAGRI, 2019).
[3] Term encompassing plant protection products (mainly herbicides, fungicides and insecticides) and biocides (Bourguignon, 2017).