Options to avoid a brutal crisis in the event of a no-deal Brexit

Brussels, 6thFebruary 2019


As the Brexit date of 29thMarch is fast approaching without a clear prospect of an orderly exit deal, the worst case scenario of a no-deal Brexit is becoming ever more likely.

Although an agreement is still possible and highly desirable, the political stalemate around the apparently intractable issue of the “backstop”, to guarantee that no hard border comes back to the island of Ireland, increases the probability of a no-deal.

We have said it time and time again, a no-deal means disaster for the UK and for the EU agri-food sector as well. We have consistently warned our Members and readers that a no-deal hard Brexit was a distinct possibility to reckon with.

Reverting on the 30thMarch to applying the WTO tariffs to the trade between the EU27 and the UK would disrupt the current trade flows on a number of key sectors and send shock-waves across the farming communities and the food sector in the EU.

High tariff barriers would be put in place along new burdensome procedures at the borders, which would worsen the impact on trade.

The brutal disruption of trade flows would also affect other economic sectors, as the integration of production systems in many industrial areas, including in pharmaceuticals, is high across the Channel.

The EU and the UK face shortages of key products, including food, medicines and industrial goods.

Rather than contemplating with horror what would happen, we have better work-out what options remain open in the event a no-deal hard Brexit becomes the new reality.

The first option is to reduce key tariffs to zero to keep the trade flowing. This could be done by temporarily suspending existing tariffs for all WTO members, including of course the UK.

This is however not an option that would preserve our agri-food sector from a brutal crisis. To keep trade flows from the UK open, we would sacrifice our sector to imports from other origins without any reciprocity. This would just replace a big problem by an even bigger one.

There is however another option, that would maintain the status-quo with the UK for a period of time long enough to enable new mutually beneficial relations to be agreed.

The disruption of trade flows would put at risk the availability of food, medicines and other products essential to the economy and for the well-being of the citizens. It would beyond reasonable doubt create a situation of emergency that should be avoided at any cost. It would challenge for a period of time the security of the countries affected.

Under WTO rules it is possible to evoke GATT Art XXI, which allows a country to “…taking any action which it considers necessary for the protection of its essential security interests” “… taken in time of waror other emergency in international relations”.

Art XXI could therefore be used for a limited period of time to keep existing trade flows till an agreement is found on the future EU-UK relationship. It would not reduce or impair the existing terms of trade with all the other members of WTO. It would not raise tariff protections, it would not impose bans on trade with other countries. It would only, for a limited period of time, maintain the existing terms of trade between the EU and the UK.

During this period of time the EU and the UK would keep its customs union untouched, which means by the way that the UK could not have the freedom to apply trade deals with other countries.

Recently Art XXI has been evoked by the US to protect its steel and aluminum industries, by the UAE to block trade with Qatar, and Qatar with the UAE. These situations hardly match the real emergency the EU and the UK would face in the event of a no-deal hard Brexit.

In the past, Art XXI was also evoked by the US on imposing a secondary embargo on Cuba, and an embargo on Nicaragua. The EU has used it during the Falkland war to impose an embargo on Argentina.

In addition to evoking Art XXI, both the EU and the UK should agree on a standstill that would keep all the existing regulations, standards, and other procedures under the Single Market, till an agreement on the future relationship is found.

The stakes are too high to accept failure for lack of action, where previously lack of political agreement brought the UK and the EU to the brink of disaster, in particular in the agri-food sector.

Whilst we have strongly supported the Withdrawal and Transitional Agreements, and we would have hoped for its approval by the UK Parliament, we cannot resign ourselves to accepting a brutal crisis in the event of a no-deal when there are good options available to stave it off, and create the time and the space for a better outcome.

UTPs DIRECTIVE: EU INSTITUTIONS REACHED AN AGREEMENT TO PROTECT ACTORS OF THE FOOD SUPPLY CHAIN

At the end of a sixth and final trilogue procedure, the European Parliament and the Council, on December the 19th,reached an agreement on the Directive to combat Unfair Trade Practices in the agri and food supply chain. This is excellent news for all producers and companies in the sector, who have been waiting for a European regulation for more than 15 years, while many self-regulatory initiatives have so far failed to put an end to unfair practices.The news is all the better as the scope and the number of practices, very limited in the original Commission proposal, were extended during the discussions.

The agreement reached today will apply to any actor involved in the food supply chain with a turnover of up to 350 million euros – seven times the threshold originally proposed by the Commission – and differentiated levels of protection are provided below this threshold. The European Parliament’s desire to expand to all companies has not been retained. The new rules will apply to retailers, food processors, wholesalers, cooperatives or producer organizations, or a single producer who engages in any of the unfair trade practices identified.

Prohibited UTPs were initially limited to perishable products only (payment after 60 days). They have been extended to cover: late payments for perishable food products (payment after 30 days), cancellations of last-minute orders, unilateral or retroactive contract amendments, forcing the supplier to pay for wasted products and refusal of written contracts. Other practices will only be permitted if they are subject to a clear and unambiguous prior agreement: a buyer returning unsold food products to a supplier, a buyer charging a supplier to secure or maintain a food supply agreement, a paying provider for a promotional, advertising or marketing campaign of a buyer.

Member States will be able to extend the scope of the Directive into national legislation, in particular by adoptinga threshold of more than EUR 350 million, or take additional measures if they so wish. “This is a minimum harmonization, therefore the member states can, or should in my eyes go further to strengthen the device provided by this directive” Parliament’s rapporteur Paolo De Castro noted following the agreement.It will be up to them to designate the authorities responsible for enforcing the new rules, including the ability to impose fines and initiate investigations on the basis of complaints. Confidentiality may be requested by the parties filing a complaint to address concerns about possible retaliation.

The Commission will put in place a coordination mechanism between the supervisory authorities to enable the exchange of good practice.

The agreement also includes a review clause set at 4 years, which means that the provisions of the law will have to be evaluated and possibly revised during the next parliamentary term.

It must now be formally approved by Member States in the Special Committee on Agriculture, be submitted then to the plenary and once approved by the Parliament, it will have to be endorsed by the Council and finally transposed into national legislation.

A NEW US FARM BILL IN SHARP CONTRAST WITH THE NEW CAP PROPOSALS

The US Congress adopted a new 5-year Farm Bill that enhances the commodity programs and crop insurance tools previously available to US farmers, in a sharp contrast to the European Commission CAP proposals that drastically cut the budget and support to EU farmers.

The new US Farm Bill increases support across the board. It increases most loan rates for commodities like cereals (wheat, maize, rice, etc), oilseeds (soybeans), cotton, sugar and others like peas and lentils.  It opens up the possibility to increase the reference prices for the insurance program Price Loss Coverage and improves the Agriculture Risk Coverage calculated yields.

Last but not least it boosts the dairy revenue insurance by sharply reducing the premiums for the smallest producers – below on average 240 cows, yes 240 this is not an error, this reflects the size of dairy holdings in the US- and increasing the level of protection for all farmers amongst other improvements.

The new Farm Bill also increases resources for environmental protection, and for export promotion programs.

Thus, the number one competitor of EU farmers gets a significant boost from the State budget the moment when EU farmers face the opposite – a reduction of 12% in real terms of the CAP budget proposed by the Commission.

Two sides of the Atlantic, two different tales. The US Farm Bill is built around tools that do not fit the EU model and needs, but it is striking that the US increases support when the European Commission proposes sharp cuts even when the sector faces stagnant incomes and dire prospects for the future.

The US farmers will have an even more robust set of tools to improve their resilience to market shocks and climatic events, whilst the EU farmers who have little of it would in the future have even less according to Commission’s proposals.

The EU model has done away with countercyclical payments that compensate farmers when prices drop, which led in the past to waste and alienated the sector from market signals and export markets, which concentrates public support in most productive areas and farms, and it should not emulate the US model in that respect.

But the CAP has not provided sufficient resilience tools to absorb climatic and market shocks. We need more climatic and income insurance and mutual funds, we need a real and well-funded crisis management fund – but that will not happen without CAP support.

We also need to do more to protect at the same time the environment and to improve the economy of the sector, which suffers from lower to negative productivity, compromising the future of farmers incomes and the sustainability of the sector. That will not come either without well targeted CAP support on double performance investments.

Will this new US Farm Bill make the European Commission re-adjust its CAP proposals and funding? If not the current Commission, the next? Will it ring alarm bells in capitals all too willing to let farm support go down? Will it energize the European Parliament to raise in defense of the EU agriculture sector?

We can only hope so. Otherwise our future seems more compromised.

Digital Agriculture Platform

Digital Agriculture Platform

To accelerate the digitization of agricultural sectors: to know and make known

What – Context & Overview

The main challenges for the European agricultural sectors and the related public policies can be summarized as follow:

– Accompanying the transition of European agriculture and rural areas to meet the economic, environmental and climate challenges the European Union is facing, and

– responding to the imperatives of food safety & sovereignty.

In this context, the environmental and economic performance of agricultural sectors are two sides of the same coin. Greater environmental performance cannot be achieved if the competitiveness of Europe’s agricultural sectors declines. Increasing sustainability requires more profitable economic sectors, able to invest in environmental actions, to bear the cost while earning a living in today’s open world.

Therefore, it is time to think of a “new agriculture” which considers the past, its mistakes and its achievements. A considerable body of agronomic knowledge and innovations in digital can be mobilized to work for the economic and environmental performance of farms, and to the benefit of citizens, farmers and consumers.

At the same time, large scale adoption of smart farming is a catalyst for the convergence of all EU agricultures, allowing for farmers that lag behind in terms of competitiveness to catch up at a very rapid pace with their more advanced colleagues, thus allowing for a fair development of EU agriculture as a whole.

To ensure the full success of such a digital evolution, we should:

demonstrate to both policy makers and economic actors the reality of this evolution, in other words assessing and highlighting the concrete economic and environmental contributions it generates;

convince that encouraging this transition is more effective than reflecting on future actions by thinking only at the past;

provide as many farmers as possible with access to these tools.

Encouraging agricultural value chains to make innovation on farms and to invest substantially in technical tools of dual performance, this requires not only convinced farmers, but also adequate political support and, at European level, a complementary mobilization of the European policies, with the aim to encourage these types of investments and to provide a favorable economic environment in highly volatile markets.

In that context and as time is pressing to demonstrate the importance for decision makers and stakeholders to get fully involved in the transition of the EU agricultures to agricultures of dual performance, it seemed appropriate the set up within Farm Europe of a Digital Agriculture Platform bringing together players from the agricultural and digital sectors who share a common vision of a digitization of the agricultural sectors in Europe which is: inclusive, centered around the needs of farmers, and in constant interaction with them.

Why – Aim, Vision

This platform aims to bring together agricultural sectors and operators sharing both the need to make the digital shift and lead this change to meet the needs of farmers, and in full interaction with them.

The Digital Agriculture Platform is about sharing experiences and highlighting the benefits of this change. Today, experiments & pilot activities are being conducted in different sectors, without bringing together the relevant common elements, and therefore allowing to give form to the positive intentions of policy makers in favor of the uptake of innovative and digital models.

Such an approach may be of particular interest as the economic and political challenge of dual performance is already part of the EU policy environment.

At the core of the Digital Agriculture Platform there is the aim to make the digitization of agriculture the political priority for the months and years to come.

1) Digital Transformation of EU agriculture: a “new agriculture” needed to tackle the pressing economic, environmental & climatic challenges & allow for the convergence of all EU agricultures;

Smart farming is a farming management concept which exploits digital technology means to monitor farming resources and optimize the application of agricultural inputs and practices in the farming process.

(Key words: paradigm shift, new agriculture, double performance, convergence)

2) Smart Farming: a valid solution for all farmers, all sectors & all types of farming across the EU as from today and not in a distant future;

Smart farming refers to a decision-making process that is not defined but can be optimized by the use of technology – namely by the combined use of data & knowledge coming from different devices & sources.
This process heavily involves the human factor: the farmer is placed at the center, being facilitated and accompanied all along the way by advisors who act as innovation brokers connecting him/her with an ecosystem of devices producing data and experts, generating, sharing and using knowledge.

(Key words: needs-based business models, low barriers to entry)

3) Promoting Smart Farming approaches that are holistic, inclusive & human- centered and allow for the development of a new culture of agricultural entrepreneurship based on informed decisions;

Smart Farming not only produces data, it equally generates a new culture of entrepreneurship: the farmer is not a passive consumer of expensive inputs that produces cheap products. He can make informed choices and business decisions based on the knowledge input: that is on data, scientific advice and market information.

(Key words: decision making process, ecosystem of devices & experts, knowledge input, new culture of agricultural entrepreneurship)

How – Work Programme & Activities

As a body of the think tank Farm Europe, the Digital Agriculture Platform offers the opportunity to reflect upon and to strengthen the means of action offered to its members on digitisation of EU farming sectors as well as on issues which go beyond or are interlinked. It provides a rich environment generated by members of varied backgrounds, all driven by a shared desire to better integrate competitiveness and environment as true principles of sustainable development.

The Digital Agriculture Platform is a place to build recommendations and proposals for policy-makers, with the objective of achieving a strong European vision for the agricultural sectors, of offering solutions, and indicating possible ways to build effective policies, able to unlock the vast potential of the European agri-food systems.

This platform will organize its activities on the basis of the following principles:

1. Share of experiences & best practices with a “multi-actor” approach (farmers, researchers, agronomists, industry), with the guarantee of full confidentiality of specific results and data that the Digital Agriculture Platform will be provided with by its members and other organisms;

2. Promoting active collaboration among participants (IT/Research-to-farmer networks);

3. Identification of factors/elements influencing the actual implementation according to sectorial and/or local specificities and addressing them;

4. Developing own thematic analyses and studies, by its own and in association with members, feeding the work of the whole platform;

  1. Monthly exchanges to assess results and technical developments, considering both the economic, social and environmental aspects;
  2. Promotion of the approach of “digitizing European agriculture as an adequate vector to allow agricultural sectors to converge and to achieve a double performance – economic & environmental”;
  3. Development of proposals and actions in both the legislative and communication fields, notably in the context of the CAP post 2020 proposal.

Target audience:

  •   EU & NATIONAL DECISION MAKERSCommunicating:
    • –  Raising awareness among decision-makers by organizing meetings/events/publishing reports;
    • –  Monitoring developments in both agriculture and digital policy and analyzing them from the point of view of users.
  •   EU PRODUCERSDisseminating:

– Networking & raising awareness among farming sectors/organizations across the EU by organizing meetings/events/publishing reports.

Coordinating pilot projects on the ground:

– Encouraging, coordinating and overseeing the development of sectorial pilot projects that both enable the dissemination of smart farming practices and showcase its benefits with concrete results.

An initial project has marked the launch of the Digital Agriculture Platform as a first concrete example: the New Viticulture Project. Launched in 2018 by Farm Europe and its Wine institute, this project already involves farmers, cooperatives and IT actors from three different countries. The step-by-step implementation of this project will demonstrate concretely the benefits of digitization of the wine sector, the multi- dimensional consequences of innovations and it will allow for proposing an efficient and balanced way of digitizing EU farming sectors.

The Digital Agriculture Platform aims at gathering experiences and pilot projects in each agricultural sector, and at working on indicators and milestones and at collecting all relevant results and data (under confidentiality clause as necessary) to evaluate the outcomes and benefits of the digitisation of agricultural sectors in each case and finally to promote digitisation with very concrete reasoning.

The Digital Agriculture Platform does not promote a specific model of digitisation of EU farming sectors. It promotes the transition of EU agricultures to digital/smart farming practices, each sector, each farmer having the responsibility to define and choose the best way according to their specificities, while being fully aware of the benefits and implications of digitizing their systems.

Who – People

Members of the platform are organizations and companies sharing the same ambition of sustainable growth, and willing to prepare the ground proactively for the transition of their members to economically and environmentally more performant agricultural systems. Members of the Digital Agriculture Platform are multisectorial, from several Member States, representing farming sectors, collecting and processing companies, companies providing solutions to the agri-food systems, extension services providers, research institutes. The platform is chaired by one of the members of Farm Europe for whom digitalization is of specific importance;

Coordinators of the members of the Digital Agriculture in charge of the relation with the Platform and ensuring a deep involvement of each members;

A multi-cultural staff under the responsibility of Yves Madre and Luc Vernet, mobilizing experts in digital, in agriculture and European policies.

Digital Agriculture Platform

The Digital Agriculture Platform dedicates its work to the transition of EU agricultural sectors to dual economic and environmental performance.

It is an independent, engaged, and creative place, which contributes with its ideas to the debate through the work of its team, its publications, its events, and the work of its members.

As a body of the think tank Farm Europe, the Digital Agriculture Platform does not have a political orientation. It aims to catalyse the thinking of all of its members. It has a multicultural team of recognised experts. It is open to a wide variety of members who wish to participate in the discussions, to brainstorm ideas, and to find a platform to give visibility to their views.

The actions of the Digital Agriculture Platform:

  • Reports, nourished by members of the think tank and the team;
  • Small working groups to allow the free exchange of ideas;
  • Public events focusing on the issues in the agri-food sectors at national, EU and global level;
  • Access to the work and main events of the think tank.

For more information, contact us at: digagriplatform@farm-europe.eu

page8image56875936page8image56877184page8image56877600page8image56875312page8image56879472page8image56875728page8image56876144page8image56874064page8image56694464page8image56696960page8image56697376page8image56694048page8image56691760page8image56702160page8image56702576page8image56702992page8image56703408page8image56703824


Digital Agriculture Platform 1st Meeting

26 & 27 November 2018, Hérault (France)

PROGRAMME

Wine Institute Meeting: Work program, Members Arrival of the participants

Lunch on the site of Pomérols – Vignerons de Beauvignac

Meeting & Launching of the Digital Agriculture Platform – Wine Institute

  • –  Values, objectives and structure
  • –  Communication activities
  • –  Round-tableCoffee Break

    Discussion on the digital viticulture project

  • –  Objectives & Milestones
  • –  Presentation by each participant
  • –  Action planDinner

    On the spot visit of Mas Digital

    Bilateral meetings between participants
    Lunch on the site of Pomérols – Vignerons de Beauvignac Departure – Airports


DigitalAgriculturePlatform

page9image56632256page9image58911808page9image58909696page9image58879040page9image58873280page9image58873856

Farm Europe – Rond-Point Schuman, 9 – 1040 Brussels – BELGIUM

www.farm-europe.eu – info@farm-europe.eu


©2018 Farm Europe

Establishment of a EUROPEAN FUND FOR THE MANAGEMENT OF CRISES IN AGRICULTURE

 POLICY PAPER 

November 2018


The CAP includes some provisions aimed at combating the crises that all too often strike the agricultural sectors.

Direct payments are a first layer of income stabilization, but they are not designed to respond to a sudden large-scale crisis, be it climate or market.

Since 2013, the CAP has also provided support for climate insurance and income stabilization instruments. It has to be said that their implementation has been very modest and uneven within the European Union. In the current budgetary framework only 380 million € a year is mobilized by the CAP to support risk management tools; ie less than 1% of the budget.

In 2018, the severe drought in many parts of Europe has shown how weak the sector is and how poorly prepared it is to deal with these extreme climatic events that are expected to increase. In a context where private insurance schemes remain rare, farmers are at the mercy of events and the willingness of national governments to provide exceptional assistance.

Once again in 2018, the drought was managed in a scattered order with state aid varying from country to country according to the intensity of the crisis, but also according to the budgetary capacity of the authorities and the media visibility of events – creating distortions of treatment between European farmers and a lack of objectivity in risk coverage. In total, some 800 million euros in emergency aid have been announced, mainly in Germany, Sweden, Poland, Finland and Ireland.

The dairy crisis of 2015/16 had for its part shown the extreme vulnerability of farms in the face of abrupt and profound market jumps, profoundly affecting farm margins and their ability to continue to project themselves.

Although a number of recent improvements have been introduced at EU level with the Omnibus Financial Package, the Commission’s proposals for the future do not seem up to the task of building an effective system of:

– risk management based on previous achievements

– and serious crisis management, essential relay for a development of the risk management at the initiative economic sectors in case of medium-sized risk.

To cope with severe crises in agriculture, the remaining provisions for public intervention are not likely to meet the challenges. Neither the provisions on private storage nor the trigger levels of public procurement have provided an adequate level of response in recent market crises – the 2009 and 2016 dairy crises, the 2011 fruit and vegetable crisis or the Russian embargo.

The current CAP also opens up the possibility of specific ad hoc interventions in the event of a crisis. The lack of structuring of these possible interventions, the absence of a guarantee of funding and action, and the lack of transparency on the way in which the EU is supposed to act make it a device at best uncertain, at worst lacunar. The crisis reserve suffers from having neither a clear mission nor an adequate mode and level of funding. Moreover, despite the numerous crises since its creation, which could have justified its use, the Commission has never proposed its activation.

This fuzzy framework of crisis management has two consequences:

– a wait-and-see attitude to hope that the public authorities will find exceptional financing; – without any assurance of their level of commitment to the situations encountered – which goes against the establishment of a solid management of risks and crises,

– a high degree of uncertainty and risk for agricultural sectors which limit their ability to invest.

The CAP therefore looks like a big building without a roof. Foundations (income aids), aisles and rooms (risk management tools, investment support) are carefully built, but in case of crisis, the building takes the water from the roof, endangering its own foundations.

In the absence of clearly managed crisis management at the community level, risk management tools are struggling to take off given the systemic risks to their long-term sustainability or their ability to ensure a consistent level of coverage over time.

The time has come to change this and provide the CAP with an adequate roof. The discussion on the new CAP offers us a unique opportunity to complete our common home, with the creation of a roof naturally consolidating the foundations and walls of the building by clarifying their role.


Screenshot 2018-11-27 at 16.35.53

Figure 1: CAP Crisis Management Policy


By building on the decisions taken by European co-legislators to strengthen the private risk management tools co-financed by the CAP during the Financial Omnibus, the CAP reform must therefore:

– reinforce these risk management tools by increasing their attractiveness for farmers in order to offer effective response possibilities for average risk levels,

– to found a European device to take over these devices in case of deep crises. Such a scheme – the European Crisis Management Fund for Agriculture – is intended to provide secondary support after the action of risk management tools. It must be triggered on the basis of objective crisis level indicators valid for the entire European Union.

– build coherent and transparent risk and crisis management that encourages operators to react without delay to market signals and ban the delays inherent in the expectations and hopes of hypothetical interventions by the European Union and / or the national public authorities, often implemented with high deadlines.

In concrete terms, a European Crisis Management Fund in agriculture, financed by a multi-year crisis reserve and adequately equipped, should have the following missions:

  • Act in partial reinsurance of private climatic insurance that meets the conditions set out in Article 70 of the Commission’s reform proposal (CAP Strategic Plans Regulation).This measure would help to provide such climatic insurance to farmers, reduce insurance premiums while the rate of coverage in the European Union remains too low.
  • Provide second-rate support to farmers in case of market crises by taking over the income stabilization tools beyond a predefined crisis level.It will be a question of covering the part of the disbursements that these funds should operate without which these sectorial IST will not be able to survive a deep crisis of the market. Access to this second-tier aid could be open to non-IST producers, since no public aid would be allowed to substitute, even partially, with the help that ISTs would provide to their IST members. The aid released by the crisis fund, in the event of a serious crisis, would be released at European level, placing all European farmers on an equal footing. In addition, farmers covered by ISTs, such as farmers who are not, would have visibility to the ability of governments to respond to crises with predictable levels of emergency assistance. A farmer would thus knowingly do, depending on the level of risk associated with his production and investments, the choice to cover himself or not, being in the first case assured of triggering his IST and any additional contingency funds and for the second with only the second part, namely the emergency funds.
  • Create a framework for rapid interventions through exceptional market measures in the event of a crisis with a view to minimizing the effects,acting quickly to rebalance market conditions. This level of action would be discussed immediately as market disruption signals trigger the risk management tools. Depending on the situation and the need, the managing authorities would be able to intervene through ad hoc tools.

The costs of managing such a fund would be minimal, since its interventions would be anchored on the risk management tools recognized under Article 70 of the draft Strategic Plan Regulation and Article 36 of the CAP currently in force. These tools are controlled by the payment services of each country, which are audited by auditors from the European Court of Auditors and audited by the Community level.

Criteria for triggering compensation by the Crisis Management Fund for point 1 (partial reinsurance of climate insurance) and point 2 (support provided in the wake of IST triggering) would be objectively predefined at the level of the European Union:

– a ratio of 170% of indemnities to be paid/premiums paid for climatic hazards (which corresponds to a crisis recurrence of one year out of 60), the commitment of the fund being capped at a value of 230% for this same ratio (risk frequency of one year out of 100),

– recurrence of market crises beyond which the crisis is described as major and triggers the crisis management fund in agriculture.

This threshold of recurrence of market crises will have to be determined by sector at a European level. For the dairy sector, based on the analysis of operating margins and on the basis of an econometric simulation, a 12-year recurrence appears as an economic indicator of a transition to a state of major market crisis. These thresholds defined at European level would ensure the activation of the fund when needed and in the regions concerned when the crisis does not uniformly affect a given sector throughout the European Union. As this frequency of risk is defined for the whole of the Union, there will therefore be fairness between the Member States without distortion of the market on the internal market.Thanks to these indicators triggering the European Crisis Management Fund in Agriculture, the response to a serious crisis would be predictable, rapid and thus limit the scope of the crisis and prevent bankruptcies of farms. The level of stress linked to the economic risk weighing on farmers would thus be reduced as soon as the public interventions were carried out within a clear, predictable framework, defined beforehand, which would not only be beneficial from the point of view of social sustainability and the attractiveness of the farming profession, but also in terms of investment, which is necessary, in particular, to achieve the Union’s sustainable development objectives.

Regarding the dairy sector, the selected crisis level threshold (12-year recurrence) would have triggered intervention during the 2009 and 2016 dairy crises. This triggering scheme for the crisis management fund would be applicable to all sectors. The compensation paid by the fund would not be reserved solely for farmers who have subscribed to an income stabilization tool, but would benefit all farms in the country and the industry where the triggering threshold has been exceeded. Farmers who participated in a fund would benefit from the risk management fund and additional emergency assistance associated with the crisis management fund. Operators having opted not to subscribe to an income stabilization tool would still benefit from the help of the emergency fund but would obviously not have the risk coverage of the pooling tool. This would be an economic choice for each farmer, depending on the resilience of his farm. Figure 2 summarizes the use of the Crisis Management Fund in Agriculture in the case of relay of farm income stabilization instruments.

Screenshot 2018-11-27 at 16.07.13

Figure 2: Graph of the use of the European crisis management intervention fund in agriculture in the case of the agricultural income stabilization instruments relay for the dairy sector

It should be noted that the modeling carried out (see the Farm Europe technical note “Implementation of a European Crisis Management Fund for Agriculture”) results in an estimate of a total annual amount of public subsidy of € 420 million(2nd pillar CAP co-financing of 70%) for ISTs that would cover 70% of EU milk production.

The crisis management fund would intervene when IST compensation exceeds that of a risk with a frequency of one year out of 12 within the limit of a risk of one year out of 40.

Impact of this proposal for a milk producer in Germany:

This simulation is built under the assumption of the establishment of ISTs in the dairy sector in Germany, integrating only the milk component of the farms concerned. Given the characteristics of dairy farms in this country, three typical zones emerge that could encourage the constitution of specific ISTs.

Under the assumption of common IST criteria, with a deductible of 30% applying to it:

– such an IST would have intervened in support of dairy producers in 2009, 2015 and 2016 for aids paid of approximately 42 €/T in 2009, 19 €/T in 2015 and 29 €/T in 2016.

– The proposed European crisis management fund would then have covered part of these aid payments, up to € 17/t in 2009 and € 4/t in 2016.

– The annual contribution that the producers would have had to pay for this IST being, for its part, at 1.55 €/t (excluding management costs of the IST fund).


For climatic risks, the fund would make it possible to put an end to the ad hoc financial interventions decided in the emergency by certain Member States (according to their financial means and their political attentions) in the event of climate disasters. The fund would not be intended to take the role of reinsurers, but to reduce the overall cost of crop insurance by reducing the cost of reinsurance (cost reported in insurance premiums paid by farmers) and to promote the development of this tool throughout the European Union.

To ensure rigor and share the costs of reinsurance between public and private, access would be restricted provided that half of the compensation paid is derived from private funds (insurance or reinsurance). Figure 3 summarizes the use of the Crisis Management Fund in agriculture in the case of climate insurance reinsurance.

Screenshot 2018-11-29 at 11.31.35

Figure 3: Graphical representation of the use of the European crisis management intervention fund in agriculture in the case of climate insurance reinsurance


To cover 70% of European production in the cereals, industrial crops, potatoes, wine and fodder sectors, the total amount of CAP co-financing at 70% of insurance premiums would then amount to EUR 3 847 million a year.

The European Crisis Fund would then act in partial reinsurance for events of frequencies between 1/60 and 1/100. The pooling of this reinsurance risk at European level limiting the precautionary financial amounts to be put in place.


Average loss levels by crop type likely to trigger climatic hazard reinsurance by the crisis fund (Germany or France type ocean area)

Cereals: 27%               Industrial crops: 27%

Potatoes: 28%                         Vines: 31%                  Fodder plants: 33%


By building these methods of intervention of the European Agricultural Crisis Management Fund, any risk of windfall effects is eliminated:

  • in the case of intervention in response to severe climatic hazards, the fund would take over the weather insurance only for a level of serious hazards, so clearly after the normal triggering of compensations borne entirely by private insurers. This second relay action, and for only 50% of the share of the reinsurance systems for hazard levels between 170% and 230% of the ratio of compensation to pay/premium paid, excludes any risk of deadweight effect and distortion of the device.
  • in the case of intervention in response to strong market risks by releasing ISTs for recurrence crises greater than a fixed level, this device will not encourage any irresponsible individual risk-taking behavior, because only intervenes in addition to the ISTs tools set up by sectors and whose parameters have been validated by the Member States and by no means in substitution. In addition, such a system must prohibit any public aid that would replace the compensation paid by the ISTs for farmers who have chosen not to adhere to an IST. Conversely, second-tier support from the mutual fund could be provided to both IST and non-IST farmers in the region and the industry in crisis.
  • With regard to the exceptional market measures that could be decided on the basis of the voluntary milk production reduction measure set up in 2016, they must aim at rebalancing the supply/demand levels and in no way bring about an additional support to income without counterpart, which would then undermine the private risk management tools reinforced by the Financial Omnibus and confirmed in Article 70 of the proposal for a Regulation on National Strategic Plans.

Note on the compatibility of the proposed measure with the EU’s WTO commitments, the fund meets WTO green box rules for 30% deductible and compensation of up to 70% losses and for other measures is exempted from the reduction commitments of the orange box (or AMS).

The fund should have a capital of EUR 1.7 billion, which would make it possible to deal with crisis situations that may arise in different agricultural sectors and to finance adequately linked actions. This allocation may be envisaged either on the first day of the creation of the fund by decision of the Heads of State and Government in the framework of the discussions on the European Financial Framework 2021-2028 or failing that, progressively between 2021 and 2023.

Since the fund would be solicited, it would be replenished in the following year or years at the rate of € 400 million per year and within the limit of a total amount of the fund of € 1.7 billion.

This level compares favorably with the € 2.8 billion that the EU has spent to deal with only the dairy crisis. If this fund had been operational, the expenses would have been much lower.

This amount of € 1.7 billion was established in the light of the experience of past crises and the actions that would have been financed if such a fund had existed, taking into account that:

– climatic crises are more systemic in nature when they occur

– if market crises may exist in a single period in several sectors, the probability that all agricultural sectors will be affected at the same time is statistically low.

Therefore, it seems relevant and sufficiently secure that the fund has in reserve the equivalent of 4 years of action – while the risk of a continued continuation of such crises is low – due to:

– Reinsurance of climate insurance (annual precautionary allocation of 150 M €/year to the crisis management fund),

– Takeover of agricultural income stabilization instruments (annual precautionary allocation of 135 M €/year to the crisis management fund)

– Rebalancing supply/demand measures (annual precautionary allocation of 130 M €/year to the crisis management fund)

– with an additional 5 million €/year to finance the communication tools on risk management tools, research and development on risks in agriculture in Europe.

Solidarity and mutualisation allow economic efficiency, which is a foundation of European agricultural policy as it was put forward when the CAP was created.


NB: In this scheme, traditional crisis measures such as public intervention and private storage aid should continue to be financed in addition to these credits, as they are now financed outside the crisis reserve. It should be noted, however, that the use of rebalancing measures (so with quick and targeted triggers) would significantly reduce the need for a public storage policy.

POLICY BRIEFING EU budget & the CAP 2021-2027: understanding the Commission’s proposals

2018

On May 2, the European Commission proposed its budget orientations for the period 2021-2027 for the European Union and its policies. Since then, many analyzes and comments have been made, putting forward variable figures as to the real financial impact of these proposals for the CAP.

This note aims:

– to decipher these different analyzes which, if they are all mathematically exact, give very variable readings of the Commission’s proposals

– to highlight the actual economic impact of the said proposals on European agricultural sectors and on the incomes of European farmers.


  1. Presentation by the Commission: A rising budget for the EU27, a CAP budget in reduction of “only” 5%

The European Commission has presented its proposal as an ambitious budget to address new priorities and boost the European momentum.

At the same time, it appears that the proposed budget, expressed as a percentage of the EU27 GDP, is decreasing compared to the European actions currently financed in the 27 Member States. While the implementation of current EU policies in the EU27 now accounts for 1.16% of EU27 GDP, the budget for the coming period is proposed at 1.11% to finance both but also what is proposed as new priorities. So less money than the one currently used for existing European policies in the EU27 for more actions to be financed.

Therefore, the financing of the so-called new priorities proposed for the EU (defense, immigration, digital …) supposes in the Commission’s plan to ask the existing policies to cut their budgets both to compensate for the departure of the British net contributor and to fund the proposed new policies. This is the case for the CAP for which the Commission proposes a decrease of 19.6 billion in current euros over the period, plus a loss in real annual value of the amount of inflation, accentuating the erosion initiated since the 2000s of the CAP budget in the European budget.


– While the Commission’s budget proposal increases by 2% (theoretical inflation rate) per year the national contributions that Member States will have to pay to the EU budget,

– While the production costs of the agricultural and agri-food sectors will most likely follow the evolution of inflation in the EU27,

the expression of the evolution of the CAP budget in current euros does not make it possible to give a real and objective reading of the economic impact of the proposals presented on the European agricultural and agri-food sector.


II-        Analysis conducted by the European Parliament: comparison of the two budget periods reported in euros 2018.

By choosing to compare the Community funding allocated to the different policies in 2018 euros for the period 2014-2020 and for 2021-2027, the European Parliament points out a difference, for the current heading 2 (mainly the CAP), of -21% between the two periods, the Commission’s proposal for the coming period then being less than € 90 billion 2018.

It should be noted that a 2014-2020 budget expressed in 2018 euros results in a larger amount (number of euros) than the decision of the Heads of State and Government in 2013, which decided to maintain the CAP budget in current euros only.

At the same time, expressing the Commission’s budget proposal for the period 2021-2027 in 2018 euros leads to the inclusion of the lack caused by the non-indexation on the inflation rate for the years 2019 and 2020 even though it can not be imagined to modify the decision taken in 2013. Consequently, in view of the decisions taken and accepted in 2013 for the period up to 2020, the expression of the 2021-2027 budget in 2018 euros increases the lack of the CAP budget proposed by the Commission for the period. And to be noted that what is linked to non-indexation on inflation from 2018 has a cumulative effect (by multiplying each year by a factor of 1.02) in the end of the period 2027.


III –     Analysis of the Bruegel Institute: comparison of the 2014-2020 CAP budget expressed in current euros and the 2021-2027 proposal expressed in 2018 euros.

Through its analysis comparing the 2014-2020 CAP budget expressed in current euros (strictly taking into account the 2013 European Council decision) with a 2021-2027 budget translated into 2018 euros, the Bruegel Institute concludes a lower Commission proposal of -15% than what would have been necessary to keep the CAP budget at its previous level expressed in 2018 euros, thus to maintain this budget in value (real terms) 2018, lack decomposing for the 1st pillar by a lack of -13 % and the second pillar by a lack of -23%.

This analysis leads to the calculation of what should have been the Commission’s proposal to maintain the value of the previous CAP budget in real terms in 2018. Consequently, it is dispensing with the decision of the European Council of a non-indexed CAP inflation until the end of 2020 and returns to calculate the shortfall compared to a CAP budget which would be indexed to inflation not only during the entire period 2021-2027 but also from 2019 and 2020 at a rate of 2% per year, an increase of a factor of 1.0404 compared to a budget maintained in real terms only over the period 2021-2027.


IV –     Comparison between the level of CAP aid (CAP budget) 2020, aid paid to the United Kingdom excluded, and Commission’s proposal for 2021-2027: determination of the lack in relation to an objective of maintaining the CAP budget for the EU27 in real value 2020 (euros2020).

Considering that the decision taken in 2013 by the European Council will not be called into question for the period 2013-2020, the comparison of the levels of CAP budgets proposed by the Commission for the years 2021 to 2027 must then be made with the level of the last year of the current budget period: 2020. This year includes the consequences of all the decisions taken in 2013.

For the EU27, excluding CAP aid to the UK, the 2020 CAP budget is € 56.6 billion, with € 41.35 billion for the first pillar and € 15.3 billion for the second pillar.

Maintaining for EU27 farmers this 2020 level of CAP support for each of the years from 2021 to 2027 would entail increasing the 2020 amounts by 2% (inflation rate used by the Commission to determine the evolution of national contributions EU budget) per year, from one year to the next.

The table below shows (in bold) the amounts that are missing each year from the Commission’s proposal, for each pillar, to make up the difference between the Commission’s said proposal and a target to maintain the CAP budget in real terms at the level of the year 2020.

In total, the Commission’s proposal is 12% lower than it would be to meet this target, due to a shortfall of -9.56% (27.37 billion euros over the period 2021-27) for the 1st pillar and a lack of -21% (€ 16.23 billion over the period) in the 2nd pillar.

Farm Europe, May 2018

These rates take into account the entire period. It should be borne in mind that due to the non-compensation of inflation in the Commission proposal, the situation is deteriorating from year to year, the difference reaching for the year 2027 a -14,85 % for the 1st pillar of the CAP.

The Commission’s proposal would have a substantial impact on the evolution of farm incomes in the Member States because of this significant lack of funding as CAP aids represent on average 46% of agricultural incomes in the EU.

These revenues would be reduced by the mere fact of the proposed evolution of the agricultural budget (thus excluding the impact of the CAP reform that will be presented at the beginning of June ; the impact of the CAP reform that will be proposed is evaluated in addition, with a constant CAP budget, by the Commission services between – 8% and – 10% minimum income for European farmers) of:


Impact of the Commission’s PAC budget proposal on the evolution of average farm incomes Evolution of average incomes over the period 2021-2027 (%) Impact on average agricultural income for the year 2027 (%)
Belgium -5,45 -7,48
Bulgaria -4,71 -6,46
CZ Republic -13,27 -18,19
Danemark -26,91 -36,89
Germany -7,07 -9,69
Estonia -5,83 -7,99
Irland -7,44 -10,2
Greece -5,21 -7,14
Spain -3,10 -4,25
France -6,32 -8,67
Croatia -1,86 -2,55
Italy -3,59 -4,93
Cyprus -2,32 -3,06
Latvia -5,33 -7,31
Lituania -7,32 -10,03
Luxembourg -10,29 -14,11
Hungary -6,07 -8,33
Malta -0,74 -1,02
Netherlands -3,35 -4,59
Autria -4,71 -6,46
Poland -3,47 -4,76
Portugal -4,96 -6,80
Roumania -2,73 -3,74
Slovenia -3,59 -4,93
Slovakia -60,76 -83,30
Finland -6,69 -9,18
Sweden -10,91 -14,96
EU27 -8,31 -11,39

Farm Europe – May2018 – Assessment of the impact on the evolution of European farm incomes of the Commission’s proposal for a CAP budget

Annex: European Commission tables – communication on the 2021-2027 budget

European Commission


BREXIT AND TRADE NEGOTIATIONS A PERFECT STORM TAKING SHAPE

 I – BREXIT

Brexit has been a top issue of every Global Food Forum. The paper circulated last year for discussion started by stating that “The political shock of Brexit has yet to be translated in actual economic and commercial terms, but the clock is already ticking”.

The clock has moved on and Brexit is now around the corner, it will happen in 6 months’ time. What is the state of the negotiations? Which are the likely prospects? Which are the consequences of the most likely outcomes for the key agri-food sectors in the EU?

We are at a stage where though we are only a few months away from Brexit, we still have more questions than answers. As a matter of fact the only practical certainty is that on 29th March 2019 the UK will no longer be a member of the EU. A total reversal of Brexit does not square with the current political landscape in the UK, and time is running short.

The level of uncertainty at this stage is staggering. There is no clarity on the shape of the post-Brexit relationship between the EU27 and the UK. The status of the border in Ireland has been a major stumbling block, and no clear acceptable solution has been found so far. The political situation in the UK only adds to the uncertainty on the outcome of the negotiations.

Notwithstanding there are many who believe the EU and the UK will find a “way-out” of the current mess that will protect economic interests in both sides. The preliminary understanding to extend the participation of the UK in the single market till end 2020 adds to a (dangerous) perception that probably nothing fundamental will change.

To examine in more depth were we really are it is useful to start by realizing that Brexit should be seen as a process, rather than a single event.

That process has evolved in the last year. There was an understanding that enabled the EU to accept engaging in negotiations on the future of the relationship, including its trade terms. As said above one of the elements of that understanding was the maintenance of the UK in the single market till end 2020, to give more time for a global solution to be found that avoids the return to a hard border in Ireland.

Not much more has been achieved. Even the understanding on the crucial issue of avoiding a hard border in Ireland is little more than a fudge, as it is not feasible under the terms expressed in the understanding. Sill that fudge has opened the door for negotiations on the future relationship to start, and that in itself was a positive move.

The problem is that the negotiations have not moved substantially since then. The UK accepts that a hard Irish border should be avoided. But the UK does not want to replace a hard border between the Republic of Ireland and Northern Ireland, by a hard border between Northern Ireland and the rest of the UK. If the UK, as is its current Government position, does not want to stay in the single market, nor in the customs union, with all its obligations, there is no practical solution that has been offered that would square the circle between being out and not having a hard border with the EU. How would the flow of goods from third countries be controlled if they could freely cross the border from Northern Ireland? How would the EU tariff border protection and the conformity with EU standards and regulations be enforced? By the UK under delegation from the EU? Which guarantees would the EU have in particular if the UK would no longer accept the jurisdiction of the European Courts?

The inescapable conclusion is that there is no model in sight that would avoid a hard border other than the UK staying in the single market. The UK might accept to extend the transitional period beyond end 2020, but stretching that date too much would face a powerful backlash from those who do not accept to be out of the EU, but still subject to EU rules and contributing to the EU budget without a seat at the table.

Unsurprisingly the UK Government is pursuing intermediate outcomes that would protect her economic interests. One option put forward in July would be to stay in the single market, but only for goods thus excluding services, and still having the freedom to adopt free trade agreements with third countries. That option would avoid the need for a hard border, and keep the status quo as far as trade in goods is concerned. Those could be good news in particular for the EU agri-food sector as it would keep the current situation, the EU27 enjoying a healthy trade surplus with the UK. Not to mention all the other sectors where the EU27 has a positive trade balance, and those are clearly dominant.

The problem with that intermediate option from a trade viewpoint is twofold: first in many areas trade in services and trade in goods are inseparable; and second if the UK would adopt free trade agreements with the likes of the US, Australia, New Zealand, why not Mercosur, the competition for agri-food products in the UK market would dramatically change against our interests, and the EU market would be open to trade diversion and cheaper products imported into the UK. That might not be a big problem for other economic sectors that have low or no tariff protection, but would definitely be a big problem for the agri-food sector. We need to ask again: how would the flow of goods from third countries be controlled if they could freely cross the border from Northern Ireland? How would the EU tariff border protection and the conformity with EU standards and regulations be enforced? If by the UK under delegation from the EU, which guarantees would the EU have in particular if the UK would no longer accept the jurisdiction of the European Courts?

We need to be reminded again that we are a bare 6 months from Brexit actually happening. The lack of politically viable solutions is alarming. Whereas the understanding to keep the UK in the single market till end 2020 is no more than an understanding, dependent upon a formal agreement on the next 6 months to gain legal value, the possibility of a hard Brexit (with a hard border) is now higher than ever before but by no means the only possible outcome.

The consequences of a hard Brexit are so dear for the UK, and to some sectors in the EU – the agri-food sector first and foremost – that another possible outcome is to agree to extend the transitional period to give the time to both parties to reach an agreement for the future relationship. One would hope that with the UK already outside the EU the mindset of negotiators and the political climate would be more conducive to finding a solution, so elusive so far. In this scenario we would probably be back to negotiating the largest possible free trade agreement, which for the EU agri-food sector would be better than a hard Brexit but clearly much worse than the current situation – as the UK would also certainly strike free trade agreements  with some of the very competitive third countries mentioned above.

Anyhow prospects are not good. The next chapters deal with the Brexit impact on the key EU agri-food sectors – beef, pork, poultry, sheep and goat meat, dairy, sugar, wine – to illustrate and raise awareness to the challenges ahead.


General overview of current trade

60% of the agriculture and food products consumed in the UK are imported. And nearly 75% of these are coming from the EU.

Last year the EU27 exported over €38 billion worth of agri-food products to the UK, and imported only €16 billion – a trade surplus of €22 billion.

The UK is a major outlet for traditional agri-food export countries such as the Netherlands (€6.5 billion), Ireland (€5.4 billion), France (€5.4 billion) and Germany (€5.1 billion).

The agri-food sector in Spain (€3.8 billion), Italy (€3.1 billion), Belgium (€2.9 billion), Poland (€1.9 billion) and Denmark (€1.7 billion) are also exposed to Brexit with certain sectors facing serious risks.

A cautionary word is appropriate as the figures for The Netherlands and Belgium might reflect to a large extent the relevance of their ports, rather than domestic production. But that does not diminish the finding that many EU countries have substantial trade interests in the UK market.

Table 1: Overview of EU/UK agri-food trade in 2017 (Source: HMRC, UK Gov)

Dispatch from the UK (Euros2017) Arrival to the UK

(Euros2017)

Austria 89.801.177,28 262.319.627,65
Belgium 799.908.307,59 2.866.356.399,84
Bulgaria 68.551.981,72 65.547.096,60
Croatia 25.782.289,30 8.547.571,02
Cyprus 94.038.267,09 97.009.688,96
Czech Republic 146.960.068,62 168.623.918,42
Denmark 426.699.362,66 1.713.758.771,52
Estonia 30.412.539,19 11.302.386,59
Finland 138.577.822,80 43.705.468,73
France 2.734.523.101,07 5.379.809.291,58
Germany 1.643.250.247,51 5.118.324.966,07
Greece 153.158.103,85 356.268.112,87
Hungary 61.468.589,82 190.632.540,77
Irish Republic 4.599.262.510,30 5.395.789.091,28
Italy 663.652.013,60 3.127.815.529,79
Latvia 192.582.213,11 61.364.804,46
Lithuania 31.919.482,99 137.225.712,69
Luxembourg 9.631.353,29 8.723.322,67
Malta 68.539.359,97 4.080.038,00
Netherlands 1.873.114.189,49 6.541.486.997,90
Poland 442.847.817,00 1.930.722.826,51
Portugal 198.052.147,71 334.559.710,44
Romania 84.862.443,22 204.507.851,55
Slovakia 27.556.642,43 74.014.482,70
Slovenia 20.783.834,16 20.176.250,51
Spain 1.135.634.933,57 3.754.265.086,64
Sweden 398.067.072,15 508.952.955,02
Total €16.159.637.871,46  €38.385.890.500,78 


Sectorial overview of the EU-UK post- Brexit trade challenges


Meat products: a further chill for EU beef

It is clear that in the absence of a FTA with the UK the trade in meat products would collapse, as the fallback WTO tariffs are high enough to prevent any meaningful trade flows. Even if a FTA is in place the real game for the future of this trade is tied with the terms of the FTAs between the UK and the rest of the world. As mentioned above it is foreseeable that UK will negotiate FTAs with countries such as the US, Australia, Argentina, Brazil that would pave the way for a significant share of imports from these countries into the 65 million people British market. EU exporters will in the future have to compete with the most competitive meat producers in the world. It is therefore illusory to think they will keep their UK market share, on the contrary they should expect it to shrink significantly.

For meat products, the cascade effect of trade agreements between the UK and the rest of the world will have to be carefully addressed. Serious safeguards on future UK exports will be needed to avoid that a post-Brexit UK open to the global meat market does not lead to a de facto opening of the EU to the world market, by diverting the UK meat production to the EU market and satisfying UK’s consumption needs through imports.

Over €1 billion of EU beef meat products are routed to the UK every year, mostly from Ireland (€785 million). The trade surplus in favour of the EU27 is over €600 million. This is an additional sword of Damocles for the whole EU beef sector, which is already under pressure from the EU trade agenda while facing a structural crisis at the same time.

In addition, the upcoming UK FTAs with top world beef producers would have an indirect effect, by pushing Irish beef producers to find new outlets in the world market but also and primarily in the EU domestic market. The impact on prices, in particular on the more valuable cuts, would be devastating to the already fragile economic situation of the sector.

The EU27 enjoys even a higher surplus on the pig meat sector, over €800 million in 2017 for more than €1 billion of exports. Danish, German, Dutch and Irish pig producers will be the ones most affected. Brexit would come on the top of difficult conditions with Russia, leading to an enhanced dependence on exports to China.

To confirm that no meat sector would be spared, in poultry meat the EU27 exports over €1.2 billion to the UK, the trade surplus being even higher than for the other meats just shy of €900 million. The Netherlands and Poland are by far the biggest exporters.

In turn, the UK is expected to pay a special attention to the €440 million trade flow of sheep meat exported or re-exported, in particular in the context of its future new bilateral relations with the New Zealand. A very significant share of this trade flow is channeled to the French market (€200 million). New Zealand producers benefit from a 280 000 tons tariff free quota to the EU. They see the Brexit as an “opportunity in time of change”.


Table 2: Overview of EU/UK bovine trade in 2017 (Source: HMRC, UK Gov)

BEEF Dispatch from the UK

(Euros2017)

Arrival to the UK

(Euros2017)

Austria 1.456.827,66 5.727.297,42
Belgium 15.450.650,68 8.107.493,02
Bulgaria 4.368.956,32 56.768,17
Croatia
Cyprus 437.843,92 43.037,38
Czech Republic 2.706.634,56 47.887,77
Denmark 10.692.518,66 5.192.296,21
Estonia
Finland 341829,908 66.893,41
France 52.449.310,00 8.626.605,81
Germany 22.997.553,29 36.528.152,00
Greece 1.903.216,53 2.130,25
Hungary 22.079,49 52.482,58
Irish Republic 143.601.118,65 784.933.069,39
Italy 31.835.649,15 11.355.261,67
Latvia 124.637,14
Lithuania 87.014,94
Luxembourg 100.527,81
Malta 578.401,43 3.289,50
Netherlands 96.713.819,67 83.092.852,63
Poland 4.534.575,89 73.455.096,04
Portugal 5.744.389,60 1.660.698,12
Romania 570.250,12 98.986,31
Slovakia 290.425,58
Slovenia 7.908,27
Spain 9.712.575,38 9.646.310,66
Sweden 5.227.239,34 35.841,09
Total € 411.955.953,98  € 1.028.732.449,42 

(Live bovine animals; Meat of bovine animals, fresh or chilled; Meat of bovine animals, frozen)


Table 3: Overview of EU/UK swine trade in 2017 (Source: HMRC, UK Gov)

SWINE  Dispatch from the UK (Euros2017) Arrival to the UK

(Euros2017)

Austria 4.995,30 4.900.734,20
Belgium 7.864.920,99 68.305.622,70
Bulgaria 670.647,85 171.906,48
Croatia 97.766,59
Cyprus 236.944,62
Czech Republic 824.035,91
Denmark 38.692.210,25 333.727.792,51
Estonia 179.861,54
Finland 3461,794 52.255,52
France 5.774.171,98 50.898.761,75
Germany 42.967.201,80 211.406.645,62
Greece 55.594,08 12.299,98
Hungary 185.903,13 465.678,61
Irish Republic 95.013.500,33 141.456.512,17
Italy 1.200.622,96 11.459.286,64
Latvia 41.466,22 18.833,35
Lithuania 134.255,77
Luxembourg 1.179,79
Malta 88.309,98
Netherlands 12.442.088,13 108.829.901,28
Poland 2.930.259,15 34.106.074,85
Portugal 289.633,72 6.092.751,74
Romania 787.148,52 2.797.244,79
Slovakia 250.845,43 18.688,44
Slovenia
Spain 3.079.349,06 86.389.877,10
Sweden 7.585.332,63 43.716,27
Total € 221.401.707,49  € 1.061.154.583,99

(Live swine; Meat of swine, fresh, chilled or frozen)


Table 4: Overview of EU/UK poultry trade in 2017 (Source: HMRC, UK Gov)

POULTRY Dispatch from the UK (Euros2017) Arrival to the UK

(Euros2017)

Austria 130.889,82 371.355,57
Belgium 5.861.387,74 53.663.620,40
Bulgaria 581.470,72 1.680.596,02
Croatia 5.358,14
Cyprus 512.520,09
Czech Republic 1.390.452,27 2.868,47
Denmark 8.937.996,12 8.797.408,94
Estonia 1.175.117,04 1.694,39
Finland 235401,992
France 40.339.373,82 36.978.560,61
Germany 31.531.636,55 108.818.062,26
Greece 1.166.499,07 23.616,42
Hungary 11.885.385,10 14.077.939,83
Irish Republic 85.485.245,52 129.259.110,35
Italy 5.381.396,43 28.677.118,12
Latvia 1.825.231,46 4.416,81
Lithuania 415.860,27 1.132.634,19
Luxembourg 1.983,06
Malta 951.102,23
Netherlands 46.141.752,47 514.886.615,99
Poland 14.126.588,64 261.652.273,86
Portugal 4.054.877,81 354.318,15
Romania 7.836.540,89 30.712.125,85
Slovakia 915.901,24
Slovenia 524,39 127.911,81
Spain 29.157.463,15 14.647.169,89
Sweden 4.468.466,35
Total 304.516.422,34 € 1.205.869.417,91 €

(Live poultry, “fowls of the species Gallus domesticus, ducks, geese, turkeys and guinea fowls”; Meat and edible offal of fowls of the species Gallus domesticus, ducks, geese, turkeys and guinea fowls, fresh, chilled or froze)


Table 5: Overview of EU/UK sheep and goats trade in 2017 (Source: HMRC, UK Gov)

SHEEP&GOATS Dispatch from the UK (Euros2017) Arrival to the UK

(Euros2017)

Austria 4.269.951,75 333,17
Belgium 48.895.554,83 397.713,81
Bulgaria 1.119.185,22 149.502,95
Croatia
Cyprus 76.035,10
Czech Republic 185.915,68
Denmark 2.182.483,12 62.968,37
Estonia
Finland 32964,631
France 203.038.750,15 1.301.834,22
Germany 70.903.183,37 1.775.942,54
Greece 121.190,17
Hungary 7.724,57
Irish Republic 48.659.424,88 23.796.912,79
Italy 24.279.660,76 6.478,60
Latvia 39.142,01
Lithuania
Luxembourg 3.917,05
Malta 45.322,80
Netherlands 23.147.396,26 5.025.147,70
Poland 2.104.875,72 131.380,45
Portugal 6.151.747,14
Romania 79,87 33.690,31
Slovakia 6.159,12
Slovenia 7.739,40
Spain 3.045.294,77 4.656.336,57
Sweden 785.099,28 84.181,84
Total € 439.108.797,65  € 37.422.423,30

(Live sheep and goats; Meat of sheep or goats, fresh, chilled or frozen)


Wine and spirits: New World wines and Scotch whisky

For more than 20 years EU wine producers have been working hard to stop the drain of their market share in the British market. Their efforts to repel the New World onslaught could be short lived as a result of Brexit and the UK’s expected opening to New World exports. The willingness of the UK to open its market to New World countries for the wine sector will seriously reduce the attractiveness of the British market for the EU wine sector, and likely erode its market share in any case, and more so if we have to face a hard Brexit (although tariffs are much lower than for meat products).

The UK is a large market for traditional EU wine makers at €2.6 billion, with France leading the way (€1.1 billion), followed by Italy (€780 million) and Spain (€280 million).

The UK will also be willing to secure a preferential access to the internal market for Scotch whiskies, which is indeed particularly sensitive from an UK economic point of view.

This tariff line (more than €1.7 billion) represents 10% of the UK’s agri-food exports, with France, Germany and Spain being the main outlets.


Table 6: Overview of EU/UK wine products trade in 2017 (Source: HMRC, UK Gov)

WINE Dispatch from the UK

(Euros2017)

Arrival to the UK

(Euros2017)

Austria 2.559.715,98 € 6.681.710,83 €
Belgium 10.243.458,72 € 37.312.632,85 €
Bulgaria 337.924,27 € 2.083.610,91 €
Croatia 146.554,60 € 56.925,63 €
Cyprus 2.079.561,50 € 181.148,58 €
Czech Republic 3.936.202,40 € 1.792.643,36 €
Denmark 29.215.769,39 € 13.474.081,55 €
Estonia 1.644.241,47 € 35.430,33 €
Finland 6.392.979,64 € 328.566,92 €
France 56.216.089,88 € 1.134.425.937,95 €
Germany 32.406.452,66 € 174.894.669,58 €
Greece 315.718,12 € 2.736.686,22 €
Hungary 568.801,05 € 9.940.844,98 €
Irish Republic 55.678.918,49 € 16.229.524,67 €
Italy 3.802.521,70 € 775.860.992,08 €
Latvia 5.801.067,64 € 46.277,82 €
Lithuania 863.229,26 € 108.765,83 €
Luxembourg 131.097,48 € 533.164,20 €
Malta 974.168,69 € 69.156,01 €
Netherlands 61.023.895,34 € 24.297.869,98 €
Poland 4.104.155,32 € 10.940.503,60 €
Portugal 670.431,06 € 69.041.524,34 €
Romania 376.184,28 € 5.368.749,58 €
Slovakia 273.174,80 € 831,79 €
Slovenia 129.401,95 € 520.208,14 €
Spain 15.880.933,19 € 282.231.105,69 €
Sweden 19.621.716,53 € 9.990.104,23 €
Total € 315.394.365,39  € 2.579.183.667,66

(Wine of fresh grapes, incl. fortified wines; grape must, partly fermented and of an actual alcoholic strength of > 0,5% vol or grape must with added alcohol of an actual alcoholic strength of > 0,5% vol; Vermouth and other wine of fresh grapes, flavoured with plants or aromatic substances)


Table 7: Overview of EU/UK spirits (obtained by distilling grape wine or grape marc) products trade in 2017 (Source: HMRC, UK Gov)

SPIRITS Dispatch from the UK

(Euros2017)

Arrival to the UK

(Euros2017)

Austria 745.705,11 € 2.328.596,16 €
Belgium 2.033.606,58 € 19.868.701,95 €
Bulgaria 128.321,42 € 28.159,88 €
Croatia 99.116,39 € 12.828,26 €
Cyprus 706.087,31 € 65.788,92 €
Czech Republic 180.560,97 € 1.683.283,07 €
Denmark 3.916.318,20 € 6.828.469,68 €
Estonia 326.003,10 € 36.920,48 €
Finland 925.397,78 € 13.645,22 €
France 12.333.131,76 € 228.595.001,65 €
Germany 7.694.556,00 € 29.921.475,61 €
Greece 186.822,78 € 822.293,60 €
Hungary 436.861,52 € 1.254.508,96 €
Irish Republic 13.391.937,54 € 13.434.110,04 €
Italy 5.153.482,82 € 50.631.150,47 €
Latvia 283.724,48 € 66.427,88 €
Lithuania 379.671,17 € 20.637,27 €
Luxembourg 65.802,61 € 619,56 €
Malta 400.826,45 €
Netherlands 8.949.003,34 € 12.735.619,51 €
Poland 674.165,56 € 10.903.264,79 €
Portugal 333.764,18 € 4.954.340,66 €
Romania 313.267,26 € 1.225.739,79 €
Slovakia 199.172,96 € 831,79 €
Slovenia 129.609,61 € 228.975,88 €
Spain 8.123.908,59 € 26.359.739,13 €
Sweden 1.600.716,89 € 8.601.283,59 €
Total € 69.711.542,36  € 420.622.413,78 


Sugar and sugar products: refining of sugar cane flooding the EU market?

Having the UK open to the world market will change drastically the EU sugar landscape, and the difficult balance reached between sugar beet and cane refiners. The longstanding tensions between the continental sugar beet cooperatives (German, French and Dutch) and the US owned cane sugar refining company (American Sugar Refining –Tate&Lyle, which owns, in London, 25% of the total refining capacity in the EU) are about to rebound.

On the one hand, the EU sugar producers are enjoying an important outlet in the British market (€970 million). On the other hand, Tate&Lyle is poised to regain competitiveness from UK FTAs with sugar cane producing countries. In this case, assuming that the beet sugar producing company maintains its production, the British market would most probably be in a position to switch from a deficit to a surplus position.

Restrictions via current EU strict rules of origins for the sugar sector will need to be implemented to the UK to avoid a damaging triangular trade in a post-Brexit context, taking into account that raw sugar refining into white sugar is not considered as a substantial transformation allowing operators to rebrand it as “local products”.


Table 8: Overview of EU/UK sugar products trade in 2017 (Source: HMRC, UK Gov)

SUGAR Dispatch from the UK

(Euros2017)

Arrival to the UK

(Euros2017)

Austria 3.544.084,06 € 2.300.718,11 €
Belgium 16.795.677,46 € 179.627.172,46 €
Bulgaria 619.875,63 € 1.083.349,83 €
Croatia 194.524,53 € 72.563,04 €
Cyprus 2.033.303,08 € 11.391,74 €
Czech Republic 2.720.512,54 € 41.234.284,08 €
Denmark 10.619.931,67 € 11.202.972,40 €
Estonia 367.544,63 € 23.613,00 €
Finland 2.132.546,12 € 9.908.677,91 €
France 23.961.729,10 € 255.426.222,52 €
Germany 31.431.212,58 € 133.142.309,88 €
Greece 1.457.578,44 € 6.229.543,94 €
Hungary 710.638,76 € 8.513.943,47 €
Irish Republic 121.924.561,54 € 44.262.294,99 €
Italy 23.343.349,32 € 19.024.223,89 €
Latvia 295.867,01 € 645.351,88 €
Lithuania 1.365.932,18 € 506.467,08 €
Luxembourg 384.477,07 € 86.916,82 €
Malta 2.434.711,44 € 2,28 €
Netherlands 35.940.517,60 € 157.756.964,82 €
Poland 14.635.140,33 € 35.129.764,08 €
Portugal 2.845.615,21 € 1.362.188,56 €
Romania 1.071.422,96 € 386.193,13 €
Slovakia 1.111.615,83 € 8.325.992,24 €
Slovenia 812.900,89 € 1.534,65 €
Spain 12.564.966,98 € 46.237.124,09 €
Sweden 8.490.372,69 € 2.041.295,78 €
Estimates 346.179,40 € 3.541.381,03 €
Total € 324.156.788,99  € 968.084.457,68 


Milk and milk products: more competition in a big market

The challenge of Brexit for the milk sector is more than significant (€3.7 billion EU27 exports). Once again, Ireland (€875 million) but also France (€678 million), Germany (€465 million), The Netherlands (€265 million) and Italy (€232 million) have serious interests in the British market.

Even if the trade balance is not in its favour, the UK also has a significant market position in Ireland (in particular via Northern Ireland) and France. In total, nearly €1.5 billion of dairy products are exported or re-exported from the UK to the EU internal market.

To put it into perspective, the volumes of butter exported to the UK are three times those exported to Russia, and cheese volumes are the double. It is worth remembering the devastating impact of the Russian ban on the EU dairy market, already shaken by higher levels of production.

A hard Brexit would dwarf the Russian crisis, but even in the event of a UK-EU27 FTA, a UK FTA with New Zealand and with the US would inevitably bring added competition in the UK market for EU exporters, which would face an erosion of their market share. The losses in the UK market would lead to increased pressure on the EU-27 internal market and to another dairy crisis.


Table 9: Overview of EU/UK dairy products trade in 2017 (Source: HMRC, UK Gov)

DAIRY PRODUCTS Dispatch from the UK

(Euros2017)

Arrival to the UK

(Euros2017)

Austria 3.183.949,09 € 14.302.933,62 €
Belgium 117.922.502,89 € 244.524.751,39 €
Bulgaria 3.102.309,40 € 2.309.268,76 €
Croatia 689.133,19 € 70.302,72 €
Cyprus 6.168.891,81 € 69.488.246,38 €
Czech Republic 5.540.827,22 € 6.416.682,78 €
Denmark 60.983.982,02 € 265.800.359,97 €
Estonia 680.636,17 € 210.238,38 €
Finland 2.792.831,41 € 2.613.926,03 €
France 173.682.535,08 € 678.384.348,87 €
Germany 123.902.583,16 € 465.225.006,31 €
Greece 12.440.353,81 € 111.889.684,47 €
Hungary 2.717.357,68 € 3.366.449,76 €
Irish Republic 608.137.326,08 € 906.148.741,32 €
Italy 57.357.676,36 € 327.570.200,03 €
Latvia 758.448,94 € 550.917,02 €
Lithuania 2.067.341,39 € 5.582.106,31 €
Luxembourg 360.103,02 € 619,56 €
Malta 4.187.729,01 € 38.312,50 €
Netherlands 205.749.127,19 € 296.648.515,84 €
Poland 24.114.358,39 € 93.824.215,49 €
Portugal 8.499.368,33 € 8.083.630,15 €
Romania 3.810.326,14 € 5.838.581,43 €
Slovakia 1.211.371,18 € 28.881.177,98 €
Slovenia 353.699,73 € 228.975,88 €
Spain 59.079.420,25 € 91.471.885,39 €
Sweden 15.509.618,71 € 16.966.648,32 €
Estimates 1.177.201,65 € 13.251.109,61 €
Total 1.506.181.009,27 € 3.659.687.836,25 €

(Milk and cream, not concentrated nor containing added sugar or other sweetening matter; Milk and cream, concentrated or containing added sugar or other sweetening matter; Buttermilk, curdled milk and cream, yogurt, kephir and other fermented or acidified milk and cream, whether or not concentrated or flavoured or containing added sugar or other sweetening matter, fruits, nuts or cocoa; Whey, whether or not concentrated or containing added sugar or other sweetening matter; products consisting of natural milk constituents, whether or not containing added sugar or other sweetening matter, n.e.s.; Butter, incl. dehydrated butter and ghee, and other fats and oils derived from milk; dairy spreads; Cheese and curd)


Fruits and vegetables: is the carbon foot print a sufficient argument for preferring EU origin?

With about €5.1 billion of fruits and vegetables exported from the EU27 to the UK, it’s clear that EU producers are heavily exposed to the Brexit consequences. Spain (€1.9 billion) and The Netherlands (€ 1.1 billion) top the list.

Many other countries are also concerned, such as Italy, Belgium, Ireland, Poland, France, Germany, Greece or Cyprus, which is traditionally exporting potatoes to the UK (€6 million).

The challenge for EU exporters could come from freer access to the UK market from exporters in North Africa and the US.

Nevertheless, the proximity to the market should allow EU producers to keep strong positions, even under enhanced competition with the rest of the world.


Table 10: Overview of EU/UK fruits and vegetables trade in 2017 (Source: HMRC, UK Gov) 

FRUITS&

VEGETABLES

Dispatch from the UK

(Euros2017)

Arrival to the UK

(Euros2017)

Austria 2.951.234,15 € 3.550.442,85 €
Belgium 31.723.011,92 € 312.160.278,48 €
Bulgaria 266.005,89 € 790.059,21 €
Croatia 725.452,36 € 217.768,98 €
Cyprus 1.128.414,77 € 15.164.509,56 €
Czech Republic 2.802.036,99 € 347.962,78 €
Denmark 4.108.252,65 € 7.374.292,13 €
Estonia 114.920,38 € 31.386,63 €
Finland 1.598.107,42 € 156.281,63 €
France 70.146.578,28 € 390.957.130,33 €
Germany 35.521.250,30 € 504.303.376,60 €
Greece 4.980.782,20 € 73.241.540,78 €
Hungary 1.143.669,94 € 20.019.792,03 €
Irish Republic 212.789.595,81 € 216.241.313,64 €
Italy 27.415.857,86 € 280.027.053,10 €
Latvia 108.976,91 € 78.408,38 €
Lithuania 770.101,98 € 2.431.382,00 €
Luxembourg 85.989,18 € 53.495,79 €
Malta 1.764.575,90 € 1.257.045,41 €
Netherlands 77.899.668,71 € 1.120.829.973,64 €
Poland 22.391.595,58 € 215.405.781,02 €
Portugal 4.780.536,70 € 78.545.182,62 €
Romania 374.278,81 € 4.086.623,86 €
Slovakia 1.421.063,01 € 1.933.413,09 €
Slovenia 510.047,54 € 203.768,91 €
Spain 47.557.045,45 € 1.862.768.149,17 €
Sweden 10.443.796,64 € 1.307.070,27 €
Estimates 2.460.171,71 € 14.312.098,13 €
Total € 567.983.019,04  € 5.127.795.580,99 


II – TRADE NEGOTIATIONS

The FTAs that the EU is actively pursuing will add once implemented to the woes of some important sectors, whilst providing welcome export opportunities to others.

The sector that risks the higher negative impact is beef. With the notable exception of the FTA with Japan where the EU is expected to develop to some extent its exports, the FTAs with Mercosur and Australia will directly impact the internal market through increased imports, including high valued prime cuts, on top of the recent agreement with Canada. Mercosur alone represents a minimum of 100 000 tons of increased beef imports, double of what Canada will be able to ship.

The pig meat sector will probably face a similar pattern of increased imports if Brazil manages to export hormone free meat to the EU. The impact will not be as high as for the beef sector, as the import volumes relative to the EU market are smaller.

Poultry will also face increased competition from Brazil in particular, which means that in the end the whole meat sector is bound to be under considerable duress.

The other sectors where the negative impact will be felt are sugar and ethanol. Again, the world leader Brazil will be in a position to significantly increase exports to the EU, further depressing a market still adapting to the end of the production quotas.

The dairy sector can benefit from a Mercosur FTA, but will suffer under FTAs with New Zealand and Australia. The balance depends on the fine print of each of the FTAs, so it is premature to speculate on the overall effect on the internal market.

On the positive side the EU processed agriculture products, wine and spirits, olive oil, are likely to come out in a better position.


ARE THE EU AND THE US HEADING TOWARDS A TTIP-LIGHT? 

Recent trade frictions as a result of US protectionist measures on steel and aluminum have led to discussions at the highest level between the US and the EU on how to avoid further escalation of tariffs and trade barriers.

The outcome of these discussions is not clear so far, a lot will depend on further talks that are under way.

The common understanding seems to be to work towards free trade on industrial products, except on the automotive sector, and somehow increase imports of some goods from the US (soybeans and gas).

The EU claims agriculture would otherwise be out of the talks, whereas the US disputes this.

The fact is that under WTO rules to negotiate a Free Trade Agreement totally excluding an important sector does seem very problematic to say the least, from the standpoint of assuring that “substantially all trade” is liberalised and respecting the Understanding on the Interpretation of the relevant rules.

Therefore the question is where are these talks heading? They could head to failure, and to a renewed risk of escalation of retaliatory measures. The risk is there, it has been clearly expressed by the US, and the primary target seems to be the EU automotive sector. On the other hand the US does not have from a strategic viewpoint an interest in opening trade fronts with China and its main trade partner and ally, the EU, at the same time. So the will to find a workable compromise might be strong from both sides.

The workable compromise could take the shape of a TTIP-light. No one wants to use the TTIP acronym anymore, but what we are talking about is a FTA with many exceptions, and not including highly politicized chapters as ISDS or public procurement. A light version of TTIP.

The EU could push to exclude agriculture, but the US has an interest in increasing its exports and rebalance the trade deficit in the sector. In the end the discussion could be on how far the exceptions would go without excluding any sector a priori. This is a slippery slope as far as the EU agri-food sector is concerned, as it has substantial defensive interests in particular in the meat sectors that outweigh its offensive interests.


THE CUMULATIVE IMPACT OF BREXIT AND TRADE NEGOTIATIONS

Even if seen in isolation, Brexit and the sum of the many trade negotiations, will bring additional volumes to the EU internal market, depressing prices, shrinking farmers revenues and impacting meat, sugar and ethanol processors.

The impact of Brexit will be higher, and even catastrophic if in the event of a hard Brexit the UK and the EU27 revert to applying their WTO bound tariffs to mutual trade. Only in the scenario where the UK would stay in the customs union and would not have the freedom to negotiate FTAs with other countries would the impact be inexistent.

To Brexit adds the impact of all the EU negotiated FTAs, magnifying its negative consequences. We are facing additional quantities of beef in the internal market on the high hundreds of thousand tons, as for pig meat and poultry.

For dairy the difficult to predict balance of the trade negotiations will be dwarfed by the negative impact of Brexit. The same can be said about the wine sector.

On sugar and ethanol the impact might be less dramatic than for the meat sector, but it will further depress the outlook for sugar beet production in the EU.

Therefore what we are looking at is a prospect of simultaneous powerful negative impacts in key agriculture sectors, something never seen before since the inception of the EU.

The current CAP is not wired to respond to such a dramatic impact. It lacks the market tools, the resilience tools, and the budget reserves for such events.

The proposed reformed CAP will be even less prepared, as the budget will shrink and no new market or resilience tools are to be in place.

There is a crucial point to make: whilst the CAP is, with the cohesion policies, targeted by the Commission to suffer big cuts, the agri-food sector will be by large the most negatively impacted by Brexit and by the trade negotiations. The reason is simple: the tariffs are multiple times higher than for industrial products, and the competition from third countries will increase more as a result of market opening.

The Commission President said that the proposed EU budget for 2021-27 has the flexibility to respond to bad outcomes from Brexit. The sector that will suffer the most is undeniably the agri-food sector.

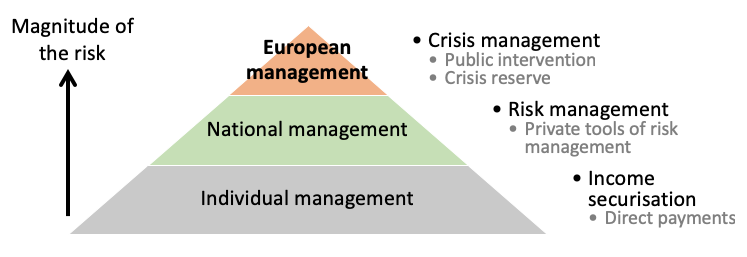
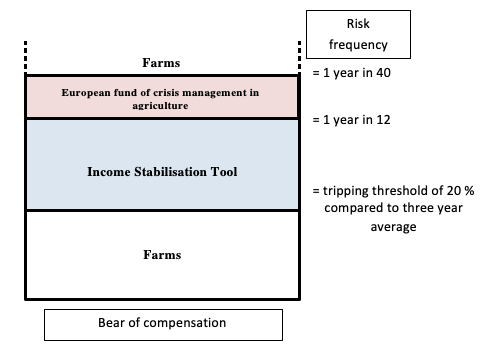
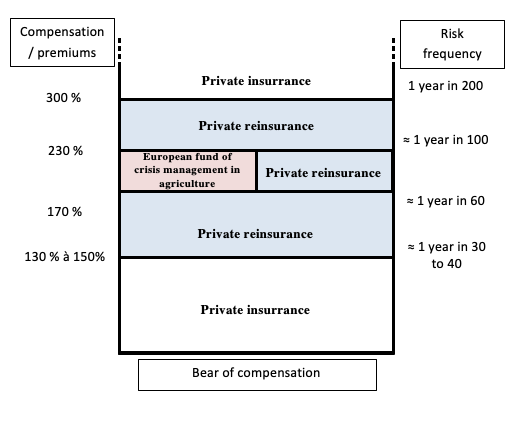
Instead of further cutting the CAP budget, the Commission should reverse course and at least stay the post-Brexit CAP envelope. The EU should build in the new CAP toolbox resilience mechanisms – crop and revenue insurance and mutual funds; and create a real, meaningful, crisis reserve.


Policy paper A NEW EUROPEAN AGRICULTURE CRISIS FUND

September 2018

The CAP has a few provisions that aim at tackling the crisis that all too often plague the agriculture sector. It can be argued that direct payments provide a welcome first layer of income stabilization, but they are not designed to respond to sudden crisis, climatic or market driven. The CAP also offers some support to climatic insurance and to income stabilization tools, but it has to be recognized that their implementation has been far too modest and uneven in the EU. Between 2014 and 2017 only a token 380 million euros per year were disbursed to support risk management tools, less than 1% of the CAP budget.

The current severe drought affecting large parts of Europe has shown again how weak and unprepared the sector is to cope with these extreme climatic events. There are too few private insurance schemes, and farmers are therefore at the mercy of events and of the disposition of national governments to disburse aid.

Although a number of improvements were introduced by the Omnibus package recently, the prospects for the current CAP and the proposals of the Commission for the future are not expected to drastically improve the current situation of widespread lack of risk management tools in the EU.

The remaining public intervention provisions are also too limited to tackle large market crisis. Neither the provisions on private storage nor the triggering levels for public buying-in have provided the level of response demanded by the latest string of market crisis – the 2009 and 2016 dairy crisis, the 2011 fruit and vegetable crisis, or the Russian embargo.

The CAP also opens up the possibility for some ad-hoc crisis interventions, which have been used in the latest dairy crisis for instance. But there is a lack of structure, no guarantees and little transparency on how the EU is supposed to act. The crisis reserve misses a clear mission and lacks adequate funding.

The CAP is thus like a big building that lacks a proper roof. The foundations, the aisles and rooms are built with great care, but when crisis strike the building leaks through the roof endangering its own foundations.

This is hardly a new finding, as many in the European Parliament and Member States have pointed out that the EU is deprived of proper risk management tools and resources, unlike the US who happens to be her main competitor amongst developed countries.

The time has come to change that, and provide the CAP with a proper roof. The discussion on the new CAP provides us with a unique opportunity to complete our building.

A new European Agriculture Crisis Fund should be created with a number of well-defined missions:

  • To provide under very clear terms re-insurance to private climatic insurance, thereby reducing insurance premium and increasing the insurance offer to all farmers
  • To provide also compensation on large income losses occurred by income stabilization tools, like sectoral mutual funds, that would not otherwise be in a position to survive deep market crisis
  • To create a framework for rapid crisis interventions with a view to minimize its effects, swiftly acting to rebalance market conditions

The Fund should gradually built up till reaching 1.7 billion euros, a level that should adequately finance its missions.  It should be said at this stage that this level compares favourably with the 2.8 billion euros that the EU spent to tackle the 2009 and 2016 dairy crisis alone, if the Fund would be operational the expenditure would have been much lower.

The Fund should be built with 4 years of contributions of the crisis reserve at the current level, which instead of remaining unused would be added-up to create a real operational Crisis Fund.

The studies that were made show that climatic re-insurance is needed for events that happen at least every 60 years and that it would cost 150 million euros per year (to cover 70% of the total EU agriculture with individual farm losses over 20%).

The cost of re-insuring income stabilization tools for dairy would cost 135 million euros per year (to cover market crisis that happen once every 12 years, covering 100% of the total EU milk production). There should also be room in the Fund to re-insure other sectors than dairy, for instance the sugar sector that has shown a particular interest.

Finally the Fund should promptly mobilize resources to intervene swiftly in market crisis as they unfold, as it was successfully done in the latest dairy crisis (unfortunately after wasting valuable resources in un-guided support). Acting to rebalance offer and demand in the market would reduce the overall costs of tackling market crisis and eventually reduce the amounts needed to re-insure income stabilization tools.

The sector is facing great uncertainty, in particular due to Brexit and to international trade conditions and agreements, and to climate change. Instead of reacting late at great cost and pain, the EU should now establish the mechanisms and devote the resources to anticipate and weather the crisis to come.

Policy briefing Beef & Dairy Sectors: Sectorial strategies to secure economic dynamism in the EU cattle sector


September 2018

Executive Summary

In the European Union around 3.6 million farms belong to the EU cattle sector, which represents the 17% of all EU farms. In merely economic terms, these holdings contribute one third to the total EU agricultural gross production value, utilize one third of EU agricultural land and employ one quarter of EU agricultural labour force[1].

The main EU cattle producers are Germany, France, the UK and Italy, which account for half of the gross production value.

Focusing specifically on the suckler cows segment, the sector is characterised by the presence of a vast array of economic interplays: breeders versus fatteners, very well segmented markets’ strategies versus production methods with low differentiation strategies, small farms (50 heads and less) versus larger ones (more than 300 heads), which usually focus their activity either on dairying, rearing and fattening combined or specialising only in fattening, as an example.

Whereas, considering the dairy sector, the picture is slightly different, with less heterogeneous realities. Three main broad groups can be identified at farm level: we have large but also medium size very competitive and dynamic specialized dairy farms, medium but mostly small size farms, often located in remote or distant regions (as mountainous areas), where added value products (i.g. DOP PGI or IGP) represent the main assets and on which well structured commercial strategies can be built. In addition there are medium size farms located in intermediate or less favoured regions, whose profitability relies mainly on products traded as commodities (no differentiation).

If we look only at figures related to income, the EU cattle sector incomes’ level ranges between 2,300 and 65,000 € per year and worker unit. Furthermore, it has been calculated[2] that in 2016 income support via the CAP provides on average 57% of the total annual farm net income, which amounts to 49% in the dairy sector and 100% on average in the bovine meat sector, respectively.

Against this backdrop, the aim of this note is to analyse the main characteristics of the EU beef and dairy sectors, to underline their interlinkages and their potential consequences, highlighting the challenges they are facing and delineating options for sectorial agri-food strategies, which include a balanced policy mix between EU, national and regional levers to achieve growth and ensure an ambitious level of economic, environmental and social sustainability.

Context

 The European Commission has presented the proposals for reform[3] of the Common Agricultural Policy (CAP) alongside with the budget proposals[4] for the period 2021-2027 for the European Union and its policies. Specifically, European farmers’ incomes would be highly impacted[5] by the proposed 12% drop in the CAP budget value (constant prices), which would have a particularly severe effect for the following sectors: field crops, milk and bovine meat. This as a consequence of the intrinsic dependence of cattle, sheep & goat and cereal producers on direct payment for their profitability.

Specifically, the viability for cattle producers would be severely impacted, given the structural characteristic of being a sector for which direct payments represents a large share of income.

Overall, the CAP budget for 2021-27 would see the share drop from around 38% to almost 28% of the total EU budget, which is partly due to the UK’s departure, and for nearly 60%  to the will of the European Commission to use former CAP budget for other EU new spending priorities such as security and migration.

The negative economic consequences stemming from the Commission’s proposal would add up to the existing challenges that these key economic sectors have to face, at a time of massive pressure for European agriculture towards more sustainable models in both economic, environmental and societal terms. The role of the new CAP should be therefore to accompany and encourage this development.

The importance of the EU cattle sector, which consists of EU dairy sector and EU bovine meat sector, for the European Union at large, should not be underestimated. Its economic importance in terms of employment at each step of the value chain, rural vitality especially when considering most vulnerable regions, provision of environmental goods and high quality products, is undeniable.

Another relevant aspect that should be underlined is the ever-changing economic dimension of livestock production, considering: (i) level of income support, (ii) price stability, sensitive equilibria in the food chain (i.e. retail buying power in a fragmented supply chain) and the trade dimension.

Both livestock and milk sectors went through difficult times in recent years. Starting from the abolition of the milk quota system (April 2015), high prices volatility at EU and especially global level, lack of competitiveness in comparison with other main producers – profitability being a function of margin/costs (i.e. the U.S., Australia, Argentina and Brazil), increased competition led by new international trade agreements (progressive trade liberalization and therefore more exposure to international markets which entails higher risks of price oscillation and cheaper imports), the impact of climate change (and related demanding mitigation efforts needed – binding targets) recent changes in global supply and demand (increase in protein demand due to population growth), and last but not least, increased societal attention towards quality, safety, animal health and nutritional aspects.

According to the last OECD-FAO Agricultural Outlook 2018-2027[6] global agricultural prices are expected to remain constrained given the forecasted supply growth (especially in the crop and livestock sectors), abundant stocks and global food demand growth. Focusing on specific agricultural commodities, the growth in demand is expected to slow down for cereals, meat, sugar and vegetable oils, however dairy seems to be the exception. Demand growth for dairy products is said to generate therefore higher dairy prices and consequently better margins for producers.

In a situation where it is assumed that the Russian import ban on certain EU agri-food products remains valid at least until the end of the year, latest figures from the short-term outlook for EU agricultural markets[7] in 2018 and in 2019 anticipate a slight increase in EU milk production impacted by unfavourable weather conditions in some Member States, and higher meat availability in the EU (as a result of modest increases in production and higher meat imports).


EU dairy sector in a nutshell[8] 

The EU dairy sector is of a great economic value for the EU.

Milk production takes place in all EU Member States and represents a significant proportion of the value of EU agricultural output.

DG AGRI data show that total EU28 milk production is estimated around 160 million tons per year (2016/2017 DG agri data)[9].

The EU’s main producers are Germany, France, the United Kingdom, Poland, the Netherlands and Italy which together account for almost 70% of the EU production. Specifically, the EU15 accounts for a share of 83% in total EU milk production.

In Europe, according to Eurostat, a number of 1.7 million farms keep 23.5 million dairy cows with an average milk yield per dairy cow of 6,900 kg per year. When considering the last decades, after milk quotas removal in 2015, in line with the market orientation approach given to the common agricultural policy despite the reduction of dairy cow’s number, the yearly milk production per cow has steadily increased. An explanation to this is given by the structural dynamics changes in dairy herds with the growth of the most productive ones.

A major factor is the presence of price volatility in the milk markets (usually measured by the coefficient of variation over 3-year periods), especially since 2006 (see figure below), with crises in 2009, 2012 (before removal of quotas, and a major crisis in 2015 after removal of quotas, which has inevitably led to a more market sensitiveness – and in parallel with the slow down of world markets) – between 2008 and 2017, agricultural prices fell by 10%[10].

Not negligible impacts on production levels, difficulties to adjust and usefulness of public signals and incentives were key variables for the sector (i.e. the 2016 incentive scheme was introduced with the aim to reduce voluntarily milk production levels). As also specified in the last EU Agricultural Outlook 2017-2030[11], world market price variability is expected to continue and market unbalances will occur.

At the end of 2017 and beginning of 2018 figures show that milk production in the EU has increased following markets’ signals of increasing milk prices (an average EU milk price of 34 c/kg in March 2018)[12]. Milk prices in the EU have indeed recovered from the low levels in 2015-2016.

To be precise, the majority of farms in the cattle sector in the EU15 are either specialized in dairy or in meat production, while cattle production in MS of the EU13 is located mainly on farms of mixed production focus and small economic size. It has however to be noted that most of the farms belonging to the EU dairy sector are defined as « highly specialized ».  Different type of farming (intensive vs extensive), housing systems (indoor and grazing) along with climatic, topographic as well as factors such as farm economics and consumers’ sensitivity, have an influence in the structuring and competitiveness of the business models[13].

Economically speaking, the EU milk sector provides a substantial contribution especially for the most fragile areas, which are naturally disadvantaged such as mountains or other regions of low productivity potential. The same applies to the meat livestock sector. This is mainly due to geographical, climatic and soil conditions. Given the lack of alternative farm specializations in these regions, the agricultural sector capacity to maintain vibrant rural community should be therefore valorized.

This is the dual aspect of the milk sector: economic & territorial dimension, whose sustainable balance needs to be ensured.

The European Union has become throughout the years one of the world’s leading dairy producers. However, unlike its main global competitors (the USA and New Zealand), Europe has not a single industry model.

Roughly and to sum up, four main dairy models exist in Europe:

  • In disadvantaged areas (i.e. mountain regions, but as well intermediate regions), where the milk production faces first the challenge renewal of generations as these regions face problems of attractiveness to young people, and secondly very different trends of milk production are present (i) between regions producing high added value specialities and (ii) regions producing milk as a “commodity”;
  • In most productive regions, there are two main industry models: (iii) a capital-intensive one that mainly relies on buying in animal feed, and (iiii) a mixed model that relies mainly on food produced on the farm.

Policy instruments & Context

After the removal of the milk quotas in 2015, which represented a challenging moment for the dairy sector, and which followed a phase of policy efforts to increase the power of milk producers and rebalance the milk supply chain preparing the end of quota scheme.

The EU milk sector was not ready when the crises occurred in 2015. Imbalances in overall production, decreasing global markets demands, without the presence of a well functioning EU framework, combined with wrong individual reactions, translated into production increases in face of lower margins per liter and consequently this caused even an higher impact on market prospects. It took almost a year to EU public authorities to act in order to solve markets dysfunctions and stabilise dairy markets so basically adopting their primary role and having in mind that it is less costly and far more efficiently to reduce production than to manage heavy stocks due to the level of overproduction.

This was and should remain a lesson for the future.

Indeed, while the current outlook for world dairy markets is positive, there are some concerns on the capacity of the EU regulatory framework to deal with episodes of extreme market volatility or with a crisis situation after the quota regime, especially in the perspective of ensuring a balanced development of milk production across Europe.

In a nutshell, in addition to direct payments and rural development programmes, the EU dairy sector, which is currently integrated into the CMO Regulation (EU) No. 1308/2013, also benefits from the following measures/market tools[14],:

  • Public intervention is available (between 1 March to 30 September each year) for butter and SMP (skimmed milk powder). Before January 2018 it opened automatically, while, after a recent Council decision[15], a quantitative limitation for buying-in skimmed milk powder at a fixed price at zero tonnes for 2018 has been set.

Butter is bought into intervention at 2 217.5 €/t (90% of the reference threshold) and SMP at 1 698 €/t (reference threshold) until a limit of 50 000 tonnes for butter and 109 000 tonnes for SMP. Above these limits, buying-in may continue only by tender (it has to be noted that prices cannot be higher than the reference threshold for SMP and not higher than 90% of the reference threshold for butter);

  • If the market situation so requires, other instruments may be activated: a private storage aid for butter, SMP and PDO/PGI cheeses can be fixed (optional measure);
  • The reformed CMO allows the Commission to implement any exceptional measure deemed necessary in times of crises (i.g. severe market imbalances), including the possibility to allow POs (Partner organisation), APOs (Association of producer organisation) and IBOs (Interbranch organisation) to take market regulating measures, such as withdrawal of surplus products from the market, private storage, etc.;
  • Border protection is high for milk products, virtually limiting imports from third countries to quantities negotiated under bilateral agreements or resulting from the WTO agreement. Specifically, an import regime is applied for dairy products entering the EU. Preferential imports are subject to the issuing of an import licenceand, in general, payment of an import duty (tariff). While concerning exports, since 2009, they have all been carried out without export refunds;
  • A “Milk Package” has been in force since 2012, increasing the bargaining power of milk farmers, giving the possibility for MS to declare written contracts compulsory between farmers and milk buyers and processors, fostering the structuration of milk farmers into POs, APOs and IBOs, giving the possibility to farmers to negotiate contract terms collectively via POs, allowing for supply management for PDO/PGI cheeses and enhancing transparency.

It has to be underlined that almost all Member States have adopted national criteria for the recognition of Producer Organisations (POs), though some only recently. The creation of POs requires time and a strong dynamic from farmers themselves. Potential incentives to encourage farmers to enter into joint production agreements have been provided in the reformed Rural Development Policy (support for setting up POs, new measures on cooperation and eligibility of groups of farmers for a series of rural development measures).

  • The School Milk Scheme grants an aid for the supply of milk to pupils in educational establishments, contributing to building healthy consumption patterns among children. Under the CAP 2020 reform, MS must have a strategy for the distribution of school milk prior to benefit from the support. A new initiative followed by a political agreement in 2015 led to the single EU School Scheme for Milk, Fruit & Vegetables;
  • Marketing standards apply to milk products, drinking milk and spreadable fats, with a view to give the necessary information for consumers to make well informed choices;
  • With its promotion policy, strategic priorities for promoting EU farm products and funding criteria in a yearly work programme are defined by the EC. Operators are free to come with concrete proposals that are eventually screened and incorporated into the programmes. A total of EUR 179 million is available for promotion programmes selected for EU co-financing in 2018.
  • A Milk Market Observatory has been launched on 16 April 2014 to increase market transparency and help both the actors of the milk supply chain and the public authorities make well-informed decisions. A web interface has been set up through which any interested person can access the latest milk market news, data and short-term analysis on the dairy market.

Two years ago, a milk production reduction scheme officially known as the “Voluntary Supply Management Scheme fo the Dairy Sector” was introduced as a “one-time” exceptional measure. In order to decrease milk production, the scheme offered farmers, who agreed to reduce their milk production, 14 euro cents for every kilogramme of milk reduction over a three-month period (compared to the same period in the previous year). Member States had also the possibility to top up that amount with EU funds distributed as national envelopes for additional support. Dairy farmers were therefore paid according to the actual reduction in production.

In few words, in July 2016 the European Commission implemented this voluntary measure, after an initial reluctance, aiming to support farmers coping with the severe crisis that hit the sector and helping rebalancing the dairy sector. This decision followed the previous measures (late 2015), through which EU funds have been distributed to MS (financial envelopes per MS). The impact of these initial measures was basically a failure in mere economic terms.   Conversely, the EU milk voluntary production reduction scheme, financed with €150 million, turned out to be a success: national figures show that almost 48,000 dairy farmers took part in the scheme, leading to a total milk production reduction of 834,000 tonnes. In other words, it has been reported that, «out of the original allocated budget of €150 million, close to €112 million was used to compensate farmers for their efforts». Furthermore, this exceptional measure had quite a substancial impact also on EU milk market prices, whose average in mid-2017 recorded an increase compared to the previous months.

Challenges, dynamics & structural changes

The European dairy sector is facing several simultaneous challenges:

  • Increased and recurring price volatility ;
  • Strong market crises ;
  • Lack or stagnant competitiveness in some regions ;
  • Profitability, in terms of capacity to keep milk producers and milk production all across the EU because of diverging production costs in relation to natural conditions ;
  • Age of dairy farming population: demographic factor in the restructuring of the dairy industry;
  • Industry organisation, together with the relationships in the milk supply chain between farmers, processors and retailers;
  • Research & Innovation: the appeal of the industry and its profitability will only be enhanced by upgrading dairy production technologies and skills, which require targeted investments and policies;
  • New markets opportunities: the European market is a mature market and the future growth of the dairy industry is and will be exports-driven. This is also a key factor, which is able to ensure the viability of the European dairy industry. Latest projections by the OECD-FAO Agricultural Outlook estimates for the European Union an increase of its export share to around 28% in 2026, compared to the other four major exporters of dairy products (i.g. New Zealand, United States and Australia).

Since 2007, the global economic environment has been changing quite rapidly. Market volatility has increased, both in frequency and amplitude and this is particularly true for the dairy sector, given its inner dependence on exports and the particular sensitivity of dairy production in Europe to sudden price variations in international markets such as milk powders and butter.

The European Union must therefore enable the dairy sector to:

  • Maintain its presence across the whole of the European Union;
  • Invest significantly to strengthen its competitiveness in global markets;
  • Be sufficiently resilient to market fluctuations;

It is therefore necessary to deploy and structure sectorial strategies for the milk sector and analyze the right and balanced mix between European actions and tools and regional/national level, by first, finding more efficient ways to ensure enhanced competitiveness and sustainability of milk supply across the EU.

As abovementioned, in Europe there are both competitive milk regions and less-competitive ones, with no alternative than milk production, and where milk production is associated with extra costs due to the conditions inherent in their nature.

The profitability of farms, described as “the ability to generate profits”, is determined by a number of financial, property and macroeconomic factors, as well as by structural sectoral determinants and their individual technological and economic characteristics[16]. By focusing on the single aspect of economic margin of farms, the study developed in 2017 by the University of Life Sciences in Poznan (see Ref.12) shows that it is key in determining the development of more targeted agricultural policy tools, and for ensuring the viability of pursued agricultural activity. The author also stresses “the margin level is a synthetic indicator of the financial situation, which fundamentally affects the assessment of the farms’ competitive capacity and thus – their capacity to continue their operations”.

Interesting results are presented by the study:

  • “income from milk production in the EU-28 exceeding EUR 51 billion accounts for around 32% of the total livestock production income and around 14% of total agricultural production income;
  • specialised milk production is conducted in the EU by more than 572 thousand farms, i.e. 5.3% of all farms (data taken from “Farm structure survey, 2013”);
  • specialised dairy farms pursue their activity on the area of approx. 20 million ha, i.e. around 11% of agricultural land used in the EU;

By utilizing specific regression model parameters, author demonstrates that the variability of milk production margin depends mostly on the following farms’ characteristics[17]: forage area, cow herd size, cows’ milk yield, milk prices, energy costs and remuneration costs.

While looking at the dynamic within the sector, the following points are raised and discussed later on:

– the EU dairy farm sector experienced a marked increase in both the size of herd cows, forage area and milk production;

– the production capacity of dairy farms has been seen quite strongly associated with an increase in milk yield, forage area productivity and labour productivity. A strong variability of these dynamics among EU countries’ dairy farms has been recorded along with different technological and economic parameters.

An example is provided by comparing data from 2013, which show that the highest net milk margin was recorded on farms in Romania and Italy, which differ in terms of various parameters. Dairy farms in Romania have low operating costs, fixed costs and costs of external factors, which, as discussed by the study, despite relatively low milk prices, determine the high production margin. While in Italy for instance, the rearing of dairy cattle is conducted on a larger scale, which translates therefore into a high labour productivity and milk yield similar to the EU average.

The study also provides additional comparisons by tackling the low profitability of milk production in some EU countries such as Slovakia or Czech Republic. What has been found as “common factors” are:

  • the large scale of production, which is measured by the number of cows and milk production volume;
  • the lower labour productivity compared with the EU average;
  • low prices obtained and high costs per production unit;
  • high cost intensity of milk production

Milk Markets overview – Comparison with World main producers

When looking at the world markets, different factors have to be taken into account:

  • Global milk production has recovered in recent years and future prospects are optimistic, especially for developing countries (Pakistan and India in particular). World milk production in 2030, according to DG Agri latest estimates which match OECD-FAO ones, is expected to record an annual increase of 16 million t, comparable to the average yearly growth of the last decade, and for a total of around €178 Mt in 2026 (taken 2014-16 as base period)[18];
  • New Zealand (world major exporter of dairy product with a share of 32%, primary source for butter and WMP): higher cow numbers and yield progress led to an increase in milk production in recent years. Productivity is expected to grow at a lower pace;
  • Australia’s milk supply is slowly recovering;
  • The U.S. rose in milk production (+1,76% in May), driven by: +0,8% increase in cow numbers, +1% increase in yield, favourable weather. A slight increase in per capita consumption is also expected;
  • Expectations in Europe on SMP stocks release (these are not in view);
  • Global demand & exports: SMP exports have been performing well but the market weakened in 2017 (due to slower demand). Increasing demand for cheese, while butter trade was affected by high prices and lack of availability;
  • EU trade policy development (Canada, Japan, Australia): example – increased export to Canada via the CETA agreement;
  • China’s role: major importer of dairy products – key uncertainty at the moment – strong impact on world markets;
  • Brexit: the impact of a hard Brexit would be very heavy for EU beef and dairy sectors. On one side, it will add to the impact of all the EU negotiated FTAs, magnifying the negative consequences. Additional cheaper quantities of beef would reach the internal market, destabilizing in this way the sensitivity of the sector. Concerning milk and milk products, the picture does not differ: Brexit will bring significant pressure caused by added competition in the UK market for EU exporters.

Internal overview -The Example of The Netherlands as a “dairy country”

Analysis and discussion of the study: “Grondgebondenheid als basis voor een toekomstbestendige melkveehouderij” 12 April 2018

The Netherlands is considered as a dairy country thanks to the combination of sufficient rainfall, suitable soil and mild winters, which are all beneficial for the maintenance of grass in good condition and consequently a favourable condition for dairy cows. Dairy farming is the largest land user in the country.

Dairy farming in the Netherlands changed radically in the 50ies, thanks mainly to technical progress. Milk production per cow and per hectare has increased significantly. Better animal care and housing, modern breeding, sophisticated animal feed, artificial fertilizer and improved grass quality were all enabling factors.

Dutch dairy farming was a land-based sector. Therefore, the farmer had sufficient land available to produce grass and maize for the cows and to make optimum use of the manure of those cows for the growth of the grass and the maize.

During the last years, Dutch dairy farmers started a process of restructuration by investing and expanding themselves.

Dairy farming became year after year more intensive, the farmer had to transport more manure to other agricultural companies and more feed from third parties. As a consequence, this has led to negative consequences for nature, the environment and the landscape.

Focus on the Economic challenge 

Instead of producing more and more milk at lower cost price, the challenge for Dutch dairy farming is to make the switch to milk with more added value. However, the restructuration process increasingly towards large-scale dairy farming with associated financing costs and a higher production per cow, tends to have reached its limits within the Dutch context.

Furthermore, a particular attention has to be given to “exploring niche markets”, given that the domestic demand in the EU (quite stagnant) combined with the global demand of milk and dairy products suggest such a move.

For instance, by allowing and easing (at the national level) supermarket chains’ collaboration with the dairy industry, could set up chains for milk with a higher social added value. Indeed, this is only one of the possible business strategies that could be structured, since only a segment of consumers is nowadays willing to pay an extra price for this.

It is relevant to note that maybe the biggest challenge that both milk and beef sectors have to cope with is to find a way to improve the efficiency and productivity of production methods in an environmentally sustainable way, while increasing their market return thanks to a good communication to consumers. This because issues as  environmental and socio-ethical/nutritional aspects, such as animal welfare, climate impact of livestock production, healthy diets are shaping the policy agenda, and consequently the need for rational use in livestock and dairy production will be the baseline.

Sector’s self-sufficiency in raw material

Substantial steps towards a high level of self-sufficiency will be needed in the coming years.

This key figure is the extent to which the farmer is able to grow protein for his own animals’ feed from his own country or nearby. In addition, the cultivation of own protein makes the farmer less dependent on global sources of protein whose price development is becoming increasingly volatile and which is expected to rise in price in the coming period.

In addition, by ensuring a higher degree of self-sufficiency in protein, the import of protein-rich raw materials from outside Europe can be significantly reduced.

Along this path, in order to achieve a higher production of forage directly on farm and limiting therefore imports, major actions should be targeted at increasing grass productivity and protein content of EU cereals, and as well securing the sustainable production of EU rapeseed meal.

Questions/Issues to be tackled to adopt the right policy approach

What could be a strategy for producers to continue to exist, to be competitive on both the internal & the global markets?

  • Tackle volatility and market crises via new tools and more solidarity across the EU food chain ;
  • Stimulate targeted investments to increase both competitiveness and sustainability;
  • To promote EU quality (safety, quality of products and quality of ways of production) on EU markets and worldwide ;
  • Give value to by-products (energy)
  • Regional approach to better structure processing, in particular in areas facing competitive challenges ;
  • Support farmers with knowledge, training and advisory services on how to effectively operate producer organizations ;
  • Adopt effective and affordable tools to improve the less sustainable practices (e.g. manure/nitrogen management); to reach common EU standards to secure the perception on world market of EU high quality products ;
  • Sectorial economic integrated strategies of development with targeted tools and financial means, mobilized in a flexible way other the period, to accompany the implementation of these strategies (CAP role) 

Actions: EU, National & Regional/Local

On the basis of the elements listed in the paragraph above, effective actions at different levels (EU, national and local ones) could be structured.

In particular, when considering the local/regional level, the focus should be on deciding the type of structuration process – by both better structuring the upstream agricultural sector, and strengthening the weight of the upstream, or even allowing for reconversions.

Sectorial integrated strategies need flexibility in the possibility to mobilize tools making up a sector’s economic strategy (i.e. via specific investments, training, exit plan) on the basis of a kit of EU measures that can be flexibly mobilized in a financial envelope defined in relation to the CAP strategic plan.

In practical terms:

  • How to tackle markets and prices volatility effectively – more effective risk management tools to be deployed via the new CAP and following what has been proposed with the Omnibus regulation
  • Crisis situations: A European Crisis Management Fund in agriculture, financed by an adequately equipped multi-year crisis reserve, must be carried out and take over the IST tools when risks become deep crises (see related Farm Europe note)
  • Innovative strategies to ensure and enhance the competitiveness of the sector, to keep the recent dynamic. Role of Innovation, Research and Technology: in terms of infrastructure improvements, genetic (fewer inputs and better resistance); – One possibility to be further investigated: recent advancements in beef and especially dairy cattle breeding thanks to technological/genetic improvements, which could play a decisive role and a driving force behind increased economic efficiency and consequently profitability of dairy farms.
  • Improve sector’s capacity to get organized (i.e. via contractual/commercial relations, participation of dairy producers to recognized POs);
  • Strengthen the capacity to negotiate prices and volumes ;
  • Effective and shared export action;
  • Ensure a better positioning according to the product value and respective target market;
  • On consumption (internal market): tackle the nutrition/health related issues concerning dairy products – dietary habits changes – meet consumers/societal ‘expectations – Nutritional quality of milk products (source of calcium and protein) – Link with production methods – Diversity of products;
  • For less competitive regions:
    1. role of PDO/PGI quality logos;
    2. tailored regional sectorial strategies for less competitive regions without specific PDO/PGI assets based on structuration, innovative investments and developments of co-productions.(incl. energy).
  • Environmental sustainability commitments/actions: enhance the capacity of the sector to respond to consumers expectations and concerns when it comes to residues, treatments and climate change mitigation ;
  • Commitment of the sector to the climate aspect: build on the achievements over the period 1990-2010 and make new steps forward;
  • Develop the Circular economy concept.

Overall, when dealing with the whole “environmental sustainability dimension”, which represent one of the pressing challenge that the EU agricultural sector has to face, an ambitious EU program for double performance (economic and environmental) should be deployed.

Specifically, increase the dissemination of high-tech farm production methods/practices within the beef and dairy sectors would provide tangible provide results in the inputs optimisation, thus reducing the environmental impact of the agricultural sectors concerned and increasing their competitiveness vis-à-vis the other major producers.

However, given that the picture now of the uptake rate of these high-tech farming techniques (smart and digital farming) remains low and differs widely among EU Member States, the new CAP should accompany the transition towards a double performant EU agricultural sector by proposing an ambitious and clear program.


EU Beef sector in a nutshell

The European beef sector is at the foundation of the economic fabric of many rural areas across the European Union. It provides a great number of jobs at each step of the value chain, from the farm to the sale point, encompassing a range of intermediaries, supporting industries as well as sales and retailing.

In this context, the suckler herd – an important segment of the EU livestock sector – is a key player, not only because it provides more than one third of the beef consumed in the EU, but also for its strategic role in very specific EU areas, – mainly located in Ireland, France, the United Kingdom, Spain, Italy, Portugal and also, more and more, in Poland. Niche market is also present in many other EU Member States, with demand rising in countries like Finland and Sweden. It is also important to highlight that in many areas; this specialized breeding system cannot be replaced by other farming activities. This is due to the agronomic profile of the land.

However, the contribution of this specific sector to the EU economy is too often underestimated.

The European beef sector is undoubtedly one of the most important agri-food sectors in Europe, if not the most important, in terms of local development and of employment, in several regions of the EU.

However, despite the best efforts of public authorities and of numerous private initiatives, this sector has been facing structural and recurrent crises for almost two decades in various parts of the EU.

Ongoing changes in consumption patterns, technological evolutions, and of policy and international commerce ensure a particularly uncertain future for the sector, or at least one, which is difficult to read.

In this context, the sector confronts a major challenge: to grow and develop, despite the uncertainties of the future, to build a collective political and economic strategy, to seize opportunities which present themselves on both the European internal market and on external markets, and to nurture a new link with citizen-consumers. 

Policy instruments available

By considering EU policy, as well as the policies of its leading member states in beef production, and in parallel to the policies pursued by the U.S., Brazil, and Argentina, conclusions may be drawn on how best the EU may support and secure its beef sector in the face of new and unexpected challenges.

The Common Market Organisation covers the beef and veal sector, with market instruments initially conceived to stabilise the sector when deemed necessary through:

  • Public intervention: may be opened by the Commission if, over a representative period the average market price in a Member State or in a region of a Member State is below 85% of the reference threshold (EUR 2224/tonne). Since the 2013 reform, intervention became dependent on the Commission’s will, rather than being triggered automatically once the threshold price is reached. However, the implementation of this tool is very unlikely, taking into account the level of the threshold. At its low point during the 2001 crisis, for example, the EU beef price reached €2318/t (OECD); 
  • Private storage aid: the Commission may decide to grant private storage aid by taking into account average market prices and the reference thresholds and production costs for products concerned, as well as the need to respond quickly to an emergency market situation having a significant negative impact on margins in the sector;
  • Import tariff quotas: the Common Market Organisation (CMO) empowers the Commission to set the measures to manage import quotas. Most of the tariff rate quotas agreed for the beef sector are managed by DG AGRI;
  • Collective negotiation: producer organisations (POs) in the beef and veal sector may negotiate contracts for the supply of live cattle under certain conditions. For each organisation, the quantity of beef and veal covered must not equate to more than 15% of the total national production (this changed with the Omnibus regulation from January 2018);
  • Exceptional market support measures: measures which may be decided and implemented by the Commission in cases of animal disease or loss of consumer confidence;

These measures complement the existing direct support schemes of the current CAP, which include compulsory schemes for all MS – basic payment (or Single Area Payment) per hectare and voluntary schemes (optional for MS), Voluntary coupled support (VCS), through which Member States have the option of providing limited amounts of “coupled” payments (between 8% and 13 % of the national envelope) to those sectors or those regions where specific types of farming or specific agricultural sectors undergo certain difficulties and are particularly important for economic and/or social and/or environmental reasons. The Commission has flexibility to approve a higher rate where justified. In addition, there is a possibility of providing an additional 2% “coupled” support for protein crops.

With the new CAP proposals, the European Commission proposes the 13% to become 10% and it added the possibility to set up operational programmes up to 3% of 1st pillar national envelope. Furthermore, the proposed reform proposal plans to merge the current CAP greening and the conditionality in force into a new, expanded conditionality applying to 100% of 1st pillar aid. However, Member States are able to define the scope covered by a number of these new conditionality requirements. Current greening’s exemptions would not be valid anymore.

Furthermore, a new measure is proposed in the first pillar to finance new environmental actions (eco-scheme). This measure is intended to finance the implementation of environmental requirements going beyond the new conditionality.

Throughout the years, the European beef sector, and especially the suckler cows sector, has been unable to recover and to develop a long-term profitability. Therefore, current policies which were weak in supporting the beef sector during these last years and decades should be questioned and analysed with a strategic approach. 

Main Objectives to be achieved by a sectorial strategy

To improve:

  • Power of producers organisations in the food chain ;
  • the structuration of producers into more powerful organisations ;
  • Joint action among farmers and across the food supply chain in order to foster efficient use of resources, product development and marketing opportunities
  • Productivity and competiveness;
  • Segmentation of the beef markets and correlated strategies of marketing mix
  • Regional strategies of (re)structuration of the sector and its farming component
  • Use of risk management instruments and prevention strategies;
  • Invest in the double performance of the sector : linking increase of profitability and environmental and climate change performance

Challenges – Focus on Beef

Political aspects: the safety nets put in place have proven to be ineffective for the sector, and premiums to offset its new market-oriented character have not altered the difficult economic reality for European farmers, whose incomes are modest and dependent on aid – the public financial effort (notably coupled payments) is to a large extent absorbed by other players in the sector – the work at producer level is not rewarded by the market as it should be for an healthy economic sector. Other actors, too, in particular slaughterhouses, often achieve low level of profitability. In short, the sector does not respond well to short-term strategies, and investments take between 15 and 20 years to have a real impact.

Sanitary and nutrition aspects: since the end of the 1990s, the public perception of beef has changed. While previously a central element of a balanced diet in the opinion of nutritionists, multiple health crises and the debate surrounding climate change have transformed the image of meat and its place in nutritional recommendations. The world market is changing, with traditional powers – the developed countries – focusing on value, while dynamic powers – which are more diverse – have very different requirements in terms of quality standards, and are therefore also more difficult to understand. In addition, the livestock industries are also affected by climate change, with rising temperatures being associated with increasingly significant and more diverse epizootic pressures.

Economic aspects: the livestock industries are mostly located in areas adversely affected by economic globalisation and by the opening of borders in the agri-food industry and beyond. Often isolated, they do not immediately benefit from the economic dynamics generated by the opening of new markets and the development of new technologies. They face a multifaceted challenge:

  • The paradox of being forced to turn to the world market – where the growth opportunities present themselves – while simultaneously being weakened by that very world market, where the highly integrated operators pose fierce competition, having completely redesigned the fundamentals of the sector. This is especially true of Brazil, which has turned beef meat into a ‘commodity’ – in the last decade, productivity in heads per hectare increased by 25%, and the country produced 9.92 million tonnes of beef and veal, or 16.85% of the global total, in 2014 (USDA)._ Virtually all of the ongoing free trade agreements place the industry in a defensive position (Mercosur, TTIP, and Australia, in particular).
  • The difficulty the sector faces in controlling its own destiny, given the competition posed by the dairy herd on the beef market, which provides around 60% of the beef consumed in Europe. This poses a problem, as the dairy herd was previously constrained by the European quotas and in decline due to the increased competitiveness of the dairy cow, while the current expansionist strategy of Europe’s dairy sector shuffles the deck and puts pressure on specialised breeders.
  • Slow investments related to cattle farming and low prospects for depreciation are associated with difficult working conditions.
  • A scenario of a “three tiers” EU sector with a sector in Eastern Europe focusing on low production costs to take advantage of their competitiveness to enter the market, switching from milk to meat; a sector characterised by larger farms focusing on breeding cattle in association with arable crops and forage for own consumption and producing enough to gain some power of negotiation – at least locally (semi-direct sale, regular contracts); and a sector of smaller-medium size farms with basically no bargaining power.

Reasons for the EU to take action

Confronted by this bleak situation, there are nonetheless very real prospects for the European industry, which can count on its capacity for resilience and the remarkable attachment of the livestock community – mobilised, passionate about their work, and in possession of extensive know-how, renowned across the world – associated with products possessing an extremely strong identity.

Beyond the fundamental human factor, given the strong local roots of direct and indirect activities related to the livestock sector, markets offer room for a renewed and ambitious strategy which takes into account the major challenges facing the EU: sustainability, growth, and employment.

In terms of both growth and jobs, Europe has missed the first global boom of beef meat, overtaken by emerging actors – most notably Brazil (Figure 1). The EU is nonetheless an important challenger – a position which it does not hold for any other important agricultural production.

The sector is the economic heart of many remote areas, and can be, in these regions, a real fulcrum for the revival of employment around products with a strong identity. The potential for growth of developing countries is far from exhausted: beef consumption per capita remains three times lower than in developed countries.

According to the OECD, global demand for animal protein is due to grow by 1.6% per year over the next 10 years, driven by revenue growth and urbanisation. In total, 58 million more tonnes will be consumed in 2023 compared to 2011-13, this increase being concentrated primarily in Asia, South America, and Africa. It should benefit in particular the poultry and sheep meat sectors, but all meat, including beef, is expected to see double-digit increases, with prices also due to rise. EU beef meat consumption began to recover in 2014, by as much as 1.8 kg per capita, at trend which is set to continue (European Commission, 2015)._

Moreover, in the background is the question of the durability and appropriateness of the expectations of Europeans, given the products to which they have access.

To put an end to local production would lead to first, an externalisation or outsourcing of greenhouse gas emissions, increasing the pressure on particularly sensitive zones such as the Amazon, and preventing the EU from meeting the climate objectives for which the EU sees itself as an avant-garde actor; Second, the abandonment of the extremely high standards of production and animal welfare – the EU has not succeeded so far, despite numerous attempts, to integrate this dimension into international agreements; and finally, in the longer-term the EU would be faced with products which are controversial, both ethically and sanitarily, rightly or wrongly – such as the use of cloning, against which European citizens retain a very strong resistance.

On this basis, it is appropriate to question and advance the sector’s strategy, mirroring the political tools in order to contribute to the implementation of a winning strategy for this sector.

Elements to structure an effective strategy

Research and innovation: animal genetics and improved livestock management (buildings, animal feed), gains are made both in better meeting consumers’ expectations in terms of products available and marketed, and in reducing the environmental footprint of the production process – the FAO predicted that Grassland carbon sequestration could significantly offset emissions even without any farming system change, with global estimates of about 0.6 gigatonnes CO2-eq per year (UN FAO, 2013)._ In matters of public health, too, it is likely that scientific solutions will emerge on a large scale to remove elements considered a health risk by the WHO due to the excessive consumption of meat. It should mobilise the available knowledge and accelerate its implementation in the sector itself.

Better market segmentation: Linked to the research effort, it is necessary to clarify what is on offer to consumers. A number of market segments are emerging, both in Europe and internationally. The challenge is for each of these segments to find stability and clarity without relying excessively on others. Four components, corresponding to four different sectors of production, may be identified:

  • Meat from the dairy herd: low-end (but a source of instability for other sectors, depending on the variations of the price of milk);
  • Calves from the dairy herd whose quality is improving due to technological advances related particularly to sex-sorted semen: entry-level;
  • Breeds of beef for the “general public”, with large production volumes, of a high level of security for consumers;
  • High-end, with more specific breeds rooted in exceptional terroirs.

These two latter components are at the heart of the strategy for recovering the strength of the livestock sector, in coordination with the two former components. It should ensure that the dairy herd does not hamper the ability of the suckler cow sector to deploy an effective strategy, while maintaining its role as an additional source of income for dairy farmers.

Increased coordination between actors of different sectors and an enhanced level of understanding of consumer expectations at ever link in the chain. This should both allow an increased level of responsiveness and adaptation between markets and production in order to optimise value creation, and accelerate the dissemination of innovation within the sectors. Coordination at each level of the sectors should enable a pool of strategies for different breeds and for marketing prospects.

Optimisation of logistics situations, including in relation to the debates on animal welfare and transport emissions.

Effective communication systems and quality assurance labels to fully highlight the efforts of producers to consumers – and to benefit from appropriate levels of compensation with regard to segmentation and production structures. Moreover, in parallel, a thorough knowledge of both European and international markets is necessary in order to promote, as far as possible, each piece of meat, by finding the market where it is value and fulfils a gap in consumer demands.

When compared to other breeding activities, the EU beef sector production has distinctive traits, which make it particularly exposed to external factors:

  • Tight margins, when looking at producer’s prices;
  • Generally low level of profitability, when considering the complexity of the production systems overall;
  • Low level of elasticity;
  • High global competitiveness vs low internal competitiveness (structurally between 70% to 90% of the incomes in the beef sector depend on CAP subsidies);
  • Animal welfare concerns supported by activists’ campaigns;
  • A mix of positive and negative environmental impacts (biodiversity, carbon sequestration and emissions).

In addition to this, profound changes in consumption, technologies, public policies and international trade are combining together to make the future unpredictable, or at least difficult to foresee, in particular due to:

  • the threat of a more intense competition from the bilateral agreements agreed (Canada) or currently being negotiated – namely Mercosur, Australia, New-Zealand, not mentioning the US;
  • the lifting of milk quotas, which is disrupting the sector’s equilibria through renewed growth in the dairy herd, which already supplies two thirds of the beef consumed in Europe.
  • Suckler beef is as well especially vulnerable, with Brexit and the risk of cheap beef imports under CETA, possibly other trade deals the EU is negotiating currently and trade deals, which the UK may ultimately negotiate with non-EU countries after having left the EU.

Consequently, the sector is facing a double challenge:

  • Building a clear and concrete vision for the future and, to do so, devising a strong market-driven business strategy for the sector as a whole. This strategy must enable the industry to seize opportunities both within Europe and beyond, as well as help it to adapt to changes in demand.
  • Designing and contributing to build the most suitable policy tools to support and accelerate the implementation of this business strategy, valorizing the wide diversity of culture and economic models in Europe in this specific sector and laying down the foundations for a common European approach, with flexible and relevant tools developed and adapted to this diversity.

Yet, despite the efforts undertaken, especially through the Common Agricultural Policy, the sector has been struggling with recurring structural crises for almost three decades now. The impacts of these crisis have affected different regions in the EU, at different times and in different ways, depending on their production models.

In this context, it is more than urgent, on the EU market, to better valorize products, to build efficient meat supply chain focusing on modernization, structuration as well as viability and to cope with the challenge of market volatility and crises. While, on the Global market, to ensure effective promotion measures and a meaningful trade agenda, always bearing in mind the high sensitivity of the sector. The EU has definitively a key role to play as a supplier of safe and quality meat products. The option that the EU Commission included in the CAP proposals of structuring operational programs that can be opened to other sectors than those that benefited until now (wine, fruit and vegetables), in order to develop sectorial stratgies, will certainly play a role on top of notably current 1st pillar tools (decoupled and coupled payements). .

The EU beef sector clearly has the capacity to seize the growth opportunities stemming from the increase in beef meat global demand forecasts for the upcoming years.

However, the current market situation for bovine meat is quite worrying both in terms of economic and societal aspects.

Starting from the last years, a steady increase in slaughtering (linked to the difficulties experienced by the dairy sector), so a production increase, has affected producer’s prices consequently. Latest analysis (EU Agricultural Outlook 2017-2030) confirms that beef production remained stable in 2017, following the increased number of in slaughtering of heifers. However, the overview provided by the study shows that by the end of the outlook period (2030), beef production is expected to fall to 7.5 million t. Main drivers of this decrease are to be found in: lower consumer demand (internal market) and recent developments in the dairy and suckler cow herd, but at a slower rate than in 2005-2013.

The situation in Ireland, the Netherlands and Poland provides an overview of the ongoing economic developments.

In 2017, Ireland experienced 200,000 more cattle for slaughter than in 2015, in addition to a chaotic situation on traditional export markets (Russia, Turkey) and the sharp fall of the pound in the wake of the Brexit referendum in the UK, which is the biggest export market for Irish beef producers.

The same type of impact was faced by the Netherlands. This is due to the deliberate choice of the NL milk producers to increase the dairy herd in 2015 and 2016, ahead of the implementation of the new domestic regulation on Nitrogenous effluent release. As a consequence, at the end of 2016 data showed that there were already 160,000 more NL cattles for slaughter than in 2015.

On top of this, Poland appeared as a newcomer with strong ambitions in the sector. Because of the milk crisis and the strong competition of western milk producers, many polish producers are converting their milk herd into suckler herd. Between 2004 and 2016, the polish beef meat production register a 66% surged, Poland becoming the 7th EU producing country, exporting 90% of its national production. (Poland being traditionally a pig meat market).

Furthermore, another issue of concern is the surge of young calves from the dairy herd, which are not deemed as suitable for viable beef production system. One of the few options is to export them.

Accordingly, the links between dairy and beef sectors should be tackled thoroughly, since outlooks for the first one are positive, especially in terms of profitability.

The forecasted expansion of the dairy herd should not happen at a detriment of the specialized beef herd – According to estimates (DG Agri) almost 2/3 of the EU cow herd comes from dairy one.

At the same time, the beef sector is facing two communication challenges:

  • On one hand, some big EU competitors – in particular from South-America – are spreading the idea among EU consumers, via aggressive trade and promotion actions, that quality beef = non-EU meat.
  • On the other hand, activists are challenging beef meat consumption as such building their campaigns on misinterpretation of nutrition science and hard hitting animal welfare actions.

The EU should work actively against these two highly dangerous and false misconceptions and messages from both an economic and health point of view.

Old story but simple reality: ruminants like cows can digest plants that are indigestible to humans. They make available high amount of proteins for feeding people.

A certain number of ideas come up regularly in discussions at EU level and they could be definitely considered and evaluated as a possible basis for a successful European business strategy for the EU’s suckler herd. Specifically, on the basis of currently available information, and bearing in mind the challenges we can foresee, Farm Europe believes that the following could be key ingredients in a common European strategy, and that they could offer a starting point for a discussion on such strategy:

Market segmentation (ensuring production is demand-driven). The priority must be for the sector as a whole to reflect on remodeling its product offer, in order to make it clearer and closer to consumer demands. This implies a root and branch review of all the parameters that govern the sector, niche market, and supply chain dynamics – from breeds to industry organization, to the point of sale, including research, innovation, and market prospects for European beef products. On the demand side, suckler beef needs to be differentiated as a premium product as part of a comprehensive plan to segment the market and provide a means of surviving the damage caused by trade deals.

The long-term success of this approach remains on ensuring a more harmonious co-existence between suckling and dairy herds.

Three market segments seem to emerge:

  • A. Entry-level: mainly carcasses of culled dairy cows, but also entry-level cuts from suckling livestock of lower quality used for minced beef, processed products, entry-level cuts of beef ;
  • B. Mid-range: mainly consisting of suckling livestock, including, but not limited to, large, well-known and developed meat breeds such as Angus or Charolais (cow or YB meat depending on markets);
  • C. High end: productions anchored in terroirs, with a very high reputation potential, valued at all stages of the chain of production and marketing as an exceptional product. These represents signs of quality (PGI, labels, etc.).

The challenge is to develop economic coherence for each of these segments, both at the level of livestock systems and at the level of the sector, through research and innovation, but also through the promotion, organization and the transfer of value to producers.

  1. Research and innovation through improved animal genetics and by enhancing farming practices (in buildings, animal feed etc.), it is possible to make advances that will better satisfy consumer demand in terms of products on the market and societal expectations in terms of health, environment and animal welfare. Effective communication, information and decision should be science-based, with a clear commitment of all stakeholders in that respect (from economic actors to medias, from decisions makers to NGOs), while not discouraging research and innovation in this field.
  2. Structuring the sector will require two types of action:

a. greater coordination: between producers, processing and distribution.

It has become an absolute necessity to organize the sector, including coordinating at strategic market segment level or, when deemed relevant also at local producing regions’ level. This coordination should result in a fair return for the first stage of the industry’s supply chain – and an improved awareness across the whole chain in relation to consumer demands.

Such coordination must strengthen the industry’s ability to respond quickly and adapt its products to new opportunities, thereby creating value, and it must accelerate the take up of innovations across the whole sector. Coordination of the sector and its different markets and supply chains, should lead to the uptake of market segment strategies covering breeding and commercialization dimensions.

This enhanced cooperation within the supply chain would lead to an array of positive outcomes for all the actors: improve the production planning on the basis of market demand, organize information/awareness programs to the consumer, as well as product promotion activities/marketing, simplify the uptake of research and innovation for the sector and enhance the export capacity in foreign markets.

b. Firm-level re-structuring including farms and industrial firms (slaughterhouses) so that each partner in the chain is able to invest thanks to a fair level of profitability, develop the business sustainably, and be strong enough to play a full part in the devised strategy.

This firm-level and sector-wide re-structuring goal should (1) be managed taking into account the characteristics of each Member State (and also specific cost issues applying to firms) and (2) take into account the particular characteristics of producing regions in terms of their respective models (suckling, breeding, fattening, etc.).

This is a challenge that bovine meat sector has in common with other agricultural  sectors in intermediate and less favored areas. Therefore, there is undoubtedly a necessity to tackle this Common challenge.

In parallel, enhanced action should be pursued to encourage investments into bio-energies, which can both strengthen the viability of certain farms and contribute to climate change mitigation, aiming towards the life-cycle perspective, by linking production to existing farm resources.

      3. Commercialization. Effective communication systems and quality labels are needed so that consumers are made fully aware of advances in quality, the environment and animal well-being – and so that operators obtain a meaningful return on investment consistent with the market segment and the production infrastructure in place.

An enhanced communication effort should be encouraged in order to highlight the specific features of the EU livestock sector, in particular to differentiate it from feedlots of the American continent.

In Europe, structurally falling consumption makes it necessary to pursue offensive strategies to defend the positions of EU businesses relative to international competition in each of the three market segments, as well as to promote each cut of beef and each partner in the supply chain as effectively as possible by identifying the segment in which it or they would be most successfully marketed.

Marketing and discount sales strategies should moreover be managed so that beef is not a loss leader, and marketing truly focuses on selling surplus stocks; Prices in segment A do not drag prices down across the whole sector.

Internationally, real opportunities exist, especially with respect to live cattle, high-end products (segment C) and co-products.

Effective communication and marketing strategies need to be implemented for both the EU internal market and international markets. An ambitious export strategy should be stepped up, based on efficient tools acting as a lever to develop markets such well-targeted promotion actions.

—–

On top of the usual policy tools included in particular in the CAP, the European Union must mobilize its capacity to strengthen the sector, especially in order to anticipate the impact of trade negotiations that weaken the EU beef meat sector, already confronted with structural and recurring crisis.

Such revitalization plan should not be limited to a policy of budgetary transfers – even though their legitimacy must not be put into question (Coupled Payments, LFA payments). The European Union must go beyond these tools offering levers to structure, modernize and promote the EU suckler herd with the support of well-calibrated financial supports.

The objectives of the toolbox could be summarized as follow:

  • Organization, market segmentation and structuration:
    • Building a strong market-driven business strategy for the whole sector, based on clearly established market segments;
    • At local level: helping producers to invest and make money out of their work (organization, investment, including in bio-energies);
    • Building efficient meat supply chain (including via a proper competition policy and the extension of the milk package – see annex) and more innovative and modern slaughterhouses;
  • To cope with the challenge of market volatility:
    • Building tools, which are able to improve market resilience (ex: mutual funds) to limit the shock in the milk sector, which have in turn collateral effects on the specialized beef sector;
    • Coping with sanitary and climate risks, including taking into account grass land model which is an important carbon traps or fattening systems with climate-efficient feeding and effluent management practices;
    • Achieving greater coordination in the supply chain (between producers and other partners in the supply chain) with enhanced possibility to discuss and negotiate prices and volumes.
    • Setting European multiannual tool to manage extreme crisis; financing without delay exceptional measures to rebalance the market:
    • Triggering, when necessary, market management tools as it has been done for the milk sector in 2016. In certain cases, well organized mandatory storage action could be more easily set up targeting the dairy herd and taking into account the lower level of losses in relation with storage process, than products with higher value. For the suckler herd, possible measure of live storage on the farm might be explored, with the aim to rebalance the market temporarily, covering feed costs, etc.
  • To promote the EU model, its positives externalities and the effort already done in terms of sustainability and, especially, to highlight the viability and specific features of the European beef sector via adequate marketing tools and well-funded promotion campaigns.
  • To enhance private quality scheme and GIs systems: high quality beef could also move in this direction. The idea could be to develop new quality schemes or new criteria (on grass-fed beef for instance or other breeding practices that have a good impact on fat content) linking it with the idea of differentiation (mid-range market). Certain GIs could be developed, especially for the high-end segment. Quality schemes must be able to address consumers’ concerns as well as they could be developed in relation to animal welfare and industrial livestock production methods, while facilitating the marketing of the products.
  • To promote further the sustainability of the EU production systems (innovation, smart policy and consumer awareness), with well-designed climate actions.
  • To Increase and maintain the livestock sector competitiveness in each area (intensive livestock areas vs less developed areas).

EU standards need to be powerful at global level; However, in Europe we cannot forget entry-level products. The focus should therefore not be only on high-quality cuts. We need to be competitive also on these entry-level products which will have to face competition of non EU products and to segment very carefully the EU meat markets in order to limit the potential competition of non EU products on the other market segments.

Farm Europe strongly believes in the potential of the EU beef sector, both economically and in terms of sustainability, against the current pessimistic visions of the future combining de-growth and abandonment of land currently experienced by producers.

The think tank considers an absolute priority to invest and reflect on the future of this sector confronted with structural economic changes.

Of course, given the complexity of this sector, there is no magic wand. Nevertheless, the objective should be to capitalize on the assets of this strategic sector for many regions in Europe, not adopting a defensive approach. In other words, to focus on a true economic ambition for the future.

Implementation of the strategy should help to secure the internal market and reduce imports. Specifically, it is crucial for the European sector to retain control of the high added value segment, which makes it more necessary to have an ambitious strategy for the specialized sector – and consistency in the commercial strategy of the EU overall.

Measures exist within the current framework of the Common Agricultural Policy, which could be mobilized. Beyond that, a strong revitalization plan must be shaped at EU level.

Additional budgetary resources should be targeted on the key elements of an ambitious policy strategy, complementing existing tools, with the objective of leveraging and accelerating the structuring and modernization of the sector by offering to producers the right tools to build on their future. 


References

Research for AGRI Committee – The EU Cattle Sector: Challenges and Opportunities – Milk and Meat – February 2017

http://www.europarl.europa.eu/thinktank/en/document.html?reference=IPOL_STU(2017)585911

Report from the Commission to the European Parliament and the Council – On the impact of animal welfare international activities on the competitiveness of European livestock producers in a globalized world – Brussels, 26.1.2018 COM(2018) 42 final

https://ec.europa.eu/food/sites/food/files/animals/docs/aw_international_publication-report_en.pdf

Vandecandelaere et al. “Strengthening sustainable food systems through geographical indications – An analysis of economic impacts” FAO, Rome 2018

http://www.fao.org/3/I8737EN/i8737en.pdf

EY, Analysis on future developments in the milk sector – Prepared for the European Commission – DG Agriculture and Rural Development, Brussels, 24th September 2013

https://ec.europa.eu/agriculture/sites/agriculture/files/events/2013/milk-conference/ey-independent-experts-analysis-presentation_en.pdf

Press:

https://www.independent.ie/business/farming/news/farming-news/dairy-income-soars-as-beef-and-sheep-farms-survive-on-support-36937078.html

https://www.agriland.ie/farming-news/move-over-dairy-oatly-is-in-demand/

https://www.irishtimes.com/news/environment/irish-farming-under-pressure-to-reduce-carbon-emissions-1.3527011

https://www.euractiv.fr/section/agriculture-alimentation/news/de-nombreuses-filieres-agricoles-continuent-de-travailler-a-perte/

https://ec.europa.eu/info/news/final-figures-reflect-success-eu-milk-production-reduction-scheme_en

EU Dairy Farms Report based on 2013 FADN data. (2016). European Commission Directorate-General for Agriculture and Rural Development, Brussels.

Farm structure survey 2013. Key variables: area, livestock (LSU), labour force and standard output (So) by type of farming (2-digit) and agricultural size of farm (Uaa).

[1]Source: Research for AGRI Committee “The EU cattle sector: challenges and opportunities” – European Parliament – Policy Department B: Structural and Cohesion Policies, February 2017

http://www.europarl.europa.eu/RegData/etudes/STUD/2017/585911/IPOL_STU(2017)585911_EN.pdf

[2] Ibid.

[3] Link to CAP reform proposals: https://ec.europa.eu/commission/publications/natural-resources-and-environment_en

[4] EU budget legal texts available here: https://ec.europa.eu/commission/publications/factsheets-long-term-budget-proposals_en

[5] A decrease between 16 and 20% in constant prices.

[6] Study available here: http://www.agri-outlook.org

[7]Source: https://ec.europa.eu/info/sites/info/files/food-farming-fisheries/farming/documents/agri-short-term-outlook-summer-2018_en.pdf

[8] Source: https://ec.europa.eu/agriculture/milk_en

[9] For updated figures see here: https://ec.europa.eu/agriculture/market-observatory/milk/latest-updates_en

[10] DG Agri estimates based on World Bank (https://ec.europa.eu/agriculture/sites/agriculture/files/statistics/facts-figures/price-developments.pdf)

[11] Document available here: https://ec.europa.eu/info/sites/info/files/food-farming-fisheries/farming/documents/agricultural-outlook-2017-30_en.pdf

[12] Source: https://ec.europa.eu/agriculture/sites/agriculture/files/market-observatory/milk/pdf/market-situation-presentation_en.pdf

[13] Source: DG Health and Food Safety – Overview report – Welfare of Cattle on Dairy Farms, 2017, DG(SANTE) 2017-6241

[14] Source: https://ec.europa.eu/agriculture/milk/policy-instruments_en

[15] See here: http://www.consilium.europa.eu/en/press/press-releases/2018/01/29/skimmed-milk-powder-council-modifies-rules-on-public-intervention-to-help-the-market/

[16] Source: ZBIGNIEW Gołaś DOI: 10.5604/00441600.1245843 University of Life Sciences
Poznań Problems of Agricultural Economics 3(352) 2017, 19-40

[17] With a linear causality between farms’ characteristics with their margin, except for cow herd size.

[18] Source: http://www.fao.org/3/a-BT100e.pdf

POLITICAL NOTE A cereals sector ready to meet its challenges

Summary

Cereal production in the European Union has boomed thanks to the Common Agricultural Policy and has become today the third largest in the world with 306 million tones expected in 2018 or 14.6% of global production.

Presented on the international market – with 33.5 million tones exported or 11% of its production – in a context of increasing demand (due to cereal consumption up 40% in 15 years) this production is currently not in a “comfortable and installed” posture.

Competition in traditional international markets has been fierce since the recent boom in exports in the Black Sea region with stabilizing at 60 million tones or 1/3 of world trade. Challenges are also present within the EU, starting with stagnant yields in the West, the impact of regulation on plant protection products and the pressure of climatic hazards such as historical drought this summer.

For the industry to avoid stalling and to overcome these challenges multiple levers of action are available. Adopting a digitized grain farming will optimize the environmental and economic performance of grain farmers. Establishing a European crisis management fund in agriculture that efficiently provides for and generalizes climate insurance will make it possible to deal with the consequences of climate change and the high volatility of the markets. Abandoning tillage and adopting direct seeding could support the agronomic and economic performance of cereals as long as the technical means are or remain at the “rendezvous”.

In such a context, the value chain must be able to rely on a CAP that better protects farmers’ income in a context of high price volatility and that further supports investment in innovation for a transition to successful models. This note presents the challenges and recommendations for modernizing the industry and shaping a CAP with strong common tools coupled with the necessary and targeted flexibilities to build an ambitious strategy that effectively articulates community tools and national or regional actions.


Table of contents

I – The European cereals sector: characteristics and challenges…………………………… 1

A Panorama of the European industry………………………………………………………………….. 1

a/ General data…………………………………………………………………………………………………. 1

b / Importance of the sector for the competitiveness of the livestock and ethanol sectors    3

B External challenges……………………………………………………………………………………………. 3

a / The rise of Ukraine……………………………………………………………………………………….. 3

b/ The Russian boom…………………………………………………………………………………………. 4

c/ Global demand, the challenge of food security……………………………………………… 5

C Internal challenges…………………………………………………………………………………………….. 6

a / Lower income of farmers……………………………………………………………………………… 6

b / Volatility of the market……………………………………………………………………………….. 7

c / Climatic risks……………………………………………………………………………………………….. 7

d / Availability of plant protection products…………………………………………………….. 8

e / Environmental sustainability and crop yield………………………………………………… 9

f / Current reform of the CAP…………………………………………………………………………….. 9

II-Succeed in a fierce competition……………………………………………………………………… 10

A Market expectations……………………………………………………………………………………….. 10

a/ Becoming a global leader in the world again………………………………………………. 10

b / Do not lose weight on the EU market…………………………………………………………. 11

B Action levers……………………………………………………………………………………………………. 12

a / The digitalization of agriculture…………………………………………………………………. 12

b / Insurance tools for managing volatility, European fund for major crisis management in agriculture.         12

c / Genetic improvement to meet societal expectations and adapt to climate issues                 13

d / Cultural methods……………………………………………………………………………………….. 13

e / Logistics aspects: storage and transport………………………………………………….. 14

III- Conclusion: a winning strategy for the EU cereals industry………………………… 15

A The first pillar………………………………………………………………………………………………….. 16

B The second pillar……………………………………………………………………………………………… 17

C Outside the pillars…………………………………………………………………………………………… 18


I – The European cereals sector: characteristics and challenges

A Panorama of the European industry

a/ General data

State of play in 2017 – 2018  

Considering together the three main cereals produced – namely wheat, barley and grain maize (85% of EU cereals production in 2016) – the European Union, with a production of 275.2 million tones or 14% of world production, ranks third behind China and the USA. Almost 48 million hectares are cultivated for this purpose, representing 27% of the EU’s UAA. 33.4 million tones will be exported during this year or almost 1 tone of cereals out of 8. The economic weight of cereal production is about 46.8 billion euros.

With 151.2 Mt of wheat (hard and soft), the EU is the world’s leading producer ahead of China and Russia. 27 million hectares are cultivated, with an average yield of 5.6 t/ha (soft wheat). 24.4 million tons will be exported during this year.

The EU is also the world’s largest producer of barley, at 58.8 Mt, ahead of Russia and Australia. 12.3 million hectares are cultivated, with an average yield of 4.8 t/ha. 8 million tones will be exported during this year.

Finally, for maize, with a production of 65.2 million tones, the EU ranks fourth in the world, behind the USA, China and Brazil. 8.6 million hectares are cultivated, with an average yield of 7.6 t/ha. 1 million tones will be exported during this year.

Trends since 2000

From 246 tones to 277 million tones (Mt), European cereal production – wheat, barley and maize – increased from 12.5% in the EU to 28. Cropping decreased by 2.2 million hectares (-4.5%), but average yields increased by 1.25 t/ha (+ 25%). It is in Central European Member States (EU-13) that this increase has occurred with an average of 92.5%. While this increase was only 5.6% on average in Western Europe (EU-15). As for exports, they rose – between 2012 and 2017 – from 28 Mt to 33.5 (+ 21%), or from 13.5% to 12.1% of production.

Since 2000, European wheat production has risen from 133.4 Mt to 152.3 Mt (+ 14.2%), and the area decreased from 26.8 million hectares to 26 million hectares (-3%). Average yields increased from 5.3 to 6.1 t/ha (+ 14%) but this hides a clear disparity. Yields (soft wheat) stagnated in the EU-15 (from 6.7 to 6.8 t/ha (+ 1.5%)) and strongly increased in the EU-13 (from 3.2 at 5.1 t/ha (+ 59%)). As for exports, they increased from 19.2 to 23.5 Mt (+ 22%) between 2012 and 2017.

Since 2000, barley production has stagnated, falling from 60.3 to 59.3 Mt (-1.7%), on areas that declined by 15%, from 14.2 to 12.1 million hectares. Yields increased by 15.3%, from 4.25 to 4.9 t/ha with a strong geographical disparity again. They stagnated from 4.8 to 5 Mt (+ 4.2%) in the EU-15 and grew from 2.5 to 4.4 Mt (+ 76%) in the EU-13. The volume of exports also increased, from 10.4%, from 6.7 to 7.4 Mt (2012-2017).

Finally, maize has experienced the highest growth over the period in the EU. Although the surface area decreased by almost 14%, from 9.7 to 8.4 million hectares, the volumes produced and exported grew strongly, respectively by 24.6% – from 52.7 to 65.5 Mt. – and 45.4% – from 1.8 to 2.6 Mt – thanks to the clear improvement in yields, from 5.4 to 7.8 t/ha (+ 44%). Here again, yields in the EU-13 rose the most, from 2.6 to 6.3 t/h (+ 142%), while growth was 11% in the EU-15, from 9.1 to 10.1 Mt.

b / Importance of the sector for the competitiveness of the livestock and ethanol sectors

With 157.4 million tones consumed in 2016-17 (57% of production), cereals produced in the EU rank first in the protein diet of the EU livestock sector (59%). This is followed by 84.1 million tones of co-products from cereals and oilseed crops (31.5%) and 18.3 million tones of imported cereals (6.9%).

Note: Of the 84.1 million tones of co-products, 18.3 million tones (22%) were soybean meal imported from North and South America.

Of the 25.8 million tones of feedstock consumed by the ethanol industry in 2016-17, cereals produced in the EU accounted for 13.2 million tones (51%) and sugar beet 12.6 million tones (49%). 4.5% of European cereal production was consumed by the ethanol sector.

B External challenges

The Black Sea Basin has grown considerably over the past five years, with Ukraine and Russia in the lead, currently accounts for 1/3 of world grain trade (60 million out of 180 tones).

a / The rise of Ukraine

After a collapse following the dismantling of the USSR, Ukraine is on its way to becoming Europe’s “bread basket” again. Indeed, the reforms of its agricultural sector now give Ukraine the means to fully exploit its considerable natural advantages.

First of all, there is the remarkable fertility of the famous “black soils” or “chernozom”, which is rich in potash, phosphorus and trace elements due to a high percentage of humus. In addition, there is a notable topographical advantage – very large cultivable plains that account for 90% of the national surface – and a favorable climate for growing cereals. The Useful Agricultural Area (UAA) amounts to 70% of the territory, i.e. 42 million hectares

After that, there is the considerable effort made to restart the production apparatus.

The independence of Ukraine in 1991 was accompanied by a dismantling of the Soviet apparatus that had fallen into disuse followed by a complete collapse of the agricultural production apparatus. In 1999, a law laid the foundation for renewal, allowing the almost total liquidation of collective farms and the first steps towards land privatization. Very low annual rents, a very favorable tax system for agricultural enterprises was established in 1998, virtual VAT exemption in 1999, and panoply of state aid to Ukrainian farms attracted foreign investors. In Ukraine, low production costs can be found (2 to 3 times lower than France for example) in particular thanks to very low fixed costs and regulations on the use of pesticides that are less stringent than those of the EU.

The increase in volumes produced and exported has also been facilitated by joint support from FAO and the EBRD. This has facilitated dialogue between the public and private sectors, and the creation of a more favorable political environment for the arrival of foreign investors. This joint support has also trained many Ukrainian farmers for a better crop protection management and improved crop storage.

Finally, the decline in the national consumption of cereals in recent years increases the volumes available for export. The maritime facades on the Black Sea and the Sea of Azov favor the export activity.

This is a real agricultural revolution that the country has been experiencing for 20 years, and which led in 2009 to the world leader in barley and sunflower exports, in 2nd place for rapeseed, 4th in maize, 6th for wheat and 8th for soybeans. Since 2010, cereal production has increased 55% to 64 million tones in 2017 (26 of which are wheat) and exports 284%. 50% of the volumes exported are destined for Asia, and 30% of the EU, with which Ukraine has concluded an association agreement that came into force in September 2017. It should be noted, however, that this country, like Russia whose evolution is analyzed below, is particularly subject to the impacts of climatic hazards, generating very large variations in the quantities produced from one year to the next.

b/ The Russian boom

Russia’s agriculture is also booming. Here too, it is based on natural assets. The western part of this “state-continent” is a vast plain, where black soils are also present, especially in the southern part. But if Russian agricultural production has exploded in the last 3 years, it is mainly due to political will. Following the economic sanctions of the United States and the EU on the Russian energy sector in 2014, Russia responded with sanctions on a wide range of imported food products. The sanction extended to Turkish food commodity after the destruction of a Russian aircraft in Syria. The sanctions were accompanied by the announcement of the national goal of food self-sufficiency by 2020.

To achieve this goal, local and foreign investments are greatly enhanced by tax incentives. Modern technologies, the supply of machinery and fertilizers has been widely deployed. In addition to having exceeded the US harvest quantitatively since 2015, Russian wheat production is favored for export by higher protein content. This is due in particular to the variety breeding efforts in Russia, to obtain nowadays winter wheat varieties adapted to the rigors of the climate and having a protein content of up to 15 to 18% while maintaining yields high of the order of 100-120 q / ha.

The available space is also an asset for Russia to reach its goal of food self-sufficiency. It has undertaken the recapture of millions of hectares of agricultural land abandoned since the fall of the USSR.

The results are clear: the amount of Russian wheat exports in 2015 was $ 20 billion. At the same time, the share of EUA in the international wheat market increased from 50% in the 1970s to 15% in 2017. And Russia reduced its international food purchases by 40% between 2013 and 2015.

Initially estimated at 85 million tones, the 2018-19 Russian wheat crop will be smaller but still expected to reach 70 Mt, and exports 35 million tones.

c/ Global demand, the challenge of food security.

The food crises, that the world has experienced since 2007, and the already recognized impacts of climate change have reminded us that the food issue does not belong to the past but that it is a current issue that organizations such as FAO regularly and consistently recall.

This must be a topical concern for the European Union, which must be to:

  • produce to ensure sufficiently effective independence for European citizens;
  • produce responsibly and sustainably in a world where natural resources are fragile and limited. Responsible: by refusing to outsource to other parts of the world our resource management duties. Sustainable: because we are indebted to future generations for their ability to feed themselves and evolve in quality spaces;
  • contribute to global food security by both developing regional agriculture through development policy and being a reliable supplier of global markets. Indeed, as the only major agricultural area in the world with relatively stable production conditions, the European Union has a special responsibility: to contribute regularly to the supply of structurally demanding global markets. And all the more so because the stability of world markets is a decisive element:
  • the development of agriculture in less developed regions in an open world.
  • the geopolitical stability of structurally deficit regions by their ability to provide their populations with sufficient and affordable food
  • the ability to help limit migration crises.

The European Union and its agricultural sectors must put themselves in a position to respond in a sustainable way to the increase in global demand for food and particularly in the case of cereals intended for human consumption, which is an unavoidable and often basic source of food for whole regions, but also to have the capacity to be present in the other market segments where demand is growing (starch plants, malting plants and animal feed). It is an economic responsibility and also a major political responsibility as well.

C Internal challenges

a / Lower income of farmers

Several factors are responsible for the decline in income experienced by EU cereal producers in recent years.

First, there is the influence of global market parameters. In the case of soft wheat, the world supply is slightly above demand since 2015, which leads to low prices in the face of production costs and to compensate producers. The low yields in the EU this year (2017-18), but also in Russia, Australia and the United States, reversed the trend and therefore allowed the price of common wheat to rise to more than 200 euros per tone in Rouen.

At the same time, the cost of growing cereals has increased, mainly due to plant protection products. In some Member States, this expenditure item has increased for farmers by 40% in 20 years because of higher and higher certification costs, and increasing taxes for diffuse pollution.

The increase in the cost of energy as well as the need for more and more precise equipment and sophisticated equipment are added.

With regard to Community aid, the decrease is first of all due to a progressive erosion of the value of direct payments in recent years, accentuated in the Member States, which have made the choice to transfer large amounts of aid from the 1st towards the 2nd pillar. Grain farmers are also affected by the choice of Member States to opt for CAP extra-decoupled subsidies for the first hectares, which particularly impacts large farms in intermediate zones with an already fragile economic balance.

b / Volatility of the market

A few years ago, the cereal market could be described as “flat” and relatively predictable. The prices reacted especially to the jolts of the weather. Increased demand, higher oil and freight costs and financial markets have increased their share of volatility. As for the jolts of the weather, they are now more frequent with larger amplitude due to global warming and stronger reactions from largely financialized markets.

Price variations are now characterized by their suddenness and brutality. From about 15 euros per ton over a campaign, the range can now exceed 100 euros per ton.

c / Climatic risks

Current climate change is causing an increase in the frequency of “extreme events”, whether it is to be precipitation, temperature, or unusual winds. For agriculture, this usually results in reduced yields and greater variability of these.

Cereals, particularly durum wheat and winter barley, are particularly subject to the phenomenon of lodging, which the stormy or beating rains favor, and which causes a loss of yield, a decline in grain quality and an extension harvest time.

Unusually heavy rainfall causes the soil to become saturated with water, disrupting the extension and functioning of the root system.

On the other hand, yields are also impacted by drought, especially in areas where soils are superficial with little useful reserve, and during cereal run-off. The drought in part of Europe in the summer of 2018 is an example.

Faced with these growing threats, farmers are currently deprived, especially because of a development that remains low on climate insurance.

d / Availability of plant protection products

Like any crop, cereals require protection against pests, whether they be micro or macro organisms, and to promote weed cultivation. But farmers are now facing a scarcity of approved substances, an increase in pressure due to climate change and therefore face the challenge of finding effective alternatives quickly.

With regard to insecticides used to protect crops, the current challenge for farmers is the neonicotinoid class, which has been widely disseminated since the discovery in 1985 of imidacloprid. These insecticides have taken the place of organochlorines and organophosphorus such as DDT and have become the most used insecticides in the world because (being used mainly in seed coating) prophylactically they prevent the spread of aerial spraying. But because of their low biodegradability and toxicity to insects, they are concentrated in food webs and are mentioned as a cause of death in pollinating insects. EFSA confirmed this danger in its conclusions in February 2018 for three types of bees evaluated.

On 27 April 2018, the majority of European Union states voted to ban three neonicotinoids (clothianidin, imidacloprid and thiamethoxamur) from 2019 for all field crops in the EU with the only exception is greenhouse use.

The cost of banning neonicotinoids for rape cultivation in the EU has recently been estimated at 900 million euros per year. On wheat and barley, imidacloprid makes it possible to avoid yield losses of the order of 20 to 30% caused by dwarfing jaundice.

Regarding the herbicides used for grain farming, the main subject is related to the debates that exist on glyphosate. While the license to exploit the molecule (discovered in the 1950s) came to an end in December 2017, Member States voted in November for a five-year extension. In October 2017, the European Parliament voted – in a non-binding manner – to phase out glyphosate by 2022.

To this day, such a ban would push most European farmers to use more expensive and sometimes more dangerous herbicides, and return to weeding through tillage with its environmental consequences. The extra cost would be real. The average use of this product is for Belgium of 1.81 kg per hectare

and 1.56 kg for the Netherlands against the 1.10 kg for France or the 1.00 kg for Germany. For comparison, the extra cost has been estimated for French agriculture at 2 billion euros per year.

e / Environmental sustainability and crop yield

In agriculture, the main compartments of ecosystems concerned by sustainability are cultivated soil and water.

Some soils in cereal areas in the EU suffer from subfertility[1]. Several causes are cited to explain this trend, such as shorter rotations, decreased use of organic amendments, excessive nitrogen inputs, which favor organic carbon mineralization, and deep plowing, which disrupts microbial life in the soil therefore the synthesis of nutrients available to plants. In 2008, the European Commission estimated that 45% of European soils had a very low organic matter content, with less than 2% organic carbon, in southern European countries, but also in France, the United Kingdom, Germany and Belgium[2].

In several EU cereals countries, particularly the EU-15, cereal yields have at least stagnated over the past 15 years. In this respect, there are more hypotheses than certainties. The reconversion of good cereal lands into urbanized areas, and at the same time, the reversal of grasslands in areas less optimal for cereals is a hypothesis. The depletion of some soils in organic carbon is another[3].

The use of herbicides for the control of weeds is receiving increasing attention because of the risk of runoff from these surface products. [4]

f / Current reform of the CAP

In the context of a decline in the profitability of the sector, the budgetary and reform proposals of the CAP accentuate the threats to the cereals sector. They would cumulatively result in an average decline in European farmers’ income of between 16 and 20%. On one hand, the impact of the 12% drop in the CAP budget (constant euros) would cause a drop of more than 8% in the Community average income, with particularly strong negative effects for the arable crops sectors, where Direct payments represent a significant part of income. For the cereals and oilseed crops sector, the Commission’s impact assessment estimates a 6% drop in income in the case of a 10% reduction in income support. On the other hand, according to the European Commission’s own admission, in its impact study, the reform proposals presented on 1 June would generate an additional drop of between 8 and 10% of agricultural income according to the options chosen by the Member States.

Such a strategy would inevitably lead to the exit of farmers with the abandonment of territories especially in intermediate zones, as well as an expansion of farms. It would slow down investment capacity and generational renewal, despite the tools proposed for young farmers who could not compensate for the decline in income announced elsewhere.

As for the new implementation method proposed in the reform of the European Commission, such an evolution – which opens the way to a renationalization with a major transfer of responsibility for the first pillar to the Member States – would severely put in competition their regulatory frameworks with of course advantages, in terms of competitiveness, for the less-involved in environmental matters. This development would also be a shift from the CAP towards a programming mainly managed in a bilateral relationship between national agricultural administrations and the services of the European Commission instead of the direct relationship between EU co-legislators and its beneficiaries, farmers.


II-Succeed in a fierce competition

A Market expectations

a/ Becoming a global leader in the world again

While competitors in the Black Sea are in full conquest of grain export markets, particularly with regard to the first grain exported, namely wheat, the European Union has fallen sharply over the past three years. All cereals combined, its exports fell by almost 30%.

The share of soft wheat of EU origin in imports fell by 19% in Morocco, 49% in Cameroon and 52% in Senegal between 2015-16 and 2016-17.

For EU cereal producers, if there is indeed a challenge in terms of grain quality, linked to the requirements of bread making, a substantial challenge lies in the quest for increasing competitiveness. Indeed, lower protein and gluten levels of EU wheat can be inexpensively corrected in importing countries. It is in fact by their very low prices that make the difference for the Russian and Ukrainian producers and the very quickly gained export markets. The challenge is such that, in order to be raised, it requires an increase in yields by EU producers and a reduction in operating expenses.

b / Do not lose weight on the EU market

The first consuming area for cereals of EU origin is the European Union itself. There is therefore also a strong challenge of competitiveness of EU cereals within itself. And this challenge is increased tenfold by the external supply more and more abundant and quality.

The EU imports of all cereals have increased by 137.5% between 2009-10 and 2016-17.

The competitiveness of European cereals in the EU market itself inevitably raises the question of the rules applying to imports.

The European Union has adopted one of the highest standards in the world in terms of both social and environmental rules. What about imports?

To be positive, the opening of Community markets presupposes that the same rules apply to European productions and imports. It is certainly true of the relative competitiveness of European farmers and the respect of European Union consumers who legitimately believe that imports accepted on the European territory present an equivalent level of requirements.

However, it must be noted that this is not the case. The example of imported organic products is striking. Recent cases in the animal sector for South American products are in mind. In the plant and cereals sector, divergences in authorized or unauthorized cultivation routes, authorized or unauthorized varieties …. tend to be accentuated, while in parallel trade negotiations lend little or no attention.

B Action levers

a / The digitalization of agriculture

In order to gain competitiveness and sustainability with an increase in yields accompanied by a reduction in their operating costs, EU grain growers have a privileged solution: the digitization of agriculture.

Digitization of agriculture is a way to optimize the use of treatments on crops. The aim is to use digital technologies and geolocation to better characterize the soils of the farm and to take into account intragroup heterogeneity thus bringing “the right dose of inputs-water, fertilizers, phytosanitary products – to the right place and at the right time”. Among the inputs, phytosanitary treatments in particular have high costs both economically and environmentally. It is therefore an absolutely central position to achieve the dual performance objective of farms.

Studies in a network of farms on wheat and maize are already showing tangible and promising results in terms of benefits per hectare (from 80 to 200 euros/ha) and reduction of inputs (from 30 to 70 %) (Leader Farms, InVivo). In Greece, an experiment carried out on 9 pilot sites – 3 devoted to arboriculture and 2 to arable crops – estimated that the average savings achievable for plant protection products could reach 63%.

 b / Insurance tools for managing volatility, European fund for major crisis management in agriculture.

In the context of the current CAP reform, there is no further progress in the tools needed to ensure the resilience of farms in the face of climate hazards. The advances offered by the Omnibus – the loss rate for the triggering of mutual funds and climate insurance increased to 20% (instead of 30%), and the co-financing of premiums increased to 70% (instead of 65%) – are recent and are hitting on the national budget trade-offs of CAP means to allocate or not to risk management. This management must become a priority to effectively ensure the economic resilience of farms.

The reform of the crisis reserve to make it multiannual and thus more operational is proposed, but no sufficient means are foreseen to constitute a fund with sufficient resources. There is also an important gap that the Community legislator has to fill.

The establishment of a European Crisis Management Fund in agriculture, financed by an adequately equipped multiannual crisis reserve, must be carried out in order to reduce the cost of reinsurance for climate insurance and take over IST tools from the outset when risks become deep crises (see related Farm Europe note).

At the same time, the next CAP should recognize the value of encouraging farmers to set up precautionary savings. If the tax incentive related to such a device is the responsibility of the Member States, it would be appropriate for the CAP to hold at the level of the European Union what constitutes legally and in accounting such precautionary savings, as well as some basic principles for simple use of this savings.

c / Genetic improvement to meet societal expectations and adapt to climate issues

In the late 1960s, a wheat-breeding program aimed at replacing fungicide treatments with through the use of disease-resistant varieties has increased the genetic diversity of wheat by introducing resistance to rust and trampling.

Today, the selection work focuses on a global approach to hardiness, by working on resistance to diseases, on a better valorization of the available nitrogen, on the competitiveness vis-à-vis weeds, or the tolerance to drought.

In terms of the methods available to carry out the improvement work, the possibility of using new breeding techniques in the EU remains a subject of question to which the Commission and the co-legislators must have the courage to harness following the reading of the current regulation made by the Court of Justice of the EU in late July.

d / Cultural methods

Cultural practices and especially tillage are a way to try to regain growth in yields. A meta-analysis published in October 2017, based on work conducted in 62 regions, has confirmed worldwide that non-tillage generates more microbial biodiversity itself allowing a better fertilization of the soil in assimilable mineral elements by the plants[5]. Another study, conducted in Switzerland from 1994 to 2004, revealed significantly higher yields of pulses and cereals in direct seeding[6].

However, no-till requires management of weeds and the destruction of the majority before planting, otherwise farmers will feel the need to return to deep plowing.

e / Logistics aspects: storage and transport

Every week, around 4 million tones of cereals and oilseeds worth € 1 billion circulate in the EU. Hence the importance of ensuring optimal storage and transportation of these goods, in order to avoid supply shortages and increased price volatility.

Storage

Less than 15% of the cereals produced are self-consumed on the farm. Everything else is marketed to downstream companies, be they processing or exporting, and so it depends on the collection and storage centers. Storage is an essential link in the logistics chain that enables the EU to play its role in stabilizing the world’s food supply.

Storage capacity for COPs in the EU increased by 20% between 2005 and 2015, reaching 359 million tones, while production increased by 11% to 346 million tones. However, a risk remains in places, calling for necessary investments. They are all the more necessary, as price volatility requires strategic management of stocks and therefore increased capacity. In Central Europe, deficits faded (by 3.9 Mt in Poland), turned into a surplus (of 5.3 Mt in Romania), and even overcapacity increased (in Hungary and Bulgaria). In Western Europe, only Spain managed to obtain a substantial capacity surplus (3 Mt). It is in Denmark, the United Kingdom and Germany that capacity deficits have deteriorated the most.

To address bottlenecks, the appropriate location of additional storage capacity (eg in key transport hubs or export terminals) and access to an adequate logistics infrastructure are of critical importance. Access to public funds more diversified than only those of the EAFRD appears necessary for this.

The transport

Roads, railways and inland waterways play different roles in the transport of COPs, and are often combined. For the three types of transport and the four main traffic corridors of the COPs (Rhine-Danube, Rhine-Alps, Baltic-Adriatic and North Sea-Baltic Sea), bottlenecks persist.

The improvement of the channel conditions of inland waterways, especially along the Danube – 18 bottlenecks have been identified – presents important investment opportunities, especially so that the growing Romanian, Hungarian and Bulgarian productions are better valued. Future investments should also focus on improving the interoperability of railways in order to improve efficiency and reduce waiting times in cross-border terminals, particularly in Germany and Austria. Future investments should also aim at improving regional transport connectivity, to address congestion problems on motorways and railways by extending capacity to critical locations and sections – such as Alpine crossings to Italy – and the construction of bypass routes.


III- Conclusion: a winning strategy for the EU cereals industry

European agriculture faces common challenges that can only be solved effectively if Europe is united.

Community coherence in financial support tools for farmers and related environmental objectives is therefore essential. On one hand, it makes it possible to avoid a competition, which would turn to the advantage of the less attentive as for the respect of the environment. On the other hand, it avoids the concentration of aid on targeted sectors in order to compete with these sectors in the other Member States.

The excessive level of subsidiarity and flexibility, the fragmentation of the policy framework, as well as a reduced level of ambition with regard to the CAP budget, is all elements that could transform the EU agricultural market into a battlefield. This one would see 27 different agricultural strategies to be measured between it, or even to face each other.

With the adoption of the European Parliament’s report on the Future of the Common Agricultural Policy on 16 May 2018, MEPs opted for a balanced approach calling for a “reasonable level of flexibility within a strong common framework of rules, the basic standards, intervention tools, controls and financial allocations agreed at European level by the co-legislator to ensure a level playing field for farmers”. They stressed the need to secure the direct relationship between EU co-legislators and beneficiaries – farmers – and not to transfer most of the management of the first pillar to the Member States.

The winning strategy for the EU cereals industry must keep this solid base at Community level, within the first pillar, while retaining the necessary flexibility for adjustments at local level.

This winning community strategy, driven by the CAP, should be the ambition to take all European agriculture towards double performance over the next 7 years.

Recommendations, based on different challenges and aiming to embody the dual performance in the CAP are presented below.

A The first pillar

Recommendation n°1

The guarantee of a minimum of 60% of the first pillar (before transfer) devoted to the financing of basic decoupled aids is a necessary measure in the face of the challenge of the fall in cereal income, given the importance of CAP aids in income cereal farms. Without this, cereal area risks falling sharply – up to 7% according to the Commission’s impact study – in favor of a reallocation to other crops or even an agricultural abandonment.

Recommendation n°2

The creation and the adequate endowment of a multi-year crisis management fund is a key point, alongside climate insurance, ISTs and precautionary savings to effectively meet the challenges of climate change and price volatility.

Recommendation n°3

Promoting digitized agriculture in the first pillar, by including a lump-sum incentive for the transition to dual performance in the Eco-Scheme, should be a priority of EU agricultural policy. This means should be favored to achieve double performance and thus meet the following three challenges: that of export competition on the globalized market, the gains in competitiveness obtained, environmental sustainability and regulatory pressure on phytosanitary products by optimizing inputs.

Recommendation n°4

Recognize within the first pillar the actions taken in the field of agro-ecological transition of farming systems that maintain and develop the production capacity of the European Union.

B The second pillar

The second pillar of the CAP should be mobilized as a priority to support the investment and training of farmers engaged in the transition of dual performance.

Recommendation n°5

Prioritize the mobilization of MAEC, investment and training tools – within the second pillar – farmers making the transition to double performance. This is a prerequisite for a broad expansion of digital agriculture. Such a technological revolution can only occur with human accompaniment at the height of the changes. 

Recommendation n°6

Recognize complementarity and the necessary balance between the environment and the economy in the 2nd pillar of the CAP by adopting a double rule of at least 30% of the funds towards environmental measures (measures in favor of less-favored areas included) and at least 30% of 2nd pillar’s funds towards economic measures (investments, training, advice, risk management).

Recommendation n°7

The allocation of insurance tools for climate risk management and Income Stabilization Tools must be a priority for the Member States in their implementation of the CAP, to face the challenge of increasing price volatility, as the financialization of markets and climate hazards favor.

Recommendation n°8

The introduction of strong measures in the second pillar in favor of development investments for varietal improvement of cereals, for innovation investments in digital technology, robotics and bio-control, is a measure complementary to cope with climatic hazards.

Recommendation n°9

The promotion of cooperation between the actors of the cereals sector and the public authorities in the Alps, the Danube and between France and the Benelux is necessary to solve the logistical challenges that threaten the flow of cereals.

C Outside the pillars

Recommendation n°10

Maintaining the CAP budget allocation at the current level of the EU-27 is an essential measure to participate in the construction of a strong and competitive European cereal agricultural sector and effectively addressing the challenges of sustainability with the digitization of agriculture and an adequate management of risks and crises.

Recommendation n°11

As a prerequisite to any commercial agreement, put the requirement of respect for European rules and production standards (environmental and social) by imported products.

Recommendation n°12

Revisit Directive (EC) 18/2001 in the light of scientific developments since 2001 in terms of varietal selection and clearly define, on a scientific basis, the legal framework to be applied to traditional techniques of mutagenesis, to transgenesis techniques (GMOs) and new techniques of site-specific mutagenesis.


The table below summarizes the challenges facing the industry and the subsequent Farm Europe recommendations.


Challenges Recommendations
-Lower grain income 1– To devote at least 60% of the first pillar to the funding of basic decoupled aids
-Climatic hazards

-Volatility of prices

2- Set up a European multiannual crisis management fund for agriculture
-Competition for export

-Environmental sustainability

-Pesticides

-Grain income drop

3- Promote digital agriculture by including in the first pillar a flat-rate incentive for the transition to dual performance through the Eco-Scheme
-Environmental sustainability

-Grain income drop

4- Recognize in the first pillar the actions taken in terms of agro-ecological transition of farming systems
-Competition for export

-Environmental sustainability

-Pesticides

-Grain income drop

5– Prioritize mobilization of MAEC, investment and Pillar 2 training tools for farmers transitioning to dual performance

6– Devote at least 30% of the 2nd pillar to economic measures (investments, training, advice, risk management).

-Price volatility 7- Financially endow the insurance tools for climate risk management and second pillar Income Stabilization Tools
-Climatic hazards 8- In the second pillar, put in place investments in research and development for varietal improvement of cereals
– Logistics 9– Promote co-operation between Cereals and public authorities in Alpine and Danube MS + complete the Seine-Nord Canal
– Lower grain income 10- Maintain CAP budget allocation at current EU-27 level
-Environmental sustainability

-Grain income drop

11- Put as a prerequisite to any commercial agreement the requirement of respect for European rules and production standards
-Competition for export

-Environmental sustainability

-Pesticides

-Grain income drop

-Climatic hazards

12- Revisit Directive (EC) 18/2001 in light of the scientific developments since 2001 in the field of varietal selection


[1] Some soils lost up to 2 gr / kg / year between 1978 and 2003. Report The State of soil in Europe, European Environment Agency, 2012, pages 13 and 14

[2] Report The State of soil in Europe, European Environment Agency, 2012, page 10

[3] Agreste Primeur, Number 210 – May 2008

[4] “In metropolitan France, the molecules found in groundwater and rivers are mainly herbicides. They alone accumulate more than 80% of the detections in the streams! »Phytosanitary guide, Edition 2017.


[5] Stacy M.Zuber, María B.Villamil, Meta-analysis approach to assess effect of tillage on microbial biomass and enzyme activities, in Soil Biology and Biochemistry, Volume 97, June 2016, Pages 176-187

[6] Andreas Chervet et al., Soil performance and parameters after 20 years of direct seeding and tillage, Swiss Agricultural Research 7 (5): 216-223, 2016. The organic carbon content in the topsoil was significantly higher in direct sowing only in plowing.