Policy briefing Beef & Dairy Sectors: Sectorial strategies to secure economic dynamism in the EU cattle sector


September 2018

Executive Summary

In the European Union around 3.6 million farms belong to the EU cattle sector, which represents the 17% of all EU farms. In merely economic terms, these holdings contribute one third to the total EU agricultural gross production value, utilize one third of EU agricultural land and employ one quarter of EU agricultural labour force[1].

The main EU cattle producers are Germany, France, the UK and Italy, which account for half of the gross production value.

Focusing specifically on the suckler cows segment, the sector is characterised by the presence of a vast array of economic interplays: breeders versus fatteners, very well segmented markets’ strategies versus production methods with low differentiation strategies, small farms (50 heads and less) versus larger ones (more than 300 heads), which usually focus their activity either on dairying, rearing and fattening combined or specialising only in fattening, as an example.

Whereas, considering the dairy sector, the picture is slightly different, with less heterogeneous realities. Three main broad groups can be identified at farm level: we have large but also medium size very competitive and dynamic specialized dairy farms, medium but mostly small size farms, often located in remote or distant regions (as mountainous areas), where added value products (i.g. DOP PGI or IGP) represent the main assets and on which well structured commercial strategies can be built. In addition there are medium size farms located in intermediate or less favoured regions, whose profitability relies mainly on products traded as commodities (no differentiation).

If we look only at figures related to income, the EU cattle sector incomes’ level ranges between 2,300 and 65,000 € per year and worker unit. Furthermore, it has been calculated[2] that in 2016 income support via the CAP provides on average 57% of the total annual farm net income, which amounts to 49% in the dairy sector and 100% on average in the bovine meat sector, respectively.

Against this backdrop, the aim of this note is to analyse the main characteristics of the EU beef and dairy sectors, to underline their interlinkages and their potential consequences, highlighting the challenges they are facing and delineating options for sectorial agri-food strategies, which include a balanced policy mix between EU, national and regional levers to achieve growth and ensure an ambitious level of economic, environmental and social sustainability.

Context

 The European Commission has presented the proposals for reform[3] of the Common Agricultural Policy (CAP) alongside with the budget proposals[4] for the period 2021-2027 for the European Union and its policies. Specifically, European farmers’ incomes would be highly impacted[5] by the proposed 12% drop in the CAP budget value (constant prices), which would have a particularly severe effect for the following sectors: field crops, milk and bovine meat. This as a consequence of the intrinsic dependence of cattle, sheep & goat and cereal producers on direct payment for their profitability.

Specifically, the viability for cattle producers would be severely impacted, given the structural characteristic of being a sector for which direct payments represents a large share of income.

Overall, the CAP budget for 2021-27 would see the share drop from around 38% to almost 28% of the total EU budget, which is partly due to the UK’s departure, and for nearly 60%  to the will of the European Commission to use former CAP budget for other EU new spending priorities such as security and migration.

The negative economic consequences stemming from the Commission’s proposal would add up to the existing challenges that these key economic sectors have to face, at a time of massive pressure for European agriculture towards more sustainable models in both economic, environmental and societal terms. The role of the new CAP should be therefore to accompany and encourage this development.

The importance of the EU cattle sector, which consists of EU dairy sector and EU bovine meat sector, for the European Union at large, should not be underestimated. Its economic importance in terms of employment at each step of the value chain, rural vitality especially when considering most vulnerable regions, provision of environmental goods and high quality products, is undeniable.

Another relevant aspect that should be underlined is the ever-changing economic dimension of livestock production, considering: (i) level of income support, (ii) price stability, sensitive equilibria in the food chain (i.e. retail buying power in a fragmented supply chain) and the trade dimension.

Both livestock and milk sectors went through difficult times in recent years. Starting from the abolition of the milk quota system (April 2015), high prices volatility at EU and especially global level, lack of competitiveness in comparison with other main producers – profitability being a function of margin/costs (i.e. the U.S., Australia, Argentina and Brazil), increased competition led by new international trade agreements (progressive trade liberalization and therefore more exposure to international markets which entails higher risks of price oscillation and cheaper imports), the impact of climate change (and related demanding mitigation efforts needed – binding targets) recent changes in global supply and demand (increase in protein demand due to population growth), and last but not least, increased societal attention towards quality, safety, animal health and nutritional aspects.

According to the last OECD-FAO Agricultural Outlook 2018-2027[6] global agricultural prices are expected to remain constrained given the forecasted supply growth (especially in the crop and livestock sectors), abundant stocks and global food demand growth. Focusing on specific agricultural commodities, the growth in demand is expected to slow down for cereals, meat, sugar and vegetable oils, however dairy seems to be the exception. Demand growth for dairy products is said to generate therefore higher dairy prices and consequently better margins for producers.

In a situation where it is assumed that the Russian import ban on certain EU agri-food products remains valid at least until the end of the year, latest figures from the short-term outlook for EU agricultural markets[7] in 2018 and in 2019 anticipate a slight increase in EU milk production impacted by unfavourable weather conditions in some Member States, and higher meat availability in the EU (as a result of modest increases in production and higher meat imports).


EU dairy sector in a nutshell[8] 

The EU dairy sector is of a great economic value for the EU.

Milk production takes place in all EU Member States and represents a significant proportion of the value of EU agricultural output.

DG AGRI data show that total EU28 milk production is estimated around 160 million tons per year (2016/2017 DG agri data)[9].

The EU’s main producers are Germany, France, the United Kingdom, Poland, the Netherlands and Italy which together account for almost 70% of the EU production. Specifically, the EU15 accounts for a share of 83% in total EU milk production.

In Europe, according to Eurostat, a number of 1.7 million farms keep 23.5 million dairy cows with an average milk yield per dairy cow of 6,900 kg per year. When considering the last decades, after milk quotas removal in 2015, in line with the market orientation approach given to the common agricultural policy despite the reduction of dairy cow’s number, the yearly milk production per cow has steadily increased. An explanation to this is given by the structural dynamics changes in dairy herds with the growth of the most productive ones.

A major factor is the presence of price volatility in the milk markets (usually measured by the coefficient of variation over 3-year periods), especially since 2006 (see figure below), with crises in 2009, 2012 (before removal of quotas, and a major crisis in 2015 after removal of quotas, which has inevitably led to a more market sensitiveness – and in parallel with the slow down of world markets) – between 2008 and 2017, agricultural prices fell by 10%[10].

Not negligible impacts on production levels, difficulties to adjust and usefulness of public signals and incentives were key variables for the sector (i.e. the 2016 incentive scheme was introduced with the aim to reduce voluntarily milk production levels). As also specified in the last EU Agricultural Outlook 2017-2030[11], world market price variability is expected to continue and market unbalances will occur.

At the end of 2017 and beginning of 2018 figures show that milk production in the EU has increased following markets’ signals of increasing milk prices (an average EU milk price of 34 c/kg in March 2018)[12]. Milk prices in the EU have indeed recovered from the low levels in 2015-2016.

To be precise, the majority of farms in the cattle sector in the EU15 are either specialized in dairy or in meat production, while cattle production in MS of the EU13 is located mainly on farms of mixed production focus and small economic size. It has however to be noted that most of the farms belonging to the EU dairy sector are defined as « highly specialized ».  Different type of farming (intensive vs extensive), housing systems (indoor and grazing) along with climatic, topographic as well as factors such as farm economics and consumers’ sensitivity, have an influence in the structuring and competitiveness of the business models[13].

Economically speaking, the EU milk sector provides a substantial contribution especially for the most fragile areas, which are naturally disadvantaged such as mountains or other regions of low productivity potential. The same applies to the meat livestock sector. This is mainly due to geographical, climatic and soil conditions. Given the lack of alternative farm specializations in these regions, the agricultural sector capacity to maintain vibrant rural community should be therefore valorized.

This is the dual aspect of the milk sector: economic & territorial dimension, whose sustainable balance needs to be ensured.

The European Union has become throughout the years one of the world’s leading dairy producers. However, unlike its main global competitors (the USA and New Zealand), Europe has not a single industry model.

Roughly and to sum up, four main dairy models exist in Europe:

  • In disadvantaged areas (i.e. mountain regions, but as well intermediate regions), where the milk production faces first the challenge renewal of generations as these regions face problems of attractiveness to young people, and secondly very different trends of milk production are present (i) between regions producing high added value specialities and (ii) regions producing milk as a “commodity”;
  • In most productive regions, there are two main industry models: (iii) a capital-intensive one that mainly relies on buying in animal feed, and (iiii) a mixed model that relies mainly on food produced on the farm.

Policy instruments & Context

After the removal of the milk quotas in 2015, which represented a challenging moment for the dairy sector, and which followed a phase of policy efforts to increase the power of milk producers and rebalance the milk supply chain preparing the end of quota scheme.

The EU milk sector was not ready when the crises occurred in 2015. Imbalances in overall production, decreasing global markets demands, without the presence of a well functioning EU framework, combined with wrong individual reactions, translated into production increases in face of lower margins per liter and consequently this caused even an higher impact on market prospects. It took almost a year to EU public authorities to act in order to solve markets dysfunctions and stabilise dairy markets so basically adopting their primary role and having in mind that it is less costly and far more efficiently to reduce production than to manage heavy stocks due to the level of overproduction.

This was and should remain a lesson for the future.

Indeed, while the current outlook for world dairy markets is positive, there are some concerns on the capacity of the EU regulatory framework to deal with episodes of extreme market volatility or with a crisis situation after the quota regime, especially in the perspective of ensuring a balanced development of milk production across Europe.

In a nutshell, in addition to direct payments and rural development programmes, the EU dairy sector, which is currently integrated into the CMO Regulation (EU) No. 1308/2013, also benefits from the following measures/market tools[14],:

  • Public intervention is available (between 1 March to 30 September each year) for butter and SMP (skimmed milk powder). Before January 2018 it opened automatically, while, after a recent Council decision[15], a quantitative limitation for buying-in skimmed milk powder at a fixed price at zero tonnes for 2018 has been set.

Butter is bought into intervention at 2 217.5 €/t (90% of the reference threshold) and SMP at 1 698 €/t (reference threshold) until a limit of 50 000 tonnes for butter and 109 000 tonnes for SMP. Above these limits, buying-in may continue only by tender (it has to be noted that prices cannot be higher than the reference threshold for SMP and not higher than 90% of the reference threshold for butter);

  • If the market situation so requires, other instruments may be activated: a private storage aid for butter, SMP and PDO/PGI cheeses can be fixed (optional measure);
  • The reformed CMO allows the Commission to implement any exceptional measure deemed necessary in times of crises (i.g. severe market imbalances), including the possibility to allow POs (Partner organisation), APOs (Association of producer organisation) and IBOs (Interbranch organisation) to take market regulating measures, such as withdrawal of surplus products from the market, private storage, etc.;
  • Border protection is high for milk products, virtually limiting imports from third countries to quantities negotiated under bilateral agreements or resulting from the WTO agreement. Specifically, an import regime is applied for dairy products entering the EU. Preferential imports are subject to the issuing of an import licenceand, in general, payment of an import duty (tariff). While concerning exports, since 2009, they have all been carried out without export refunds;
  • A “Milk Package” has been in force since 2012, increasing the bargaining power of milk farmers, giving the possibility for MS to declare written contracts compulsory between farmers and milk buyers and processors, fostering the structuration of milk farmers into POs, APOs and IBOs, giving the possibility to farmers to negotiate contract terms collectively via POs, allowing for supply management for PDO/PGI cheeses and enhancing transparency.

It has to be underlined that almost all Member States have adopted national criteria for the recognition of Producer Organisations (POs), though some only recently. The creation of POs requires time and a strong dynamic from farmers themselves. Potential incentives to encourage farmers to enter into joint production agreements have been provided in the reformed Rural Development Policy (support for setting up POs, new measures on cooperation and eligibility of groups of farmers for a series of rural development measures).

  • The School Milk Scheme grants an aid for the supply of milk to pupils in educational establishments, contributing to building healthy consumption patterns among children. Under the CAP 2020 reform, MS must have a strategy for the distribution of school milk prior to benefit from the support. A new initiative followed by a political agreement in 2015 led to the single EU School Scheme for Milk, Fruit & Vegetables;
  • Marketing standards apply to milk products, drinking milk and spreadable fats, with a view to give the necessary information for consumers to make well informed choices;
  • With its promotion policy, strategic priorities for promoting EU farm products and funding criteria in a yearly work programme are defined by the EC. Operators are free to come with concrete proposals that are eventually screened and incorporated into the programmes. A total of EUR 179 million is available for promotion programmes selected for EU co-financing in 2018.
  • A Milk Market Observatory has been launched on 16 April 2014 to increase market transparency and help both the actors of the milk supply chain and the public authorities make well-informed decisions. A web interface has been set up through which any interested person can access the latest milk market news, data and short-term analysis on the dairy market.

Two years ago, a milk production reduction scheme officially known as the “Voluntary Supply Management Scheme fo the Dairy Sector” was introduced as a “one-time” exceptional measure. In order to decrease milk production, the scheme offered farmers, who agreed to reduce their milk production, 14 euro cents for every kilogramme of milk reduction over a three-month period (compared to the same period in the previous year). Member States had also the possibility to top up that amount with EU funds distributed as national envelopes for additional support. Dairy farmers were therefore paid according to the actual reduction in production.

In few words, in July 2016 the European Commission implemented this voluntary measure, after an initial reluctance, aiming to support farmers coping with the severe crisis that hit the sector and helping rebalancing the dairy sector. This decision followed the previous measures (late 2015), through which EU funds have been distributed to MS (financial envelopes per MS). The impact of these initial measures was basically a failure in mere economic terms.   Conversely, the EU milk voluntary production reduction scheme, financed with €150 million, turned out to be a success: national figures show that almost 48,000 dairy farmers took part in the scheme, leading to a total milk production reduction of 834,000 tonnes. In other words, it has been reported that, «out of the original allocated budget of €150 million, close to €112 million was used to compensate farmers for their efforts». Furthermore, this exceptional measure had quite a substancial impact also on EU milk market prices, whose average in mid-2017 recorded an increase compared to the previous months.

Challenges, dynamics & structural changes

The European dairy sector is facing several simultaneous challenges:

  • Increased and recurring price volatility ;
  • Strong market crises ;
  • Lack or stagnant competitiveness in some regions ;
  • Profitability, in terms of capacity to keep milk producers and milk production all across the EU because of diverging production costs in relation to natural conditions ;
  • Age of dairy farming population: demographic factor in the restructuring of the dairy industry;
  • Industry organisation, together with the relationships in the milk supply chain between farmers, processors and retailers;
  • Research & Innovation: the appeal of the industry and its profitability will only be enhanced by upgrading dairy production technologies and skills, which require targeted investments and policies;
  • New markets opportunities: the European market is a mature market and the future growth of the dairy industry is and will be exports-driven. This is also a key factor, which is able to ensure the viability of the European dairy industry. Latest projections by the OECD-FAO Agricultural Outlook estimates for the European Union an increase of its export share to around 28% in 2026, compared to the other four major exporters of dairy products (i.g. New Zealand, United States and Australia).

Since 2007, the global economic environment has been changing quite rapidly. Market volatility has increased, both in frequency and amplitude and this is particularly true for the dairy sector, given its inner dependence on exports and the particular sensitivity of dairy production in Europe to sudden price variations in international markets such as milk powders and butter.

The European Union must therefore enable the dairy sector to:

  • Maintain its presence across the whole of the European Union;
  • Invest significantly to strengthen its competitiveness in global markets;
  • Be sufficiently resilient to market fluctuations;

It is therefore necessary to deploy and structure sectorial strategies for the milk sector and analyze the right and balanced mix between European actions and tools and regional/national level, by first, finding more efficient ways to ensure enhanced competitiveness and sustainability of milk supply across the EU.

As abovementioned, in Europe there are both competitive milk regions and less-competitive ones, with no alternative than milk production, and where milk production is associated with extra costs due to the conditions inherent in their nature.

The profitability of farms, described as “the ability to generate profits”, is determined by a number of financial, property and macroeconomic factors, as well as by structural sectoral determinants and their individual technological and economic characteristics[16]. By focusing on the single aspect of economic margin of farms, the study developed in 2017 by the University of Life Sciences in Poznan (see Ref.12) shows that it is key in determining the development of more targeted agricultural policy tools, and for ensuring the viability of pursued agricultural activity. The author also stresses “the margin level is a synthetic indicator of the financial situation, which fundamentally affects the assessment of the farms’ competitive capacity and thus – their capacity to continue their operations”.

Interesting results are presented by the study:

  • “income from milk production in the EU-28 exceeding EUR 51 billion accounts for around 32% of the total livestock production income and around 14% of total agricultural production income;
  • specialised milk production is conducted in the EU by more than 572 thousand farms, i.e. 5.3% of all farms (data taken from “Farm structure survey, 2013”);
  • specialised dairy farms pursue their activity on the area of approx. 20 million ha, i.e. around 11% of agricultural land used in the EU;

By utilizing specific regression model parameters, author demonstrates that the variability of milk production margin depends mostly on the following farms’ characteristics[17]: forage area, cow herd size, cows’ milk yield, milk prices, energy costs and remuneration costs.

While looking at the dynamic within the sector, the following points are raised and discussed later on:

– the EU dairy farm sector experienced a marked increase in both the size of herd cows, forage area and milk production;

– the production capacity of dairy farms has been seen quite strongly associated with an increase in milk yield, forage area productivity and labour productivity. A strong variability of these dynamics among EU countries’ dairy farms has been recorded along with different technological and economic parameters.

An example is provided by comparing data from 2013, which show that the highest net milk margin was recorded on farms in Romania and Italy, which differ in terms of various parameters. Dairy farms in Romania have low operating costs, fixed costs and costs of external factors, which, as discussed by the study, despite relatively low milk prices, determine the high production margin. While in Italy for instance, the rearing of dairy cattle is conducted on a larger scale, which translates therefore into a high labour productivity and milk yield similar to the EU average.

The study also provides additional comparisons by tackling the low profitability of milk production in some EU countries such as Slovakia or Czech Republic. What has been found as “common factors” are:

  • the large scale of production, which is measured by the number of cows and milk production volume;
  • the lower labour productivity compared with the EU average;
  • low prices obtained and high costs per production unit;
  • high cost intensity of milk production

Milk Markets overview – Comparison with World main producers

When looking at the world markets, different factors have to be taken into account:

  • Global milk production has recovered in recent years and future prospects are optimistic, especially for developing countries (Pakistan and India in particular). World milk production in 2030, according to DG Agri latest estimates which match OECD-FAO ones, is expected to record an annual increase of 16 million t, comparable to the average yearly growth of the last decade, and for a total of around €178 Mt in 2026 (taken 2014-16 as base period)[18];
  • New Zealand (world major exporter of dairy product with a share of 32%, primary source for butter and WMP): higher cow numbers and yield progress led to an increase in milk production in recent years. Productivity is expected to grow at a lower pace;
  • Australia’s milk supply is slowly recovering;
  • The U.S. rose in milk production (+1,76% in May), driven by: +0,8% increase in cow numbers, +1% increase in yield, favourable weather. A slight increase in per capita consumption is also expected;
  • Expectations in Europe on SMP stocks release (these are not in view);
  • Global demand & exports: SMP exports have been performing well but the market weakened in 2017 (due to slower demand). Increasing demand for cheese, while butter trade was affected by high prices and lack of availability;
  • EU trade policy development (Canada, Japan, Australia): example – increased export to Canada via the CETA agreement;
  • China’s role: major importer of dairy products – key uncertainty at the moment – strong impact on world markets;
  • Brexit: the impact of a hard Brexit would be very heavy for EU beef and dairy sectors. On one side, it will add to the impact of all the EU negotiated FTAs, magnifying the negative consequences. Additional cheaper quantities of beef would reach the internal market, destabilizing in this way the sensitivity of the sector. Concerning milk and milk products, the picture does not differ: Brexit will bring significant pressure caused by added competition in the UK market for EU exporters.

Internal overview -The Example of The Netherlands as a “dairy country”

Analysis and discussion of the study: “Grondgebondenheid als basis voor een toekomstbestendige melkveehouderij” 12 April 2018

The Netherlands is considered as a dairy country thanks to the combination of sufficient rainfall, suitable soil and mild winters, which are all beneficial for the maintenance of grass in good condition and consequently a favourable condition for dairy cows. Dairy farming is the largest land user in the country.

Dairy farming in the Netherlands changed radically in the 50ies, thanks mainly to technical progress. Milk production per cow and per hectare has increased significantly. Better animal care and housing, modern breeding, sophisticated animal feed, artificial fertilizer and improved grass quality were all enabling factors.

Dutch dairy farming was a land-based sector. Therefore, the farmer had sufficient land available to produce grass and maize for the cows and to make optimum use of the manure of those cows for the growth of the grass and the maize.

During the last years, Dutch dairy farmers started a process of restructuration by investing and expanding themselves.

Dairy farming became year after year more intensive, the farmer had to transport more manure to other agricultural companies and more feed from third parties. As a consequence, this has led to negative consequences for nature, the environment and the landscape.

Focus on the Economic challenge 

Instead of producing more and more milk at lower cost price, the challenge for Dutch dairy farming is to make the switch to milk with more added value. However, the restructuration process increasingly towards large-scale dairy farming with associated financing costs and a higher production per cow, tends to have reached its limits within the Dutch context.

Furthermore, a particular attention has to be given to “exploring niche markets”, given that the domestic demand in the EU (quite stagnant) combined with the global demand of milk and dairy products suggest such a move.

For instance, by allowing and easing (at the national level) supermarket chains’ collaboration with the dairy industry, could set up chains for milk with a higher social added value. Indeed, this is only one of the possible business strategies that could be structured, since only a segment of consumers is nowadays willing to pay an extra price for this.

It is relevant to note that maybe the biggest challenge that both milk and beef sectors have to cope with is to find a way to improve the efficiency and productivity of production methods in an environmentally sustainable way, while increasing their market return thanks to a good communication to consumers. This because issues as  environmental and socio-ethical/nutritional aspects, such as animal welfare, climate impact of livestock production, healthy diets are shaping the policy agenda, and consequently the need for rational use in livestock and dairy production will be the baseline.

Sector’s self-sufficiency in raw material

Substantial steps towards a high level of self-sufficiency will be needed in the coming years.

This key figure is the extent to which the farmer is able to grow protein for his own animals’ feed from his own country or nearby. In addition, the cultivation of own protein makes the farmer less dependent on global sources of protein whose price development is becoming increasingly volatile and which is expected to rise in price in the coming period.

In addition, by ensuring a higher degree of self-sufficiency in protein, the import of protein-rich raw materials from outside Europe can be significantly reduced.

Along this path, in order to achieve a higher production of forage directly on farm and limiting therefore imports, major actions should be targeted at increasing grass productivity and protein content of EU cereals, and as well securing the sustainable production of EU rapeseed meal.

Questions/Issues to be tackled to adopt the right policy approach

What could be a strategy for producers to continue to exist, to be competitive on both the internal & the global markets?

  • Tackle volatility and market crises via new tools and more solidarity across the EU food chain ;
  • Stimulate targeted investments to increase both competitiveness and sustainability;
  • To promote EU quality (safety, quality of products and quality of ways of production) on EU markets and worldwide ;
  • Give value to by-products (energy)
  • Regional approach to better structure processing, in particular in areas facing competitive challenges ;
  • Support farmers with knowledge, training and advisory services on how to effectively operate producer organizations ;
  • Adopt effective and affordable tools to improve the less sustainable practices (e.g. manure/nitrogen management); to reach common EU standards to secure the perception on world market of EU high quality products ;
  • Sectorial economic integrated strategies of development with targeted tools and financial means, mobilized in a flexible way other the period, to accompany the implementation of these strategies (CAP role) 

Actions: EU, National & Regional/Local

On the basis of the elements listed in the paragraph above, effective actions at different levels (EU, national and local ones) could be structured.

In particular, when considering the local/regional level, the focus should be on deciding the type of structuration process – by both better structuring the upstream agricultural sector, and strengthening the weight of the upstream, or even allowing for reconversions.

Sectorial integrated strategies need flexibility in the possibility to mobilize tools making up a sector’s economic strategy (i.e. via specific investments, training, exit plan) on the basis of a kit of EU measures that can be flexibly mobilized in a financial envelope defined in relation to the CAP strategic plan.

In practical terms:

  • How to tackle markets and prices volatility effectively – more effective risk management tools to be deployed via the new CAP and following what has been proposed with the Omnibus regulation
  • Crisis situations: A European Crisis Management Fund in agriculture, financed by an adequately equipped multi-year crisis reserve, must be carried out and take over the IST tools when risks become deep crises (see related Farm Europe note)
  • Innovative strategies to ensure and enhance the competitiveness of the sector, to keep the recent dynamic. Role of Innovation, Research and Technology: in terms of infrastructure improvements, genetic (fewer inputs and better resistance); – One possibility to be further investigated: recent advancements in beef and especially dairy cattle breeding thanks to technological/genetic improvements, which could play a decisive role and a driving force behind increased economic efficiency and consequently profitability of dairy farms.
  • Improve sector’s capacity to get organized (i.e. via contractual/commercial relations, participation of dairy producers to recognized POs);
  • Strengthen the capacity to negotiate prices and volumes ;
  • Effective and shared export action;
  • Ensure a better positioning according to the product value and respective target market;
  • On consumption (internal market): tackle the nutrition/health related issues concerning dairy products – dietary habits changes – meet consumers/societal ‘expectations – Nutritional quality of milk products (source of calcium and protein) – Link with production methods – Diversity of products;
  • For less competitive regions:
    1. role of PDO/PGI quality logos;
    2. tailored regional sectorial strategies for less competitive regions without specific PDO/PGI assets based on structuration, innovative investments and developments of co-productions.(incl. energy).
  • Environmental sustainability commitments/actions: enhance the capacity of the sector to respond to consumers expectations and concerns when it comes to residues, treatments and climate change mitigation ;
  • Commitment of the sector to the climate aspect: build on the achievements over the period 1990-2010 and make new steps forward;
  • Develop the Circular economy concept.

Overall, when dealing with the whole “environmental sustainability dimension”, which represent one of the pressing challenge that the EU agricultural sector has to face, an ambitious EU program for double performance (economic and environmental) should be deployed.

Specifically, increase the dissemination of high-tech farm production methods/practices within the beef and dairy sectors would provide tangible provide results in the inputs optimisation, thus reducing the environmental impact of the agricultural sectors concerned and increasing their competitiveness vis-à-vis the other major producers.

However, given that the picture now of the uptake rate of these high-tech farming techniques (smart and digital farming) remains low and differs widely among EU Member States, the new CAP should accompany the transition towards a double performant EU agricultural sector by proposing an ambitious and clear program.


EU Beef sector in a nutshell

The European beef sector is at the foundation of the economic fabric of many rural areas across the European Union. It provides a great number of jobs at each step of the value chain, from the farm to the sale point, encompassing a range of intermediaries, supporting industries as well as sales and retailing.

In this context, the suckler herd – an important segment of the EU livestock sector – is a key player, not only because it provides more than one third of the beef consumed in the EU, but also for its strategic role in very specific EU areas, – mainly located in Ireland, France, the United Kingdom, Spain, Italy, Portugal and also, more and more, in Poland. Niche market is also present in many other EU Member States, with demand rising in countries like Finland and Sweden. It is also important to highlight that in many areas; this specialized breeding system cannot be replaced by other farming activities. This is due to the agronomic profile of the land.

However, the contribution of this specific sector to the EU economy is too often underestimated.

The European beef sector is undoubtedly one of the most important agri-food sectors in Europe, if not the most important, in terms of local development and of employment, in several regions of the EU.

However, despite the best efforts of public authorities and of numerous private initiatives, this sector has been facing structural and recurrent crises for almost two decades in various parts of the EU.

Ongoing changes in consumption patterns, technological evolutions, and of policy and international commerce ensure a particularly uncertain future for the sector, or at least one, which is difficult to read.

In this context, the sector confronts a major challenge: to grow and develop, despite the uncertainties of the future, to build a collective political and economic strategy, to seize opportunities which present themselves on both the European internal market and on external markets, and to nurture a new link with citizen-consumers. 

Policy instruments available

By considering EU policy, as well as the policies of its leading member states in beef production, and in parallel to the policies pursued by the U.S., Brazil, and Argentina, conclusions may be drawn on how best the EU may support and secure its beef sector in the face of new and unexpected challenges.

The Common Market Organisation covers the beef and veal sector, with market instruments initially conceived to stabilise the sector when deemed necessary through:

  • Public intervention: may be opened by the Commission if, over a representative period the average market price in a Member State or in a region of a Member State is below 85% of the reference threshold (EUR 2224/tonne). Since the 2013 reform, intervention became dependent on the Commission’s will, rather than being triggered automatically once the threshold price is reached. However, the implementation of this tool is very unlikely, taking into account the level of the threshold. At its low point during the 2001 crisis, for example, the EU beef price reached €2318/t (OECD); 
  • Private storage aid: the Commission may decide to grant private storage aid by taking into account average market prices and the reference thresholds and production costs for products concerned, as well as the need to respond quickly to an emergency market situation having a significant negative impact on margins in the sector;
  • Import tariff quotas: the Common Market Organisation (CMO) empowers the Commission to set the measures to manage import quotas. Most of the tariff rate quotas agreed for the beef sector are managed by DG AGRI;
  • Collective negotiation: producer organisations (POs) in the beef and veal sector may negotiate contracts for the supply of live cattle under certain conditions. For each organisation, the quantity of beef and veal covered must not equate to more than 15% of the total national production (this changed with the Omnibus regulation from January 2018);
  • Exceptional market support measures: measures which may be decided and implemented by the Commission in cases of animal disease or loss of consumer confidence;

These measures complement the existing direct support schemes of the current CAP, which include compulsory schemes for all MS – basic payment (or Single Area Payment) per hectare and voluntary schemes (optional for MS), Voluntary coupled support (VCS), through which Member States have the option of providing limited amounts of “coupled” payments (between 8% and 13 % of the national envelope) to those sectors or those regions where specific types of farming or specific agricultural sectors undergo certain difficulties and are particularly important for economic and/or social and/or environmental reasons. The Commission has flexibility to approve a higher rate where justified. In addition, there is a possibility of providing an additional 2% “coupled” support for protein crops.

With the new CAP proposals, the European Commission proposes the 13% to become 10% and it added the possibility to set up operational programmes up to 3% of 1st pillar national envelope. Furthermore, the proposed reform proposal plans to merge the current CAP greening and the conditionality in force into a new, expanded conditionality applying to 100% of 1st pillar aid. However, Member States are able to define the scope covered by a number of these new conditionality requirements. Current greening’s exemptions would not be valid anymore.

Furthermore, a new measure is proposed in the first pillar to finance new environmental actions (eco-scheme). This measure is intended to finance the implementation of environmental requirements going beyond the new conditionality.

Throughout the years, the European beef sector, and especially the suckler cows sector, has been unable to recover and to develop a long-term profitability. Therefore, current policies which were weak in supporting the beef sector during these last years and decades should be questioned and analysed with a strategic approach. 

Main Objectives to be achieved by a sectorial strategy

To improve:

  • Power of producers organisations in the food chain ;
  • the structuration of producers into more powerful organisations ;
  • Joint action among farmers and across the food supply chain in order to foster efficient use of resources, product development and marketing opportunities
  • Productivity and competiveness;
  • Segmentation of the beef markets and correlated strategies of marketing mix
  • Regional strategies of (re)structuration of the sector and its farming component
  • Use of risk management instruments and prevention strategies;
  • Invest in the double performance of the sector : linking increase of profitability and environmental and climate change performance

Challenges – Focus on Beef

Political aspects: the safety nets put in place have proven to be ineffective for the sector, and premiums to offset its new market-oriented character have not altered the difficult economic reality for European farmers, whose incomes are modest and dependent on aid – the public financial effort (notably coupled payments) is to a large extent absorbed by other players in the sector – the work at producer level is not rewarded by the market as it should be for an healthy economic sector. Other actors, too, in particular slaughterhouses, often achieve low level of profitability. In short, the sector does not respond well to short-term strategies, and investments take between 15 and 20 years to have a real impact.

Sanitary and nutrition aspects: since the end of the 1990s, the public perception of beef has changed. While previously a central element of a balanced diet in the opinion of nutritionists, multiple health crises and the debate surrounding climate change have transformed the image of meat and its place in nutritional recommendations. The world market is changing, with traditional powers – the developed countries – focusing on value, while dynamic powers – which are more diverse – have very different requirements in terms of quality standards, and are therefore also more difficult to understand. In addition, the livestock industries are also affected by climate change, with rising temperatures being associated with increasingly significant and more diverse epizootic pressures.

Economic aspects: the livestock industries are mostly located in areas adversely affected by economic globalisation and by the opening of borders in the agri-food industry and beyond. Often isolated, they do not immediately benefit from the economic dynamics generated by the opening of new markets and the development of new technologies. They face a multifaceted challenge:

  • The paradox of being forced to turn to the world market – where the growth opportunities present themselves – while simultaneously being weakened by that very world market, where the highly integrated operators pose fierce competition, having completely redesigned the fundamentals of the sector. This is especially true of Brazil, which has turned beef meat into a ‘commodity’ – in the last decade, productivity in heads per hectare increased by 25%, and the country produced 9.92 million tonnes of beef and veal, or 16.85% of the global total, in 2014 (USDA)._ Virtually all of the ongoing free trade agreements place the industry in a defensive position (Mercosur, TTIP, and Australia, in particular).
  • The difficulty the sector faces in controlling its own destiny, given the competition posed by the dairy herd on the beef market, which provides around 60% of the beef consumed in Europe. This poses a problem, as the dairy herd was previously constrained by the European quotas and in decline due to the increased competitiveness of the dairy cow, while the current expansionist strategy of Europe’s dairy sector shuffles the deck and puts pressure on specialised breeders.
  • Slow investments related to cattle farming and low prospects for depreciation are associated with difficult working conditions.
  • A scenario of a “three tiers” EU sector with a sector in Eastern Europe focusing on low production costs to take advantage of their competitiveness to enter the market, switching from milk to meat; a sector characterised by larger farms focusing on breeding cattle in association with arable crops and forage for own consumption and producing enough to gain some power of negotiation – at least locally (semi-direct sale, regular contracts); and a sector of smaller-medium size farms with basically no bargaining power.

Reasons for the EU to take action

Confronted by this bleak situation, there are nonetheless very real prospects for the European industry, which can count on its capacity for resilience and the remarkable attachment of the livestock community – mobilised, passionate about their work, and in possession of extensive know-how, renowned across the world – associated with products possessing an extremely strong identity.

Beyond the fundamental human factor, given the strong local roots of direct and indirect activities related to the livestock sector, markets offer room for a renewed and ambitious strategy which takes into account the major challenges facing the EU: sustainability, growth, and employment.

In terms of both growth and jobs, Europe has missed the first global boom of beef meat, overtaken by emerging actors – most notably Brazil (Figure 1). The EU is nonetheless an important challenger – a position which it does not hold for any other important agricultural production.

The sector is the economic heart of many remote areas, and can be, in these regions, a real fulcrum for the revival of employment around products with a strong identity. The potential for growth of developing countries is far from exhausted: beef consumption per capita remains three times lower than in developed countries.

According to the OECD, global demand for animal protein is due to grow by 1.6% per year over the next 10 years, driven by revenue growth and urbanisation. In total, 58 million more tonnes will be consumed in 2023 compared to 2011-13, this increase being concentrated primarily in Asia, South America, and Africa. It should benefit in particular the poultry and sheep meat sectors, but all meat, including beef, is expected to see double-digit increases, with prices also due to rise. EU beef meat consumption began to recover in 2014, by as much as 1.8 kg per capita, at trend which is set to continue (European Commission, 2015)._

Moreover, in the background is the question of the durability and appropriateness of the expectations of Europeans, given the products to which they have access.

To put an end to local production would lead to first, an externalisation or outsourcing of greenhouse gas emissions, increasing the pressure on particularly sensitive zones such as the Amazon, and preventing the EU from meeting the climate objectives for which the EU sees itself as an avant-garde actor; Second, the abandonment of the extremely high standards of production and animal welfare – the EU has not succeeded so far, despite numerous attempts, to integrate this dimension into international agreements; and finally, in the longer-term the EU would be faced with products which are controversial, both ethically and sanitarily, rightly or wrongly – such as the use of cloning, against which European citizens retain a very strong resistance.

On this basis, it is appropriate to question and advance the sector’s strategy, mirroring the political tools in order to contribute to the implementation of a winning strategy for this sector.

Elements to structure an effective strategy

Research and innovation: animal genetics and improved livestock management (buildings, animal feed), gains are made both in better meeting consumers’ expectations in terms of products available and marketed, and in reducing the environmental footprint of the production process – the FAO predicted that Grassland carbon sequestration could significantly offset emissions even without any farming system change, with global estimates of about 0.6 gigatonnes CO2-eq per year (UN FAO, 2013)._ In matters of public health, too, it is likely that scientific solutions will emerge on a large scale to remove elements considered a health risk by the WHO due to the excessive consumption of meat. It should mobilise the available knowledge and accelerate its implementation in the sector itself.

Better market segmentation: Linked to the research effort, it is necessary to clarify what is on offer to consumers. A number of market segments are emerging, both in Europe and internationally. The challenge is for each of these segments to find stability and clarity without relying excessively on others. Four components, corresponding to four different sectors of production, may be identified:

  • Meat from the dairy herd: low-end (but a source of instability for other sectors, depending on the variations of the price of milk);
  • Calves from the dairy herd whose quality is improving due to technological advances related particularly to sex-sorted semen: entry-level;
  • Breeds of beef for the “general public”, with large production volumes, of a high level of security for consumers;
  • High-end, with more specific breeds rooted in exceptional terroirs.

These two latter components are at the heart of the strategy for recovering the strength of the livestock sector, in coordination with the two former components. It should ensure that the dairy herd does not hamper the ability of the suckler cow sector to deploy an effective strategy, while maintaining its role as an additional source of income for dairy farmers.

Increased coordination between actors of different sectors and an enhanced level of understanding of consumer expectations at ever link in the chain. This should both allow an increased level of responsiveness and adaptation between markets and production in order to optimise value creation, and accelerate the dissemination of innovation within the sectors. Coordination at each level of the sectors should enable a pool of strategies for different breeds and for marketing prospects.

Optimisation of logistics situations, including in relation to the debates on animal welfare and transport emissions.

Effective communication systems and quality assurance labels to fully highlight the efforts of producers to consumers – and to benefit from appropriate levels of compensation with regard to segmentation and production structures. Moreover, in parallel, a thorough knowledge of both European and international markets is necessary in order to promote, as far as possible, each piece of meat, by finding the market where it is value and fulfils a gap in consumer demands.

When compared to other breeding activities, the EU beef sector production has distinctive traits, which make it particularly exposed to external factors:

  • Tight margins, when looking at producer’s prices;
  • Generally low level of profitability, when considering the complexity of the production systems overall;
  • Low level of elasticity;
  • High global competitiveness vs low internal competitiveness (structurally between 70% to 90% of the incomes in the beef sector depend on CAP subsidies);
  • Animal welfare concerns supported by activists’ campaigns;
  • A mix of positive and negative environmental impacts (biodiversity, carbon sequestration and emissions).

In addition to this, profound changes in consumption, technologies, public policies and international trade are combining together to make the future unpredictable, or at least difficult to foresee, in particular due to:

  • the threat of a more intense competition from the bilateral agreements agreed (Canada) or currently being negotiated – namely Mercosur, Australia, New-Zealand, not mentioning the US;
  • the lifting of milk quotas, which is disrupting the sector’s equilibria through renewed growth in the dairy herd, which already supplies two thirds of the beef consumed in Europe.
  • Suckler beef is as well especially vulnerable, with Brexit and the risk of cheap beef imports under CETA, possibly other trade deals the EU is negotiating currently and trade deals, which the UK may ultimately negotiate with non-EU countries after having left the EU.

Consequently, the sector is facing a double challenge:

  • Building a clear and concrete vision for the future and, to do so, devising a strong market-driven business strategy for the sector as a whole. This strategy must enable the industry to seize opportunities both within Europe and beyond, as well as help it to adapt to changes in demand.
  • Designing and contributing to build the most suitable policy tools to support and accelerate the implementation of this business strategy, valorizing the wide diversity of culture and economic models in Europe in this specific sector and laying down the foundations for a common European approach, with flexible and relevant tools developed and adapted to this diversity.

Yet, despite the efforts undertaken, especially through the Common Agricultural Policy, the sector has been struggling with recurring structural crises for almost three decades now. The impacts of these crisis have affected different regions in the EU, at different times and in different ways, depending on their production models.

In this context, it is more than urgent, on the EU market, to better valorize products, to build efficient meat supply chain focusing on modernization, structuration as well as viability and to cope with the challenge of market volatility and crises. While, on the Global market, to ensure effective promotion measures and a meaningful trade agenda, always bearing in mind the high sensitivity of the sector. The EU has definitively a key role to play as a supplier of safe and quality meat products. The option that the EU Commission included in the CAP proposals of structuring operational programs that can be opened to other sectors than those that benefited until now (wine, fruit and vegetables), in order to develop sectorial stratgies, will certainly play a role on top of notably current 1st pillar tools (decoupled and coupled payements). .

The EU beef sector clearly has the capacity to seize the growth opportunities stemming from the increase in beef meat global demand forecasts for the upcoming years.

However, the current market situation for bovine meat is quite worrying both in terms of economic and societal aspects.

Starting from the last years, a steady increase in slaughtering (linked to the difficulties experienced by the dairy sector), so a production increase, has affected producer’s prices consequently. Latest analysis (EU Agricultural Outlook 2017-2030) confirms that beef production remained stable in 2017, following the increased number of in slaughtering of heifers. However, the overview provided by the study shows that by the end of the outlook period (2030), beef production is expected to fall to 7.5 million t. Main drivers of this decrease are to be found in: lower consumer demand (internal market) and recent developments in the dairy and suckler cow herd, but at a slower rate than in 2005-2013.

The situation in Ireland, the Netherlands and Poland provides an overview of the ongoing economic developments.

In 2017, Ireland experienced 200,000 more cattle for slaughter than in 2015, in addition to a chaotic situation on traditional export markets (Russia, Turkey) and the sharp fall of the pound in the wake of the Brexit referendum in the UK, which is the biggest export market for Irish beef producers.

The same type of impact was faced by the Netherlands. This is due to the deliberate choice of the NL milk producers to increase the dairy herd in 2015 and 2016, ahead of the implementation of the new domestic regulation on Nitrogenous effluent release. As a consequence, at the end of 2016 data showed that there were already 160,000 more NL cattles for slaughter than in 2015.

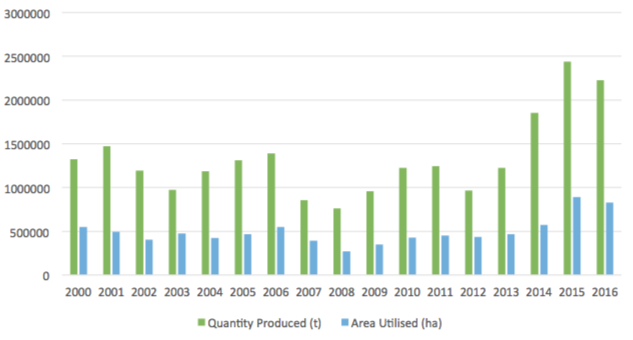
On top of this, Poland appeared as a newcomer with strong ambitions in the sector. Because of the milk crisis and the strong competition of western milk producers, many polish producers are converting their milk herd into suckler herd. Between 2004 and 2016, the polish beef meat production register a 66% surged, Poland becoming the 7th EU producing country, exporting 90% of its national production. (Poland being traditionally a pig meat market).

Furthermore, another issue of concern is the surge of young calves from the dairy herd, which are not deemed as suitable for viable beef production system. One of the few options is to export them.

Accordingly, the links between dairy and beef sectors should be tackled thoroughly, since outlooks for the first one are positive, especially in terms of profitability.

The forecasted expansion of the dairy herd should not happen at a detriment of the specialized beef herd – According to estimates (DG Agri) almost 2/3 of the EU cow herd comes from dairy one.

At the same time, the beef sector is facing two communication challenges:

  • On one hand, some big EU competitors – in particular from South-America – are spreading the idea among EU consumers, via aggressive trade and promotion actions, that quality beef = non-EU meat.
  • On the other hand, activists are challenging beef meat consumption as such building their campaigns on misinterpretation of nutrition science and hard hitting animal welfare actions.

The EU should work actively against these two highly dangerous and false misconceptions and messages from both an economic and health point of view.

Old story but simple reality: ruminants like cows can digest plants that are indigestible to humans. They make available high amount of proteins for feeding people.

A certain number of ideas come up regularly in discussions at EU level and they could be definitely considered and evaluated as a possible basis for a successful European business strategy for the EU’s suckler herd. Specifically, on the basis of currently available information, and bearing in mind the challenges we can foresee, Farm Europe believes that the following could be key ingredients in a common European strategy, and that they could offer a starting point for a discussion on such strategy:

Market segmentation (ensuring production is demand-driven). The priority must be for the sector as a whole to reflect on remodeling its product offer, in order to make it clearer and closer to consumer demands. This implies a root and branch review of all the parameters that govern the sector, niche market, and supply chain dynamics – from breeds to industry organization, to the point of sale, including research, innovation, and market prospects for European beef products. On the demand side, suckler beef needs to be differentiated as a premium product as part of a comprehensive plan to segment the market and provide a means of surviving the damage caused by trade deals.

The long-term success of this approach remains on ensuring a more harmonious co-existence between suckling and dairy herds.

Three market segments seem to emerge:

  • A. Entry-level: mainly carcasses of culled dairy cows, but also entry-level cuts from suckling livestock of lower quality used for minced beef, processed products, entry-level cuts of beef ;
  • B. Mid-range: mainly consisting of suckling livestock, including, but not limited to, large, well-known and developed meat breeds such as Angus or Charolais (cow or YB meat depending on markets);
  • C. High end: productions anchored in terroirs, with a very high reputation potential, valued at all stages of the chain of production and marketing as an exceptional product. These represents signs of quality (PGI, labels, etc.).

The challenge is to develop economic coherence for each of these segments, both at the level of livestock systems and at the level of the sector, through research and innovation, but also through the promotion, organization and the transfer of value to producers.

  1. Research and innovation through improved animal genetics and by enhancing farming practices (in buildings, animal feed etc.), it is possible to make advances that will better satisfy consumer demand in terms of products on the market and societal expectations in terms of health, environment and animal welfare. Effective communication, information and decision should be science-based, with a clear commitment of all stakeholders in that respect (from economic actors to medias, from decisions makers to NGOs), while not discouraging research and innovation in this field.
  2. Structuring the sector will require two types of action:

a. greater coordination: between producers, processing and distribution.

It has become an absolute necessity to organize the sector, including coordinating at strategic market segment level or, when deemed relevant also at local producing regions’ level. This coordination should result in a fair return for the first stage of the industry’s supply chain – and an improved awareness across the whole chain in relation to consumer demands.

Such coordination must strengthen the industry’s ability to respond quickly and adapt its products to new opportunities, thereby creating value, and it must accelerate the take up of innovations across the whole sector. Coordination of the sector and its different markets and supply chains, should lead to the uptake of market segment strategies covering breeding and commercialization dimensions.

This enhanced cooperation within the supply chain would lead to an array of positive outcomes for all the actors: improve the production planning on the basis of market demand, organize information/awareness programs to the consumer, as well as product promotion activities/marketing, simplify the uptake of research and innovation for the sector and enhance the export capacity in foreign markets.

b. Firm-level re-structuring including farms and industrial firms (slaughterhouses) so that each partner in the chain is able to invest thanks to a fair level of profitability, develop the business sustainably, and be strong enough to play a full part in the devised strategy.

This firm-level and sector-wide re-structuring goal should (1) be managed taking into account the characteristics of each Member State (and also specific cost issues applying to firms) and (2) take into account the particular characteristics of producing regions in terms of their respective models (suckling, breeding, fattening, etc.).

This is a challenge that bovine meat sector has in common with other agricultural  sectors in intermediate and less favored areas. Therefore, there is undoubtedly a necessity to tackle this Common challenge.

In parallel, enhanced action should be pursued to encourage investments into bio-energies, which can both strengthen the viability of certain farms and contribute to climate change mitigation, aiming towards the life-cycle perspective, by linking production to existing farm resources.

      3. Commercialization. Effective communication systems and quality labels are needed so that consumers are made fully aware of advances in quality, the environment and animal well-being – and so that operators obtain a meaningful return on investment consistent with the market segment and the production infrastructure in place.

An enhanced communication effort should be encouraged in order to highlight the specific features of the EU livestock sector, in particular to differentiate it from feedlots of the American continent.

In Europe, structurally falling consumption makes it necessary to pursue offensive strategies to defend the positions of EU businesses relative to international competition in each of the three market segments, as well as to promote each cut of beef and each partner in the supply chain as effectively as possible by identifying the segment in which it or they would be most successfully marketed.

Marketing and discount sales strategies should moreover be managed so that beef is not a loss leader, and marketing truly focuses on selling surplus stocks; Prices in segment A do not drag prices down across the whole sector.

Internationally, real opportunities exist, especially with respect to live cattle, high-end products (segment C) and co-products.

Effective communication and marketing strategies need to be implemented for both the EU internal market and international markets. An ambitious export strategy should be stepped up, based on efficient tools acting as a lever to develop markets such well-targeted promotion actions.

—–

On top of the usual policy tools included in particular in the CAP, the European Union must mobilize its capacity to strengthen the sector, especially in order to anticipate the impact of trade negotiations that weaken the EU beef meat sector, already confronted with structural and recurring crisis.

Such revitalization plan should not be limited to a policy of budgetary transfers – even though their legitimacy must not be put into question (Coupled Payments, LFA payments). The European Union must go beyond these tools offering levers to structure, modernize and promote the EU suckler herd with the support of well-calibrated financial supports.

The objectives of the toolbox could be summarized as follow:

  • Organization, market segmentation and structuration:
    • Building a strong market-driven business strategy for the whole sector, based on clearly established market segments;
    • At local level: helping producers to invest and make money out of their work (organization, investment, including in bio-energies);
    • Building efficient meat supply chain (including via a proper competition policy and the extension of the milk package – see annex) and more innovative and modern slaughterhouses;
  • To cope with the challenge of market volatility:
    • Building tools, which are able to improve market resilience (ex: mutual funds) to limit the shock in the milk sector, which have in turn collateral effects on the specialized beef sector;
    • Coping with sanitary and climate risks, including taking into account grass land model which is an important carbon traps or fattening systems with climate-efficient feeding and effluent management practices;
    • Achieving greater coordination in the supply chain (between producers and other partners in the supply chain) with enhanced possibility to discuss and negotiate prices and volumes.
    • Setting European multiannual tool to manage extreme crisis; financing without delay exceptional measures to rebalance the market:
    • Triggering, when necessary, market management tools as it has been done for the milk sector in 2016. In certain cases, well organized mandatory storage action could be more easily set up targeting the dairy herd and taking into account the lower level of losses in relation with storage process, than products with higher value. For the suckler herd, possible measure of live storage on the farm might be explored, with the aim to rebalance the market temporarily, covering feed costs, etc.
  • To promote the EU model, its positives externalities and the effort already done in terms of sustainability and, especially, to highlight the viability and specific features of the European beef sector via adequate marketing tools and well-funded promotion campaigns.
  • To enhance private quality scheme and GIs systems: high quality beef could also move in this direction. The idea could be to develop new quality schemes or new criteria (on grass-fed beef for instance or other breeding practices that have a good impact on fat content) linking it with the idea of differentiation (mid-range market). Certain GIs could be developed, especially for the high-end segment. Quality schemes must be able to address consumers’ concerns as well as they could be developed in relation to animal welfare and industrial livestock production methods, while facilitating the marketing of the products.
  • To promote further the sustainability of the EU production systems (innovation, smart policy and consumer awareness), with well-designed climate actions.
  • To Increase and maintain the livestock sector competitiveness in each area (intensive livestock areas vs less developed areas).

EU standards need to be powerful at global level; However, in Europe we cannot forget entry-level products. The focus should therefore not be only on high-quality cuts. We need to be competitive also on these entry-level products which will have to face competition of non EU products and to segment very carefully the EU meat markets in order to limit the potential competition of non EU products on the other market segments.

Farm Europe strongly believes in the potential of the EU beef sector, both economically and in terms of sustainability, against the current pessimistic visions of the future combining de-growth and abandonment of land currently experienced by producers.

The think tank considers an absolute priority to invest and reflect on the future of this sector confronted with structural economic changes.

Of course, given the complexity of this sector, there is no magic wand. Nevertheless, the objective should be to capitalize on the assets of this strategic sector for many regions in Europe, not adopting a defensive approach. In other words, to focus on a true economic ambition for the future.

Implementation of the strategy should help to secure the internal market and reduce imports. Specifically, it is crucial for the European sector to retain control of the high added value segment, which makes it more necessary to have an ambitious strategy for the specialized sector – and consistency in the commercial strategy of the EU overall.

Measures exist within the current framework of the Common Agricultural Policy, which could be mobilized. Beyond that, a strong revitalization plan must be shaped at EU level.

Additional budgetary resources should be targeted on the key elements of an ambitious policy strategy, complementing existing tools, with the objective of leveraging and accelerating the structuring and modernization of the sector by offering to producers the right tools to build on their future. 


References

Research for AGRI Committee – The EU Cattle Sector: Challenges and Opportunities – Milk and Meat – February 2017

http://www.europarl.europa.eu/thinktank/en/document.html?reference=IPOL_STU(2017)585911

Report from the Commission to the European Parliament and the Council – On the impact of animal welfare international activities on the competitiveness of European livestock producers in a globalized world – Brussels, 26.1.2018 COM(2018) 42 final

https://ec.europa.eu/food/sites/food/files/animals/docs/aw_international_publication-report_en.pdf

Vandecandelaere et al. “Strengthening sustainable food systems through geographical indications – An analysis of economic impacts” FAO, Rome 2018

http://www.fao.org/3/I8737EN/i8737en.pdf

EY, Analysis on future developments in the milk sector – Prepared for the European Commission – DG Agriculture and Rural Development, Brussels, 24th September 2013

https://ec.europa.eu/agriculture/sites/agriculture/files/events/2013/milk-conference/ey-independent-experts-analysis-presentation_en.pdf

Press:

https://www.independent.ie/business/farming/news/farming-news/dairy-income-soars-as-beef-and-sheep-farms-survive-on-support-36937078.html

https://www.agriland.ie/farming-news/move-over-dairy-oatly-is-in-demand/

https://www.irishtimes.com/news/environment/irish-farming-under-pressure-to-reduce-carbon-emissions-1.3527011

https://www.euractiv.fr/section/agriculture-alimentation/news/de-nombreuses-filieres-agricoles-continuent-de-travailler-a-perte/

https://ec.europa.eu/info/news/final-figures-reflect-success-eu-milk-production-reduction-scheme_en

EU Dairy Farms Report based on 2013 FADN data. (2016). European Commission Directorate-General for Agriculture and Rural Development, Brussels.

Farm structure survey 2013. Key variables: area, livestock (LSU), labour force and standard output (So) by type of farming (2-digit) and agricultural size of farm (Uaa).

[1]Source: Research for AGRI Committee “The EU cattle sector: challenges and opportunities” – European Parliament – Policy Department B: Structural and Cohesion Policies, February 2017

http://www.europarl.europa.eu/RegData/etudes/STUD/2017/585911/IPOL_STU(2017)585911_EN.pdf

[2] Ibid.

[3] Link to CAP reform proposals: https://ec.europa.eu/commission/publications/natural-resources-and-environment_en

[4] EU budget legal texts available here: https://ec.europa.eu/commission/publications/factsheets-long-term-budget-proposals_en

[5] A decrease between 16 and 20% in constant prices.

[6] Study available here: http://www.agri-outlook.org

[7]Source: https://ec.europa.eu/info/sites/info/files/food-farming-fisheries/farming/documents/agri-short-term-outlook-summer-2018_en.pdf

[8] Source: https://ec.europa.eu/agriculture/milk_en

[9] For updated figures see here: https://ec.europa.eu/agriculture/market-observatory/milk/latest-updates_en

[10] DG Agri estimates based on World Bank (https://ec.europa.eu/agriculture/sites/agriculture/files/statistics/facts-figures/price-developments.pdf)

[11] Document available here: https://ec.europa.eu/info/sites/info/files/food-farming-fisheries/farming/documents/agricultural-outlook-2017-30_en.pdf

[12] Source: https://ec.europa.eu/agriculture/sites/agriculture/files/market-observatory/milk/pdf/market-situation-presentation_en.pdf

[13] Source: DG Health and Food Safety – Overview report – Welfare of Cattle on Dairy Farms, 2017, DG(SANTE) 2017-6241

[14] Source: https://ec.europa.eu/agriculture/milk/policy-instruments_en

[15] See here: http://www.consilium.europa.eu/en/press/press-releases/2018/01/29/skimmed-milk-powder-council-modifies-rules-on-public-intervention-to-help-the-market/

[16] Source: ZBIGNIEW Gołaś DOI: 10.5604/00441600.1245843 University of Life Sciences
Poznań Problems of Agricultural Economics 3(352) 2017, 19-40

[17] With a linear causality between farms’ characteristics with their margin, except for cow herd size.

[18] Source: http://www.fao.org/3/a-BT100e.pdf

POLITICAL NOTE A cereals sector ready to meet its challenges

Summary

Cereal production in the European Union has boomed thanks to the Common Agricultural Policy and has become today the third largest in the world with 306 million tones expected in 2018 or 14.6% of global production.

Presented on the international market – with 33.5 million tones exported or 11% of its production – in a context of increasing demand (due to cereal consumption up 40% in 15 years) this production is currently not in a “comfortable and installed” posture.

Competition in traditional international markets has been fierce since the recent boom in exports in the Black Sea region with stabilizing at 60 million tones or 1/3 of world trade. Challenges are also present within the EU, starting with stagnant yields in the West, the impact of regulation on plant protection products and the pressure of climatic hazards such as historical drought this summer.

For the industry to avoid stalling and to overcome these challenges multiple levers of action are available. Adopting a digitized grain farming will optimize the environmental and economic performance of grain farmers. Establishing a European crisis management fund in agriculture that efficiently provides for and generalizes climate insurance will make it possible to deal with the consequences of climate change and the high volatility of the markets. Abandoning tillage and adopting direct seeding could support the agronomic and economic performance of cereals as long as the technical means are or remain at the “rendezvous”.

In such a context, the value chain must be able to rely on a CAP that better protects farmers’ income in a context of high price volatility and that further supports investment in innovation for a transition to successful models. This note presents the challenges and recommendations for modernizing the industry and shaping a CAP with strong common tools coupled with the necessary and targeted flexibilities to build an ambitious strategy that effectively articulates community tools and national or regional actions.


Table of contents

I – The European cereals sector: characteristics and challenges…………………………… 1

A Panorama of the European industry………………………………………………………………….. 1

a/ General data…………………………………………………………………………………………………. 1

b / Importance of the sector for the competitiveness of the livestock and ethanol sectors    3

B External challenges……………………………………………………………………………………………. 3

a / The rise of Ukraine……………………………………………………………………………………….. 3

b/ The Russian boom…………………………………………………………………………………………. 4

c/ Global demand, the challenge of food security……………………………………………… 5

C Internal challenges…………………………………………………………………………………………….. 6

a / Lower income of farmers……………………………………………………………………………… 6

b / Volatility of the market……………………………………………………………………………….. 7

c / Climatic risks……………………………………………………………………………………………….. 7

d / Availability of plant protection products…………………………………………………….. 8

e / Environmental sustainability and crop yield………………………………………………… 9

f / Current reform of the CAP…………………………………………………………………………….. 9

II-Succeed in a fierce competition……………………………………………………………………… 10

A Market expectations……………………………………………………………………………………….. 10

a/ Becoming a global leader in the world again………………………………………………. 10

b / Do not lose weight on the EU market…………………………………………………………. 11

B Action levers……………………………………………………………………………………………………. 12

a / The digitalization of agriculture…………………………………………………………………. 12

b / Insurance tools for managing volatility, European fund for major crisis management in agriculture.         12

c / Genetic improvement to meet societal expectations and adapt to climate issues                 13

d / Cultural methods……………………………………………………………………………………….. 13

e / Logistics aspects: storage and transport………………………………………………….. 14

III- Conclusion: a winning strategy for the EU cereals industry………………………… 15

A The first pillar………………………………………………………………………………………………….. 16

B The second pillar……………………………………………………………………………………………… 17

C Outside the pillars…………………………………………………………………………………………… 18


I – The European cereals sector: characteristics and challenges

A Panorama of the European industry

a/ General data

State of play in 2017 – 2018  

Considering together the three main cereals produced – namely wheat, barley and grain maize (85% of EU cereals production in 2016) – the European Union, with a production of 275.2 million tones or 14% of world production, ranks third behind China and the USA. Almost 48 million hectares are cultivated for this purpose, representing 27% of the EU’s UAA. 33.4 million tones will be exported during this year or almost 1 tone of cereals out of 8. The economic weight of cereal production is about 46.8 billion euros.

With 151.2 Mt of wheat (hard and soft), the EU is the world’s leading producer ahead of China and Russia. 27 million hectares are cultivated, with an average yield of 5.6 t/ha (soft wheat). 24.4 million tons will be exported during this year.

The EU is also the world’s largest producer of barley, at 58.8 Mt, ahead of Russia and Australia. 12.3 million hectares are cultivated, with an average yield of 4.8 t/ha. 8 million tones will be exported during this year.

Finally, for maize, with a production of 65.2 million tones, the EU ranks fourth in the world, behind the USA, China and Brazil. 8.6 million hectares are cultivated, with an average yield of 7.6 t/ha. 1 million tones will be exported during this year.

Trends since 2000

From 246 tones to 277 million tones (Mt), European cereal production – wheat, barley and maize – increased from 12.5% in the EU to 28. Cropping decreased by 2.2 million hectares (-4.5%), but average yields increased by 1.25 t/ha (+ 25%). It is in Central European Member States (EU-13) that this increase has occurred with an average of 92.5%. While this increase was only 5.6% on average in Western Europe (EU-15). As for exports, they rose – between 2012 and 2017 – from 28 Mt to 33.5 (+ 21%), or from 13.5% to 12.1% of production.

Since 2000, European wheat production has risen from 133.4 Mt to 152.3 Mt (+ 14.2%), and the area decreased from 26.8 million hectares to 26 million hectares (-3%). Average yields increased from 5.3 to 6.1 t/ha (+ 14%) but this hides a clear disparity. Yields (soft wheat) stagnated in the EU-15 (from 6.7 to 6.8 t/ha (+ 1.5%)) and strongly increased in the EU-13 (from 3.2 at 5.1 t/ha (+ 59%)). As for exports, they increased from 19.2 to 23.5 Mt (+ 22%) between 2012 and 2017.

Since 2000, barley production has stagnated, falling from 60.3 to 59.3 Mt (-1.7%), on areas that declined by 15%, from 14.2 to 12.1 million hectares. Yields increased by 15.3%, from 4.25 to 4.9 t/ha with a strong geographical disparity again. They stagnated from 4.8 to 5 Mt (+ 4.2%) in the EU-15 and grew from 2.5 to 4.4 Mt (+ 76%) in the EU-13. The volume of exports also increased, from 10.4%, from 6.7 to 7.4 Mt (2012-2017).

Finally, maize has experienced the highest growth over the period in the EU. Although the surface area decreased by almost 14%, from 9.7 to 8.4 million hectares, the volumes produced and exported grew strongly, respectively by 24.6% – from 52.7 to 65.5 Mt. – and 45.4% – from 1.8 to 2.6 Mt – thanks to the clear improvement in yields, from 5.4 to 7.8 t/ha (+ 44%). Here again, yields in the EU-13 rose the most, from 2.6 to 6.3 t/h (+ 142%), while growth was 11% in the EU-15, from 9.1 to 10.1 Mt.

b / Importance of the sector for the competitiveness of the livestock and ethanol sectors

With 157.4 million tones consumed in 2016-17 (57% of production), cereals produced in the EU rank first in the protein diet of the EU livestock sector (59%). This is followed by 84.1 million tones of co-products from cereals and oilseed crops (31.5%) and 18.3 million tones of imported cereals (6.9%).

Note: Of the 84.1 million tones of co-products, 18.3 million tones (22%) were soybean meal imported from North and South America.

Of the 25.8 million tones of feedstock consumed by the ethanol industry in 2016-17, cereals produced in the EU accounted for 13.2 million tones (51%) and sugar beet 12.6 million tones (49%). 4.5% of European cereal production was consumed by the ethanol sector.

B External challenges

The Black Sea Basin has grown considerably over the past five years, with Ukraine and Russia in the lead, currently accounts for 1/3 of world grain trade (60 million out of 180 tones).

a / The rise of Ukraine

After a collapse following the dismantling of the USSR, Ukraine is on its way to becoming Europe’s “bread basket” again. Indeed, the reforms of its agricultural sector now give Ukraine the means to fully exploit its considerable natural advantages.

First of all, there is the remarkable fertility of the famous “black soils” or “chernozom”, which is rich in potash, phosphorus and trace elements due to a high percentage of humus. In addition, there is a notable topographical advantage – very large cultivable plains that account for 90% of the national surface – and a favorable climate for growing cereals. The Useful Agricultural Area (UAA) amounts to 70% of the territory, i.e. 42 million hectares

After that, there is the considerable effort made to restart the production apparatus.

The independence of Ukraine in 1991 was accompanied by a dismantling of the Soviet apparatus that had fallen into disuse followed by a complete collapse of the agricultural production apparatus. In 1999, a law laid the foundation for renewal, allowing the almost total liquidation of collective farms and the first steps towards land privatization. Very low annual rents, a very favorable tax system for agricultural enterprises was established in 1998, virtual VAT exemption in 1999, and panoply of state aid to Ukrainian farms attracted foreign investors. In Ukraine, low production costs can be found (2 to 3 times lower than France for example) in particular thanks to very low fixed costs and regulations on the use of pesticides that are less stringent than those of the EU.

The increase in volumes produced and exported has also been facilitated by joint support from FAO and the EBRD. This has facilitated dialogue between the public and private sectors, and the creation of a more favorable political environment for the arrival of foreign investors. This joint support has also trained many Ukrainian farmers for a better crop protection management and improved crop storage.

Finally, the decline in the national consumption of cereals in recent years increases the volumes available for export. The maritime facades on the Black Sea and the Sea of Azov favor the export activity.

This is a real agricultural revolution that the country has been experiencing for 20 years, and which led in 2009 to the world leader in barley and sunflower exports, in 2nd place for rapeseed, 4th in maize, 6th for wheat and 8th for soybeans. Since 2010, cereal production has increased 55% to 64 million tones in 2017 (26 of which are wheat) and exports 284%. 50% of the volumes exported are destined for Asia, and 30% of the EU, with which Ukraine has concluded an association agreement that came into force in September 2017. It should be noted, however, that this country, like Russia whose evolution is analyzed below, is particularly subject to the impacts of climatic hazards, generating very large variations in the quantities produced from one year to the next.

b/ The Russian boom

Russia’s agriculture is also booming. Here too, it is based on natural assets. The western part of this “state-continent” is a vast plain, where black soils are also present, especially in the southern part. But if Russian agricultural production has exploded in the last 3 years, it is mainly due to political will. Following the economic sanctions of the United States and the EU on the Russian energy sector in 2014, Russia responded with sanctions on a wide range of imported food products. The sanction extended to Turkish food commodity after the destruction of a Russian aircraft in Syria. The sanctions were accompanied by the announcement of the national goal of food self-sufficiency by 2020.

To achieve this goal, local and foreign investments are greatly enhanced by tax incentives. Modern technologies, the supply of machinery and fertilizers has been widely deployed. In addition to having exceeded the US harvest quantitatively since 2015, Russian wheat production is favored for export by higher protein content. This is due in particular to the variety breeding efforts in Russia, to obtain nowadays winter wheat varieties adapted to the rigors of the climate and having a protein content of up to 15 to 18% while maintaining yields high of the order of 100-120 q / ha.

The available space is also an asset for Russia to reach its goal of food self-sufficiency. It has undertaken the recapture of millions of hectares of agricultural land abandoned since the fall of the USSR.

The results are clear: the amount of Russian wheat exports in 2015 was $ 20 billion. At the same time, the share of EUA in the international wheat market increased from 50% in the 1970s to 15% in 2017. And Russia reduced its international food purchases by 40% between 2013 and 2015.

Initially estimated at 85 million tones, the 2018-19 Russian wheat crop will be smaller but still expected to reach 70 Mt, and exports 35 million tones.

c/ Global demand, the challenge of food security.

The food crises, that the world has experienced since 2007, and the already recognized impacts of climate change have reminded us that the food issue does not belong to the past but that it is a current issue that organizations such as FAO regularly and consistently recall.

This must be a topical concern for the European Union, which must be to:

  • produce to ensure sufficiently effective independence for European citizens;
  • produce responsibly and sustainably in a world where natural resources are fragile and limited. Responsible: by refusing to outsource to other parts of the world our resource management duties. Sustainable: because we are indebted to future generations for their ability to feed themselves and evolve in quality spaces;
  • contribute to global food security by both developing regional agriculture through development policy and being a reliable supplier of global markets. Indeed, as the only major agricultural area in the world with relatively stable production conditions, the European Union has a special responsibility: to contribute regularly to the supply of structurally demanding global markets. And all the more so because the stability of world markets is a decisive element:
  • the development of agriculture in less developed regions in an open world.
  • the geopolitical stability of structurally deficit regions by their ability to provide their populations with sufficient and affordable food
  • the ability to help limit migration crises.

The European Union and its agricultural sectors must put themselves in a position to respond in a sustainable way to the increase in global demand for food and particularly in the case of cereals intended for human consumption, which is an unavoidable and often basic source of food for whole regions, but also to have the capacity to be present in the other market segments where demand is growing (starch plants, malting plants and animal feed). It is an economic responsibility and also a major political responsibility as well.

C Internal challenges

a / Lower income of farmers

Several factors are responsible for the decline in income experienced by EU cereal producers in recent years.

First, there is the influence of global market parameters. In the case of soft wheat, the world supply is slightly above demand since 2015, which leads to low prices in the face of production costs and to compensate producers. The low yields in the EU this year (2017-18), but also in Russia, Australia and the United States, reversed the trend and therefore allowed the price of common wheat to rise to more than 200 euros per tone in Rouen.

At the same time, the cost of growing cereals has increased, mainly due to plant protection products. In some Member States, this expenditure item has increased for farmers by 40% in 20 years because of higher and higher certification costs, and increasing taxes for diffuse pollution.

The increase in the cost of energy as well as the need for more and more precise equipment and sophisticated equipment are added.

With regard to Community aid, the decrease is first of all due to a progressive erosion of the value of direct payments in recent years, accentuated in the Member States, which have made the choice to transfer large amounts of aid from the 1st towards the 2nd pillar. Grain farmers are also affected by the choice of Member States to opt for CAP extra-decoupled subsidies for the first hectares, which particularly impacts large farms in intermediate zones with an already fragile economic balance.

b / Volatility of the market

A few years ago, the cereal market could be described as “flat” and relatively predictable. The prices reacted especially to the jolts of the weather. Increased demand, higher oil and freight costs and financial markets have increased their share of volatility. As for the jolts of the weather, they are now more frequent with larger amplitude due to global warming and stronger reactions from largely financialized markets.

Price variations are now characterized by their suddenness and brutality. From about 15 euros per ton over a campaign, the range can now exceed 100 euros per ton.

c / Climatic risks

Current climate change is causing an increase in the frequency of “extreme events”, whether it is to be precipitation, temperature, or unusual winds. For agriculture, this usually results in reduced yields and greater variability of these.

Cereals, particularly durum wheat and winter barley, are particularly subject to the phenomenon of lodging, which the stormy or beating rains favor, and which causes a loss of yield, a decline in grain quality and an extension harvest time.

Unusually heavy rainfall causes the soil to become saturated with water, disrupting the extension and functioning of the root system.

On the other hand, yields are also impacted by drought, especially in areas where soils are superficial with little useful reserve, and during cereal run-off. The drought in part of Europe in the summer of 2018 is an example.

Faced with these growing threats, farmers are currently deprived, especially because of a development that remains low on climate insurance.

d / Availability of plant protection products

Like any crop, cereals require protection against pests, whether they be micro or macro organisms, and to promote weed cultivation. But farmers are now facing a scarcity of approved substances, an increase in pressure due to climate change and therefore face the challenge of finding effective alternatives quickly.

With regard to insecticides used to protect crops, the current challenge for farmers is the neonicotinoid class, which has been widely disseminated since the discovery in 1985 of imidacloprid. These insecticides have taken the place of organochlorines and organophosphorus such as DDT and have become the most used insecticides in the world because (being used mainly in seed coating) prophylactically they prevent the spread of aerial spraying. But because of their low biodegradability and toxicity to insects, they are concentrated in food webs and are mentioned as a cause of death in pollinating insects. EFSA confirmed this danger in its conclusions in February 2018 for three types of bees evaluated.

On 27 April 2018, the majority of European Union states voted to ban three neonicotinoids (clothianidin, imidacloprid and thiamethoxamur) from 2019 for all field crops in the EU with the only exception is greenhouse use.

The cost of banning neonicotinoids for rape cultivation in the EU has recently been estimated at 900 million euros per year. On wheat and barley, imidacloprid makes it possible to avoid yield losses of the order of 20 to 30% caused by dwarfing jaundice.

Regarding the herbicides used for grain farming, the main subject is related to the debates that exist on glyphosate. While the license to exploit the molecule (discovered in the 1950s) came to an end in December 2017, Member States voted in November for a five-year extension. In October 2017, the European Parliament voted – in a non-binding manner – to phase out glyphosate by 2022.

To this day, such a ban would push most European farmers to use more expensive and sometimes more dangerous herbicides, and return to weeding through tillage with its environmental consequences. The extra cost would be real. The average use of this product is for Belgium of 1.81 kg per hectare

and 1.56 kg for the Netherlands against the 1.10 kg for France or the 1.00 kg for Germany. For comparison, the extra cost has been estimated for French agriculture at 2 billion euros per year.

e / Environmental sustainability and crop yield

In agriculture, the main compartments of ecosystems concerned by sustainability are cultivated soil and water.

Some soils in cereal areas in the EU suffer from subfertility[1]. Several causes are cited to explain this trend, such as shorter rotations, decreased use of organic amendments, excessive nitrogen inputs, which favor organic carbon mineralization, and deep plowing, which disrupts microbial life in the soil therefore the synthesis of nutrients available to plants. In 2008, the European Commission estimated that 45% of European soils had a very low organic matter content, with less than 2% organic carbon, in southern European countries, but also in France, the United Kingdom, Germany and Belgium[2].

In several EU cereals countries, particularly the EU-15, cereal yields have at least stagnated over the past 15 years. In this respect, there are more hypotheses than certainties. The reconversion of good cereal lands into urbanized areas, and at the same time, the reversal of grasslands in areas less optimal for cereals is a hypothesis. The depletion of some soils in organic carbon is another[3].

The use of herbicides for the control of weeds is receiving increasing attention because of the risk of runoff from these surface products. [4]

f / Current reform of the CAP

In the context of a decline in the profitability of the sector, the budgetary and reform proposals of the CAP accentuate the threats to the cereals sector. They would cumulatively result in an average decline in European farmers’ income of between 16 and 20%. On one hand, the impact of the 12% drop in the CAP budget (constant euros) would cause a drop of more than 8% in the Community average income, with particularly strong negative effects for the arable crops sectors, where Direct payments represent a significant part of income. For the cereals and oilseed crops sector, the Commission’s impact assessment estimates a 6% drop in income in the case of a 10% reduction in income support. On the other hand, according to the European Commission’s own admission, in its impact study, the reform proposals presented on 1 June would generate an additional drop of between 8 and 10% of agricultural income according to the options chosen by the Member States.

Such a strategy would inevitably lead to the exit of farmers with the abandonment of territories especially in intermediate zones, as well as an expansion of farms. It would slow down investment capacity and generational renewal, despite the tools proposed for young farmers who could not compensate for the decline in income announced elsewhere.

As for the new implementation method proposed in the reform of the European Commission, such an evolution – which opens the way to a renationalization with a major transfer of responsibility for the first pillar to the Member States – would severely put in competition their regulatory frameworks with of course advantages, in terms of competitiveness, for the less-involved in environmental matters. This development would also be a shift from the CAP towards a programming mainly managed in a bilateral relationship between national agricultural administrations and the services of the European Commission instead of the direct relationship between EU co-legislators and its beneficiaries, farmers.


II-Succeed in a fierce competition

A Market expectations

a/ Becoming a global leader in the world again

While competitors in the Black Sea are in full conquest of grain export markets, particularly with regard to the first grain exported, namely wheat, the European Union has fallen sharply over the past three years. All cereals combined, its exports fell by almost 30%.

The share of soft wheat of EU origin in imports fell by 19% in Morocco, 49% in Cameroon and 52% in Senegal between 2015-16 and 2016-17.

For EU cereal producers, if there is indeed a challenge in terms of grain quality, linked to the requirements of bread making, a substantial challenge lies in the quest for increasing competitiveness. Indeed, lower protein and gluten levels of EU wheat can be inexpensively corrected in importing countries. It is in fact by their very low prices that make the difference for the Russian and Ukrainian producers and the very quickly gained export markets. The challenge is such that, in order to be raised, it requires an increase in yields by EU producers and a reduction in operating expenses.

b / Do not lose weight on the EU market

The first consuming area for cereals of EU origin is the European Union itself. There is therefore also a strong challenge of competitiveness of EU cereals within itself. And this challenge is increased tenfold by the external supply more and more abundant and quality.

The EU imports of all cereals have increased by 137.5% between 2009-10 and 2016-17.

The competitiveness of European cereals in the EU market itself inevitably raises the question of the rules applying to imports.

The European Union has adopted one of the highest standards in the world in terms of both social and environmental rules. What about imports?

To be positive, the opening of Community markets presupposes that the same rules apply to European productions and imports. It is certainly true of the relative competitiveness of European farmers and the respect of European Union consumers who legitimately believe that imports accepted on the European territory present an equivalent level of requirements.

However, it must be noted that this is not the case. The example of imported organic products is striking. Recent cases in the animal sector for South American products are in mind. In the plant and cereals sector, divergences in authorized or unauthorized cultivation routes, authorized or unauthorized varieties …. tend to be accentuated, while in parallel trade negotiations lend little or no attention.

B Action levers

a / The digitalization of agriculture

In order to gain competitiveness and sustainability with an increase in yields accompanied by a reduction in their operating costs, EU grain growers have a privileged solution: the digitization of agriculture.

Digitization of agriculture is a way to optimize the use of treatments on crops. The aim is to use digital technologies and geolocation to better characterize the soils of the farm and to take into account intragroup heterogeneity thus bringing “the right dose of inputs-water, fertilizers, phytosanitary products – to the right place and at the right time”. Among the inputs, phytosanitary treatments in particular have high costs both economically and environmentally. It is therefore an absolutely central position to achieve the dual performance objective of farms.

Studies in a network of farms on wheat and maize are already showing tangible and promising results in terms of benefits per hectare (from 80 to 200 euros/ha) and reduction of inputs (from 30 to 70 %) (Leader Farms, InVivo). In Greece, an experiment carried out on 9 pilot sites – 3 devoted to arboriculture and 2 to arable crops – estimated that the average savings achievable for plant protection products could reach 63%.

 b / Insurance tools for managing volatility, European fund for major crisis management in agriculture.

In the context of the current CAP reform, there is no further progress in the tools needed to ensure the resilience of farms in the face of climate hazards. The advances offered by the Omnibus – the loss rate for the triggering of mutual funds and climate insurance increased to 20% (instead of 30%), and the co-financing of premiums increased to 70% (instead of 65%) – are recent and are hitting on the national budget trade-offs of CAP means to allocate or not to risk management. This management must become a priority to effectively ensure the economic resilience of farms.

The reform of the crisis reserve to make it multiannual and thus more operational is proposed, but no sufficient means are foreseen to constitute a fund with sufficient resources. There is also an important gap that the Community legislator has to fill.

The establishment of a European Crisis Management Fund in agriculture, financed by an adequately equipped multiannual crisis reserve, must be carried out in order to reduce the cost of reinsurance for climate insurance and take over IST tools from the outset when risks become deep crises (see related Farm Europe note).

At the same time, the next CAP should recognize the value of encouraging farmers to set up precautionary savings. If the tax incentive related to such a device is the responsibility of the Member States, it would be appropriate for the CAP to hold at the level of the European Union what constitutes legally and in accounting such precautionary savings, as well as some basic principles for simple use of this savings.

c / Genetic improvement to meet societal expectations and adapt to climate issues

In the late 1960s, a wheat-breeding program aimed at replacing fungicide treatments with through the use of disease-resistant varieties has increased the genetic diversity of wheat by introducing resistance to rust and trampling.

Today, the selection work focuses on a global approach to hardiness, by working on resistance to diseases, on a better valorization of the available nitrogen, on the competitiveness vis-à-vis weeds, or the tolerance to drought.

In terms of the methods available to carry out the improvement work, the possibility of using new breeding techniques in the EU remains a subject of question to which the Commission and the co-legislators must have the courage to harness following the reading of the current regulation made by the Court of Justice of the EU in late July.

d / Cultural methods

Cultural practices and especially tillage are a way to try to regain growth in yields. A meta-analysis published in October 2017, based on work conducted in 62 regions, has confirmed worldwide that non-tillage generates more microbial biodiversity itself allowing a better fertilization of the soil in assimilable mineral elements by the plants[5]. Another study, conducted in Switzerland from 1994 to 2004, revealed significantly higher yields of pulses and cereals in direct seeding[6].

However, no-till requires management of weeds and the destruction of the majority before planting, otherwise farmers will feel the need to return to deep plowing.

e / Logistics aspects: storage and transport

Every week, around 4 million tones of cereals and oilseeds worth € 1 billion circulate in the EU. Hence the importance of ensuring optimal storage and transportation of these goods, in order to avoid supply shortages and increased price volatility.

Storage

Less than 15% of the cereals produced are self-consumed on the farm. Everything else is marketed to downstream companies, be they processing or exporting, and so it depends on the collection and storage centers. Storage is an essential link in the logistics chain that enables the EU to play its role in stabilizing the world’s food supply.

Storage capacity for COPs in the EU increased by 20% between 2005 and 2015, reaching 359 million tones, while production increased by 11% to 346 million tones. However, a risk remains in places, calling for necessary investments. They are all the more necessary, as price volatility requires strategic management of stocks and therefore increased capacity. In Central Europe, deficits faded (by 3.9 Mt in Poland), turned into a surplus (of 5.3 Mt in Romania), and even overcapacity increased (in Hungary and Bulgaria). In Western Europe, only Spain managed to obtain a substantial capacity surplus (3 Mt). It is in Denmark, the United Kingdom and Germany that capacity deficits have deteriorated the most.

To address bottlenecks, the appropriate location of additional storage capacity (eg in key transport hubs or export terminals) and access to an adequate logistics infrastructure are of critical importance. Access to public funds more diversified than only those of the EAFRD appears necessary for this.

The transport

Roads, railways and inland waterways play different roles in the transport of COPs, and are often combined. For the three types of transport and the four main traffic corridors of the COPs (Rhine-Danube, Rhine-Alps, Baltic-Adriatic and North Sea-Baltic Sea), bottlenecks persist.

The improvement of the channel conditions of inland waterways, especially along the Danube – 18 bottlenecks have been identified – presents important investment opportunities, especially so that the growing Romanian, Hungarian and Bulgarian productions are better valued. Future investments should also focus on improving the interoperability of railways in order to improve efficiency and reduce waiting times in cross-border terminals, particularly in Germany and Austria. Future investments should also aim at improving regional transport connectivity, to address congestion problems on motorways and railways by extending capacity to critical locations and sections – such as Alpine crossings to Italy – and the construction of bypass routes.


III- Conclusion: a winning strategy for the EU cereals industry

European agriculture faces common challenges that can only be solved effectively if Europe is united.

Community coherence in financial support tools for farmers and related environmental objectives is therefore essential. On one hand, it makes it possible to avoid a competition, which would turn to the advantage of the less attentive as for the respect of the environment. On the other hand, it avoids the concentration of aid on targeted sectors in order to compete with these sectors in the other Member States.

The excessive level of subsidiarity and flexibility, the fragmentation of the policy framework, as well as a reduced level of ambition with regard to the CAP budget, is all elements that could transform the EU agricultural market into a battlefield. This one would see 27 different agricultural strategies to be measured between it, or even to face each other.

With the adoption of the European Parliament’s report on the Future of the Common Agricultural Policy on 16 May 2018, MEPs opted for a balanced approach calling for a “reasonable level of flexibility within a strong common framework of rules, the basic standards, intervention tools, controls and financial allocations agreed at European level by the co-legislator to ensure a level playing field for farmers”. They stressed the need to secure the direct relationship between EU co-legislators and beneficiaries – farmers – and not to transfer most of the management of the first pillar to the Member States.

The winning strategy for the EU cereals industry must keep this solid base at Community level, within the first pillar, while retaining the necessary flexibility for adjustments at local level.

This winning community strategy, driven by the CAP, should be the ambition to take all European agriculture towards double performance over the next 7 years.

Recommendations, based on different challenges and aiming to embody the dual performance in the CAP are presented below.

A The first pillar

Recommendation n°1

The guarantee of a minimum of 60% of the first pillar (before transfer) devoted to the financing of basic decoupled aids is a necessary measure in the face of the challenge of the fall in cereal income, given the importance of CAP aids in income cereal farms. Without this, cereal area risks falling sharply – up to 7% according to the Commission’s impact study – in favor of a reallocation to other crops or even an agricultural abandonment.

Recommendation n°2

The creation and the adequate endowment of a multi-year crisis management fund is a key point, alongside climate insurance, ISTs and precautionary savings to effectively meet the challenges of climate change and price volatility.

Recommendation n°3

Promoting digitized agriculture in the first pillar, by including a lump-sum incentive for the transition to dual performance in the Eco-Scheme, should be a priority of EU agricultural policy. This means should be favored to achieve double performance and thus meet the following three challenges: that of export competition on the globalized market, the gains in competitiveness obtained, environmental sustainability and regulatory pressure on phytosanitary products by optimizing inputs.

Recommendation n°4

Recognize within the first pillar the actions taken in the field of agro-ecological transition of farming systems that maintain and develop the production capacity of the European Union.

B The second pillar

The second pillar of the CAP should be mobilized as a priority to support the investment and training of farmers engaged in the transition of dual performance.

Recommendation n°5

Prioritize the mobilization of MAEC, investment and training tools – within the second pillar – farmers making the transition to double performance. This is a prerequisite for a broad expansion of digital agriculture. Such a technological revolution can only occur with human accompaniment at the height of the changes. 

Recommendation n°6

Recognize complementarity and the necessary balance between the environment and the economy in the 2nd pillar of the CAP by adopting a double rule of at least 30% of the funds towards environmental measures (measures in favor of less-favored areas included) and at least 30% of 2nd pillar’s funds towards economic measures (investments, training, advice, risk management).

Recommendation n°7

The allocation of insurance tools for climate risk management and Income Stabilization Tools must be a priority for the Member States in their implementation of the CAP, to face the challenge of increasing price volatility, as the financialization of markets and climate hazards favor.

Recommendation n°8

The introduction of strong measures in the second pillar in favor of development investments for varietal improvement of cereals, for innovation investments in digital technology, robotics and bio-control, is a measure complementary to cope with climatic hazards.

Recommendation n°9

The promotion of cooperation between the actors of the cereals sector and the public authorities in the Alps, the Danube and between France and the Benelux is necessary to solve the logistical challenges that threaten the flow of cereals.

C Outside the pillars

Recommendation n°10

Maintaining the CAP budget allocation at the current level of the EU-27 is an essential measure to participate in the construction of a strong and competitive European cereal agricultural sector and effectively addressing the challenges of sustainability with the digitization of agriculture and an adequate management of risks and crises.

Recommendation n°11

As a prerequisite to any commercial agreement, put the requirement of respect for European rules and production standards (environmental and social) by imported products.

Recommendation n°12

Revisit Directive (EC) 18/2001 in the light of scientific developments since 2001 in terms of varietal selection and clearly define, on a scientific basis, the legal framework to be applied to traditional techniques of mutagenesis, to transgenesis techniques (GMOs) and new techniques of site-specific mutagenesis.


The table below summarizes the challenges facing the industry and the subsequent Farm Europe recommendations.


Challenges Recommendations
-Lower grain income 1– To devote at least 60% of the first pillar to the funding of basic decoupled aids
-Climatic hazards

-Volatility of prices

2- Set up a European multiannual crisis management fund for agriculture
-Competition for export

-Environmental sustainability

-Pesticides

-Grain income drop

3- Promote digital agriculture by including in the first pillar a flat-rate incentive for the transition to dual performance through the Eco-Scheme
-Environmental sustainability

-Grain income drop

4- Recognize in the first pillar the actions taken in terms of agro-ecological transition of farming systems
-Competition for export

-Environmental sustainability

-Pesticides

-Grain income drop

5– Prioritize mobilization of MAEC, investment and Pillar 2 training tools for farmers transitioning to dual performance

6– Devote at least 30% of the 2nd pillar to economic measures (investments, training, advice, risk management).

-Price volatility 7- Financially endow the insurance tools for climate risk management and second pillar Income Stabilization Tools
-Climatic hazards 8- In the second pillar, put in place investments in research and development for varietal improvement of cereals
– Logistics 9– Promote co-operation between Cereals and public authorities in Alpine and Danube MS + complete the Seine-Nord Canal
– Lower grain income 10- Maintain CAP budget allocation at current EU-27 level
-Environmental sustainability

-Grain income drop

11- Put as a prerequisite to any commercial agreement the requirement of respect for European rules and production standards
-Competition for export

-Environmental sustainability

-Pesticides

-Grain income drop

-Climatic hazards

12- Revisit Directive (EC) 18/2001 in light of the scientific developments since 2001 in the field of varietal selection


[1] Some soils lost up to 2 gr / kg / year between 1978 and 2003. Report The State of soil in Europe, European Environment Agency, 2012, pages 13 and 14

[2] Report The State of soil in Europe, European Environment Agency, 2012, page 10

[3] Agreste Primeur, Number 210 – May 2008

[4] “In metropolitan France, the molecules found in groundwater and rivers are mainly herbicides. They alone accumulate more than 80% of the detections in the streams! »Phytosanitary guide, Edition 2017.


[5] Stacy M.Zuber, María B.Villamil, Meta-analysis approach to assess effect of tillage on microbial biomass and enzyme activities, in Soil Biology and Biochemistry, Volume 97, June 2016, Pages 176-187

[6] Andreas Chervet et al., Soil performance and parameters after 20 years of direct seeding and tillage, Swiss Agricultural Research 7 (5): 216-223, 2016. The organic carbon content in the topsoil was significantly higher in direct sowing only in plowing.


POLITICAL NOTE A sugar beet sector ready to meet its challenges

Summary

The European Union produces around 50% of the beet sugar consumed worldwide, making it the world’s largest producer of beet sugar. However, beet sugar accounts for only 20% of world sugar production; the rest is produced from sugar cane. The EU is the third largest sugar producer in the world.

Sugar beets are grown mainly in northern Europe, where climate and soil are best suited. The most productive regions are northern France, Germany, Poland, the United Kingdom, the Netherlands and Belgium. The EU also has a refining sector for imported raw cane sugar.

In order to support the European producers and processors, the sugar sector was initially subject to production quotas and minimum prices. However, the quota system ended on the 1st of October in 2017 which was immediately accompanied by a boom in domestic production. It is in this entirely new context that the European Union’s beet sector is taking place.

The world sugar market is characterized by the presence of extremely competitive competitors, like Brazil and Thailand. The 2017 world production reached an historical level of 190 Mt (for a world consumption of 180 Mt), which led to a 50% price collapse since 2017. The currently very low prices exposure of the world sugar market is plunging the European beet sector into crisis.

The Brexit, the Mercosur agreements, the ban on neonicotinoids, the societal pressure on sugar consumption constitute so many additional threats on the EU sugar beet sector. This while a reform of the Common Agricultural Policy is in incubation.

However, there are levers of action that could be employed positively to sustain production in the most competitive areas of the sector. The digitization of agriculture, genetic improvement work, the promotion of the “EU-origin” biofuel sector and a strengthened single market all have benefits to be brought.

Faced with many challenges, and to activate the existing levers of action, the EU sugar beet sector must be able to rely on a CAP that supports producers in the most competitive areas to meet the challenges of global competition and which supports producers in less competitive areas towards a reconversion.


Table of contents

Introduction. 1

I- EU Beets sector: characteristics and challenges. 1

A The EU beetroot sector. 1

a/ General data. 1

b / Importance of the sector for the sugar, livestock and ethanol sectors. 1

B External challenges. 2

a/ A market under pressure. 2

b/ The EU-Mercosur Agreement 2

c/ The Brexit 3

C Internal challenges. 3

a / Facing greater volatility. 3

b / The bargaining power of planters in the sector. 4

c / Availability of plant protection products. 4

d/ Divergence of markets. 5

e/ Decrease in domestic consumption. 5

f/ Current reform of the CAP.. 6

II-Succeed in the heart of a fierce competition. 7

A Market expectations. 7

a/ To remain a leader in the world. 7

b/ Do not lose weight on the EU market 7

B The levers of action.. 7

a/ The balance of power within the sector. 7

b/ The digitalization of agriculture. 7

c/ Phytosanitary treatments. 8

d/ Genetic improvement 8

f/ Community coherence. 9

III- Define a winning strategy adapted to the context 9

A In areas reputed historically as competitive. 10

a/ 1st pillar recommendation. 10

b/ 2nd pillar recommendation. 10

B In areas reputed historically as uncompetitive. 11

a / 1st pillar recommendation. 11

b/ 2nd pillar recommendation. 11

C In both types of zones. 12

a / Recommendation related to the single CMO.. 12

b / 1st pillar recommendation. 12

c / Non-pillar recommendation. 12

D What kind of CAP for the EU Beet sector?.. 14


Introduction

I- EU Beets sector: characteristics and challenges

A The EU beetroot sector

a/ General data

State of play in 2017

With more than 140 million tones, the European Union is the world’s largest sugar beet producer ahead of Russia and the United States of America. France, Germany and Poland are the leading producers in the EU.

1.68 million hectares are devoted to this crop, with an average yield of 85 tones per hectare. To obtain sugar, bioethanol and pulps, this production is totally transformed on the territory of the EU.

Trends 2000 – 2016

 The production has experienced a non-linear drop of almost 20% between 2000 and 2016. Surfaces decreased; mainly between 2000 and 2008 with a decrease of 38.5% then the sole stabilized around 1.5 million hectares between 2008 and 2016. This is explained by the EU reform in 2006, following the WTO injunctions, which limited export volumes and reduced quotas in parallel with the gradual opening up of the internal market to imports from Least Developed Countries (LDCs) and the granting of reduced duty quotas to Brazil. This reform also included a European restructuring plan financed by the levy of contributions on the EU sugar industry itself.

During the same period, average yields increased from 55 t/ha to 75 t/ha, an increase of 34.6%.

 Zoom on the last 3 years

The production has increased from 102 to 141 million tones since 2015 (+ 38%), and cultivated areas from 1.42 to 1.68 million hectares (+18%). The end of the quota system, which was decided in 2016 and officially entered into force in October 2017, explains this sudden growth. Yields are also up over the period.

b / Importance of the sector for the sugar, livestock and ethanol sectors

The markets for sugar beet are numerous. The most important of these is sugar production, for which the EU ranks first in the world (and the world’s third largest producer of sugar, mingled cane and sugar beet, behind Brazil and India).

The annual European production in 2016-17 has notably enabled the production of:

– 16.7 million tones of white sugar (of which 250 000 tones from sugar cane of the French overseas departments), equivalent to 93% of the 17.9 million tones consumed,

– 5 million tones of dehydrated pulp to feed livestock, 2% of the 267 million tones of composed feed consumed by livestock in the EU,

– 1.6 million tones of sugar syrups for ethanol production; this corresponds to 11 million tones of beet, i.e. 45% of the biomass used to produce EU ethanol in 2017

– and 0.8 million tones of sugar syrups for the chemical industry.

The end of the quotas, with the lifting of the export quotas, also allows the sector to contribute to the Union’s trade surplus, estimated at around 1 billion euros for the only product represented by sugar.

B External challenges

a/ A market under pressure

In 2006, the Common Market Organization was strongly reformed to adapt to the rules of the World Trade Organization (WTO). This resulted in a reduction of the quotas of 30%. At the same time, the Community market opened up to imports from the Least Developed Countries (LDCs) and the African Caribbean Pacific (ACP) zone. Surplus, the sugar sector became deficit: 20% of the sugar consumed in the Union was then imported.

Since the 1st of October 2017, following the 2013 CAP reform, the system of production quotas and guaranteed minimum prices for sugar beet has been abolished. The liberalization of the sugar market is reflected, in particular, by the possibility for sugar manufacturers to export freely to third countries without being constrained by a ceiling imposed by the WTO. If the global market is growing, the competition is extremely severe with world prices currently very low.

On import, the EU remains one of the most open markets, with free access for sugar from LDCs and ACP countries and duty-free or reduced tariff quotas for a large number of countries, including South and Central America (including Brazil), the Balkans and Eastern Europe.

b/ The EU-Mercosur Agreement

Brazil is the world’s largest sugar exporter with 27.6 million tones in 2016-17. It is also the world’s second largest producer of alcohol and ethanol with 289.5 million hectoliters in 2016 (24% of world production). Today, while sugar beet production quotas have been abolished in the EU, which is therefore in a surplus situation, any additional sugar and ethanol volume negotiated under the Mercosur agreements would disturb immediately and profoundly the European market in a depressed world market context. At the current stage of a negotiation, there is a mention of an opening of the EU market to 100,000 tons of sugar to be refined further, which would be added to the 900,000 tons[1] already negotiated with reduced custom duties. There are 140,000 farmers and 30,000 employees dependent in the sector that risk being impacted by such agreements.

To this would be added a quota of 600,000 tons of ethanol. While this production is financially and legally subsidized by Brazil, however this quota would compete with the European production of bioethanol, valuable to farmers to support their income in the current context of dropping sugar prices. There are also the environmental benefits of the European bioethanol industry, in terms of reducing CO2 emissions – on the order of 66% on average in Europe compared to gasoline – and nitrogen oxide (NO) – from the order of 30% compared to gasoline -, which are denigrated by such forecasts of imports.

The modes of production of sugarcane (authorization of GM cane, application of maturing glyphosate) also seem to contradict the objectives of the Union on its own territory.

Finally, the volatility of the Brazilian currency is an additional risk. The Real has lost 30% of its value since February 2017: in 20 months, the Brazilian exporter has gained 30% competitiveness. Predicting the economic consequences of an agreement in this context is completely hazardous.

c/ The Brexit

So far, the trade balance of sugar and ethanol between the EU27 and the United Kingdom is in deficit for the latter. For sugar, exports to the EU27 amount to € 324 million in 2017, while imports from the EU amount to € 968 million. The possibility claimed by the United Kingdom, even in the framework of a negotiated Brexit to conclude free trade agreements with third countries would change the situation, opening up the British market largely to South American imports for example, and substantially reducing European market shares in the UK. Not to mention triangular trade risks in the event of a total lack of control of the rules of origin or the risk of imports into the UK of non-EU sugar for the UK market and the export to the EU of sugar produced in the UK. The reflection is the same for ethanol.

A hard Brexit and the introduction of tariff barriers between the EU and the United Kingdom would still have a more negative impact due to an almost total loss, in this case, of British market.

C Internal challenges

a / Facing greater volatility

The end of quotas is accompanied by greater price volatility in the European market, which is in line with world prices. However, the world sugar market is one of the most volatile, ranging from a factor of 1 to 3.5. Unadapted to this volatility, the risk is that the beetroot adjusts its surface drastically in times of depressed prices, thus jeopardizing its processing plant. Because the beet processing industry is a heavy industry, which is not able to handle such fluctuations in volumes.

b / The bargaining power of planters in the sector

Beet is a non-storable product, whose transport costs make illusory an average supply for a factory beyond forty kilometers. The planter and the manufacturer are thus forced to agree on the terms of purchase of the beets. Under the quota period, the minimum beet price was associated with a value-sharing between the planter and the manufacturer negotiated at the national level.

The end of the quotas has returned any form of price negotiation within companies with the only possibility of eventually agreeing value sharing clauses. Farmers find themselves isolated and with very weak bargaining power.

c / Availability of plant protection products

Like any other crop, sugar beets require protection against pests and the cultivation of weeds. EU farmers are now facing a scarcity of approved substances, an increase in pressure due to climate change. They face the challenge of finding effective alternatives quickly.

With regard to insecticides, the current challenge for farmers is the neonicotinoid class, which has been booming since the discovery of imidacloprid in 1985. The latter makes it possible to protect beetroot from viral jaundice, a disease spread by aphids that can halve root yields. These insecticides have taken the place of organochlorines and organophosphoruses compounds such as DDT and have become the most widely used insecticides in the world. Employed mainly in seed coating, prophylactically, they make it possible to avoid diffusion linked to aerial spreading. But they are accused in particular of being the cause of a significant mortality among pollinating insects. In February 2018, in its conclusions, EFSA confirmed that there was no risk in the case of beet crops because they do not bloom during the production cycle. However, it indicated a potential risk to the next crop without supporting it.

On the 27th of April 2018, the majority of European Union states voted to ban three neonicotinoids (clothianidin, imidacloprid and thiamethoxam) from 2019 for all field crops in the EU with the only exception is greenhouse use. A derogation for sugar beet growers, which is harvested before flowering, may be proposed by the Member States.

In the case of France, the impact on sugar beet yields of the neonicotinoid ban has been estimated at 12% on average, but up to 50%. Beet growers find themselves in a technical impasse: in the absence of a non-chemical alternative and in the presence of chemical alternatives that pose a greater risk for the auxiliary fauna.

With regard to the herbicides used for the cultivation of beet, the current challenge of EU farmers is linked to the debates on glyphosate and, in France, to the announced ban on glyphosate after 2022. While the license to exploit the molecule (discovered in the 1950s) came to an end in December 2017, Member States voted in November for a five-year extension. The question of the toxicity of glyphosate, the most widely used herbicide in the world because of its high efficiency and low cost, remains a subject of debate. Today, a ban would push European farmers to use more expensive and sometimes more dangerous herbicides with more labor for weeding through tillage. The extra cost would be real. Its average utilization for Belgium is 1.81 kg per hectare of UAA; for the Netherlands 1.56 kg against 1.10 for France or 1.00 for Germany. For comparison, the extra cost has been estimated for French agriculture at 2 billion euros per year.

d/ Divergence of markets

Beet is the 7th sector of production that benefits the most from coupled aid. 11 of the 22 European Union countries producing beet have decided to set up coupled aid for sugar beet. The 2017 envelope is 177 million and covers nearly 516,000 hectares, or nearly 30% of European areas. For this sector, coupled aid is paid in the form of an annual aid per hectare and not in proportion to the quantities produced.

Overall, coupled aid applies in regions where yields are lower than in the main beet growing regions of Europe.

Poland accounts for almost 45% of the overall budget for aid coupled with beet and 40% of the areas concerned.

Coupled aid to the beet culture is criticized both outside and inside the EU. A study published by the University of Wageningen in February 2018, commissioned and financed by the German Inter-professional Association for Sugar, concludes that the beet-coupled aid has had an impact on the market by causing a 1.3% rise in the production of sugar and a 4.5% decrease in beet prices. The coupled aid would also strengthen the interest price of beet compared to other alternative crops (rapeseed, wheat) and therefore the propensity to produce beet outside the market.

e/ Decrease in domestic consumption

In the world, sugar consumption has been steadily increasing for many years. But in recent years, this trend is no longer widespread. Consumer growth only concerns the markets of emerging countries, particularly in Asia and Africa. Elsewhere, as in the United States or Europe, the trend is stagnation or even a slight decrease in consumption. This is due to a change in food consumption habit, with sugar now being seen as a factor in obesity.

Faced with these new expectations of consumers, the food industry has already begun to modify its formulations, offering more and more low-sugar products to reduce caloric intake.[2]

The slowdown in sugar consumption per inhabitant could become widespread around the world in the next fifteen years, according to a Rabobank report published in August 2017.

f/ Current reform of the CAP

In the current context of the beetroot sector crisis, the Commission’s budget and CAP reform proposals presented by the Commission on the 1st of June highlight the threats to the Beetroot sector. They would cumulatively result in an average decline in European farmers’ income of between 16 and 20%.

On one hand, the impact of the 12% fall in the CAP budget (constant euros) would lead to a fall in agricultural incomes of more than 8% on average in the Community, with particularly strong negative effects for the large sectors where direct payments account for a large share of income. For the beet sector, the Commission’s impact assessment estimates a 15% income drop in the case of option 3a (the best performer in purely economic terms).

Such a strategy would inevitably provoke the exit of many farmers with the abandonment of territories, as well as a race to expand farms. It would slow down investment capacity and generational renewal, despite the tools available for young farmers that could not offset the decline in revenue announced elsewhere.

As for the new implementation method proposed in the reform of the European Commission, such an evolution – which opens a way to a renationalization with a major transfer of responsibility for the first pillar to the Member States – would severely put in competition the regulatory frameworks of the Member States with of course advantages in terms of competitiveness for the less-favored in environmental matters. This development would also be a shift from the CAP towards a program mainly managed in a bilateral relationship between national agricultural administrations and the services of the European Commission to the detriment of the direct relationship between EU co-legislators and beneficiaries, the farmers.

II-Succeed in the heart of a fierce competition  

A Market expectations

a/ To remain a leader in the world

The European Union specializes in the production of white sugar from beet or cane and refined. About 8% of 2016-17 production has been exported; it will be 15% in 2017-18, with more than 3 Mt of exported sugar. But a number of countries, including trading partners around the Mediterranean, have invested and are currently investing in raw sugar refining sites, particularly from South America. No longer being forced to export by the quota system EU production will however face competition, in particular from Brazil and Thailand internationally. The EU sugar beet sector therefore has no choice but to gain competitiveness in order to compete in international markets.

b/ Do not lose weight on the EU market

At present, beet sugar produced in the EU is mainly consumed (around 85% of production), alongside significant volumes imported from emerging or developing countries and refined in the EU, particularly in the United Kingdom. Here again, in this internal market, the challenge of increasing competitiveness is crucial, especially since the agreements with Mercosur and Brexit may lead to increased pressure from outside competition.

B The levers of action

a/ The balance of power within the sector

Beet is a non-storable and barely transportable production. The planter must know how the price of his beet is calculated by the one to whom he delivers it. An obligation of result in the price negotiation process between a company and the planters who deliver it should be guaranteed.

b/ The digitalization of agriculture

In order to gain in competitiveness and sustainability with an increase in yields accompanied by a reduction in their operating costs, EU beet growers have a privileged solution: the digitization of agriculture.

The digitization of agriculture is a means to optimize the use of treatments carried out on crops. The aim is to use digital technologies and geolocation to better characterize the soils of the farm to take into account intragroup heterogeneity and thus bring “the right dose of inputs – water, fertilizers, phytosanitary products – in the right place and at the right time”. Among the inputs, phytosanitary treatments represent a fundamental issue both economically and environmentally. It is therefore an absolutely central position to achieve the dual performance objective of farms.

Studies, conducted in a network of farms on wheat and maize, are already showing tangible and promising results in terms of benefits per hectare (from 80 to 200 euros/ha) and reduction of inputs (from 30 to 70%) (Leader Farms, InVivo). In Greece, an experiment carried out on 9 pilot sites – 3 devoted to arboriculture and 2 to arable crops – estimated that the average savings achievable for the phytosanitary products could reach 63%.

c/ Phytosanitary treatments

As part of the culture of beet, to further increase the performance of the farm, another recourse can be associated with the digitization of agriculture: biocontrol.

Aphid infestations, the pest carrying the viral jaundice of beetroot, can be partially prevented with their impacts limited by the use of aphid predators. Auxiliaries are favored by landscaping that provides them with habitat – grassy paths, hedges, groves – close to the crops where the parasites, which they will feed on, are.

These two strategies are not exclusive and can be combined with profit to minimize the recourse of phytosanitary treatments. This certainly brings complexity for the farmer, but also the satisfaction of reducing his production costs as well as the impact of his production on the environment.

d/ Genetic improvement

Since 2000, average beet yields in the EU have increased by 35%. If we estimate that half of it is for the climate change[3], it is also the result of an important work of genetic improvement by the varietal selection, which in particular allowed to obtain resistant or tolerant varieties to bio-aggressors (rhizomania, nematodes, rhizoctonia …). The AKER program initiated in 2012 is an example of an approach aimed at improving the performance of beetroot in terms of productivity and resistance to biotic and abiotic stress.

In terms of the methods available to carry out the improvement work, the possibility of using new breeding techniques in the EU remains a subject of question to which the Commission and the co-legislators must have the courage to harness following the reading of the current regulation made by the Court of Justice of the EU in late July.

e/ The RED II Directive

The bioethanol sector in the EU is certainly a support lever for the beet sector. 7% of production in 2016-17 – 9.8 Mt out of a total of 141 Mt – was used to produce ethanol, and accounted for 45% of the biomass used for this purpose.

In the framework of the revision of the renewable energy directive known as “RED2”, the recent discussions in the Trilogue part led (in the context of pressure from the Commission to eliminate the 1st generation biofuels sector) to guarantee the production of biofuels of “EU” origin at the 2020 level + 1%, or maximum 7% of the share of renewable energies in the transport energy mix.

Even if a status quo has been achieved after bitter exchanges, it would be coherent that the contribution of the European ethanol sector (like that of the rapeseed biodiesel sector) is more recognized in the decarbonisation of the transport sector and that a margin of progress in the objectives of incorporation is envisaged. Debates on the value of EU-origin biofuels for reducing emissions and developing agriculture need to be objectified, and a broad consensus on the benefits of ethanol produced in the EU from an environmental view – compared to fossil fuel or agricultural biomass sources of “imported deforestation” – but also economic, by reducing the EU’s energy trade deficit.

f/ Community coherence

Community coherence in farmer support tools and related environmental objectives is essential. On one hand, it would make it possible to avoid a competition, which would turn to the advantage of the less attentive as for the respect of the environment. On the other hand, it would prevent the concentration of aid on targeted sectors in order to compete with those of other Member States.

III- Define a winning strategy adapted to the context

European agriculture faces common challenges that can only be solved effectively if Europe is coherent and solidary, especially with regard to environmental issues.

The excessive level of subsidiarity and flexibility, the fragmentation of the policy framework, as well as reduced levels of ambition with regard to the CAP budget are all elements that could transform the EU agricultural market into a battlefield. This one would see 27 different agricultural strategies to be measured between it or even to face each other.

With the adoption of the European Parliament’s report on the Future of the Common Agricultural Policy on the 16th of May 2018, MEPs opted for a balanced approach calling for a “reasonable level of flexibility within a strong common framework of European rules, basic standards, intervention tools, controls and financial allocations agreed at a European level by the co-legislators to guarantee a level of playing field for farmers”. They stressed the need to secure the direct relationship between the EU co-legislators and the beneficiaries – farmers – and not to transfer most of the management of the first pillar to the Member States.

The winning strategy for the EU Beetroot sector needs to keep this base solid at Community level, within the first pillar, while retaining the necessary flexibility for adjustments at the local level.

This winning Community strategy, driven by the CAP reform, should be the ambition to take all European agriculture towards double performance over the next 7 years.

The Commission considers that in the EU beet sector “it is not excluded that production will continue to concentrate in the most productive regions and that, if some producers succeed in securing new markets – inside and outside the EU – others will further reduce their production.”[4] Given the wide variation in sugar beet yields in the EU[5], it seems appropriate to adopt a differentiated strategic approach, which provides the appropriate support for producers in historically competitive and historically uncompetitive areas.

Recommendations are presented below based on the different challenges with aiming to embody the dual performance in the different types of zones and in the pillars of the CAP.

A In areas reputed historically as competitive

To determine these areas, the choice fell on those where average beet yields over the 2011-2015 period were greater than 70 t/ha.

The pedoclimatic conditions, the logistical equipment as well as the varietal improvement works and sugar yields make it possible to envisage the sustainability of the sugar beet sectors of these areas in the new sugar market, inaugurated by the end of quotas and guaranteed minimum prices. Furthermore, the fact that these areas achieve these high performances – in terms of sugar beet and sugar yields – while the majority of them is being located in Member States, who do not use coupled payments constitute an additional assurance of their resilience capacity – and therefore of their durability – in the new market framework.

a/ 1st pillar recommendation

Recommendation n°1

The promotion of digitized agriculture in the first pillar should be a priority of EU agricultural policy by including a lump-sum incentive for the transition to dual performance in the Eco-Scheme. This way it is favored to achieve double performance and therefore meet the following three challenges: the export competition in the globalized market by the obtained competitiveness gains, environmental sustainability and the regulatory pressure on phytosanitary products by optimizing the inputs.

b/ 2nd pillar recommendation

Recommendation n°2

1- The allocation of Income Stabilization Tools within the second pillar must be ready to face the challenge of export competition in the globalized market and the exposure to the current very volatiles prices of this market.

2- A European Crisis Management Fund in agriculture, financed by an adequately equipped multi-year crisis reserve, must be carried out and take over the IST tools when risks become deep crises (see related Farm Europe note).

 Recommendation n°3

Prioritize in the mobilization of AECM, investment and training tools – within the second pillar – as farmers making the transition to double performance are a prerequisite for a broad expansion of digital agriculture as such a technological revolution can occur only with human accompaniment at the height of the changes.

Recommendation n°4

The establishment of investments in research and development for the improvement of beet varieties in the second pillar is a complementary measure to face the external challenges and the decreasing availability of plant protection products.

B In areas reputed historically as uncompetitive

To determine these areas, the choice was made on those where average beet yields over the 2011-2015 period were less than or equal to 60 t/ha.

Given the magnitude and speed of change imposed by the new sugar market framework, inaugurated by the end of quotas and guaranteed minimum prices with world prices falling by 50% since 2017, the probability of adaptation needs provoked by the crisis is severe to the point of jeopardizing many farms that it can not be ignored. This could lead to the bankruptcy of industrialists and force many producers to abandon this production and to convert to other currently more profitable ones, such as cereals or rapeseed.

a / 1st pillar recommendation

Recommendation n°5

Take steps to integrated agricultural sector strategies that can mobilize 15% of the 1st pillar CAP and allow to break out of the acquis reasoning regarding the coupled payments of beetroots. The economic efficiency would suggest mobilizing these funds for more relevant actions within the sector or even for the revitalization of reconversion channels.

b/ 2nd pillar recommendation

Recommendation n°6

Support for the reconversion of beet growers in historically uncompetitive areas should be included among the tools of the second pillar so that the concerned Member States can accompany the reconversion which current market developments impose.

C In both types of zones

a / Recommendation related to the single CMO

Recommendation n ° 7

The particularities of beet, a non-storable and barely product transported, must be taken into account within the framework of the Common Market Organization. The negotiation between a sugar company and the planters who deliver it must have an obligation of result.

b / 1st pillar recommendation

Recommendation n°8

The guarantee of a minimum of 60% of the first pillar funds allocated in each Member State to the financing of basic decoupled aids is a necessary measure given the importance of these aid in farm income in the face of external challenges and the declining sugar beet income. Otherwise, the rotation in beets risks falling very sharply in favor of a reallocation to other crops.

c / Non-pillar recommendation

Recommendation n°9

Maintaining the CAP budget allocation at the current level of the EU-27 is an essential measure, with the digitalization of agriculture and an adequate management of risks and crises, to participate in the construction of a strong, competitive European beet sector that effectively addresses the challenges of sustainability.

Summary table

The table below summarizes the challenges facing the sector, and the recommendations of Farm Europe consecutively for areas deemed historically competitive, then for areas deemed historically uncompetitive and finally the recommendations concerning the two types of areas.

Challenges Recommendations in historically competitive zones
– External challenges (globalized market, Mercosur agreement, Brexit)

-Availability of phytopharmaceuticals

-Environmental sustainability

1- Promote digitized agriculture in the first pillar by including a lump-sum incentive for the transition to dual performance through the Eco-Scheme
– External challenges (globalized market, Mercosur agreement, Brexit)

– Higher volatility


2.1- Financially endow Income Stabilization Tools in Pillar 2

2.2- Establish a European crisis management fund in agriculture

– External challenges (globalized market, Mercosur agreement, Brexit)

-Availability of phytopharmaceuticals

-Environmental sustainability

3- Prioritize the mobilization of MAEC, investment and training tools in Pillar 2 for farmers making the transition to double performance
– External challenges (globalized market, Mercosur agreement, Brexit)

-Availability of phytopharmaceuticals

4- Put in place investments in research and development for the improvement of beet varieties within Pillar 2
Challenges Recommendations in historically uncompetitive zone
– Market differences 5- Take steps to integrated agricultural sector strategies that can mobilize 15% of the 1st pillar CAP and allow to break out of the acquis reasoning regarding the coupled payments of beetroots.
– External challenges (globalized market, Mercosur agreement, Brexit)


6-Financially support the conversion of beet producers to other crops
Challenges Recommendations for both type of zones
 – Bargaining power of planters in the sector 7-  Adopt an obligation of result in the sugar factories-planter business negotiation
– External challenges (globalized market, Mercosur agreement, Brexit)


8- Guarantee a minimum envelope of 60% of the 1st pillar for basic decoupled aids
– External challenges (globalized market, Mercosur agreement, Brexit)


9- Maintain the CAP budget allocation at the current EU-27 level (constant prices)

D What kind of CAP for the EU Beet sector?

Today, the European Union needs a truly common CAP to maintain a strong Beetroot sector in areas where current competitiveness is realistically sustainable to be able to cope with current economic and environmental challenges.

It will first of all consolidate a balanced contractualization within the sugar beet sector. It will then be necessary to provide the sector with risk management tools adapted to the new economic and production context. Then, the digital revolution (represented by a progressive generalization of digitized agriculture) and the current internal and external challenges require a strong common base that promotes investment in the necessary equipment.

It is also through a strong common base that farmers’ incomes can be supported throughout the EU, guaranteeing cohesion between sectors, preserving basic aids in the first pillar that will provide the economic resilience needed to enable the digital revolution.

The CAP must still ensure a reasonable level of subsidiarity allowing the Member States to adapt the training of farmers to the use of digital farming tools or the work of improvement of variety in their particular contexts and, above all of, to adopt the necessary financial support measures to support the conversion of beet growers from less competitive areas to one or other crops.

Protecting farmers’ incomes and maintaining a truly common CAP comes back to the current context of the reform which proposes a renationalization of the CAP to preserve the balance of these two pillars, where one representing 70% of the aid is developed at Community level and the other representing 30% of the aid allows the consideration of local specificities in the Member States.


[1]  These 900 000 tones represent all the quotas negotiated by the EU with reduced customs duties, and not only those negotiated with Mercosur countries.

[2] One gram of sugar always contains 4 kilocalories.

[3] Global warming is increasing photosynthesis by increasing average spring temperatures and increasing CO2 levels in the atmosphere. This results in earlier planting, an increase in the biomass produced and sugar stored by the beets.

[4] European Commission – Fact Sheet, The end of sugar production quotas in the European Union, 29 September 2017

[5] Average beet yields over the 2011-2015 period range from 37 to 90 t / ha according to the Member States.

A NEED OF BALANCED, COMMON APPROACH TACKLING UTPs

Discussions about the need to rebalance the food chain relationship are not new at the European level. All the institutions have participated in several attempts urged by different stakeholders, but in the end no concrete action was taken until this year.

In 2013, seven European Associations motivated by the former Commissioner Verheugen launched the Supply Chain Initiative (SCI) as a voluntary, private-led action in order to increase fairness in commercial relations along the food supply chain.

Since then, some advances have been achieved in promoting cultural changes and improving business ethics, but a set of important shortcomings have also been highlighted in the analysis of its effective application. Weakness in governance, limitations in transparency, no enforcement measures or penalties, a lack of effective deterrents against UTP and not allowing individuals to make anonymous complaints by potential victims, no own–initiative investigations by an independent body and under-representation of SMEs and farmers are the most important ones. [1]

The primary concerns on the issue were born at the MS level, and 20 of them have been – in one way or another – actively looking for remedies. If we summarize what is going on in the different Member States, several distinctions can be made:

  • There are some MS with specific measures for the food chain (i.e. Spain, UK, Italy…), and others refer directly to horizontal legislation (Germany, France,.. ).
  • Four main types of models coexist: regulated in detail (UK, Spain,Italy..), self-regulated (Belgium), mixed model (Spain, UK) , horizontal regulation and countries with no specific UTP´s regulation (Denmark, Sweden, Luxembourg,..).
  • When there is a regulatory framework and control authorities, they can be either the Ministry of Finance (France), Competition Authorities (Germany), Food Safety and Economy (Portugal) or Agriculture (Spain).[2]

Nevertheless, it is crystal clear that despite the efforts made, self-regulation or voluntary approaches are not enough to solve the present imbalances in the food chain, and disparities between national systems in place do not help to keep a level-playing field and ensure the proper functioning of the Internal market, while at the same time the fragmented nature of the markets expose supply chain operators to different conditions, regulatory uncertainty and inefficiencies.

Taking into account these facts, Commissioner Hogan instigated in 2016 the Agricultural Markets Task Force (AMTF), which examined the position of the farmer in the supply chain, and proposed a number of recommendations on different issues, amongst them trading practices in agricultural markets and contractualisation.

The Report was deeply debated in the Agri Council, whose Conclusions of December 2016 on “Strengthening Farmers´ Position in the Food Supply Chain and Tackling Unfair Trading Practices” made clear that imbalances in the bargaining positions often lead to unfair trading practices (UTPs), as well as to the need for a level-playing field for all actors in the chain.

The AMTF was not the only initiative around the issue of how to improve the functioning of the European food chain. The European Parliament has also been very active, and its last positioning was adopted in June 2016 with the adoption of a new Resolution on “Unfair Trading Practices in the Food Supply Chain”, in which it openly pledges for a framework legislation at EU level in order to tackle UTPs. This pledge was renewed at many occasions in various EP’s resolutions (2016 and 20117 Annual EU Competition policy reports), while an amendment setting a mandatory deadline for proposing a legislation to the Commission was defended by the Parliament in the framework of the Omnibus regulation negociation.

Along the same line, the European Economic and Social Committee supported the European Parliament´s Resolution in its Opinion adopted at the plenary in October 2016 (“A Fairer Agro-Food Supply Chain”) and highlighted the need for a framework legislation at the European level as well as to take swift action to prevent UTP´s.

In this context, the Commission came in 2018 with a legislative proposal to to address UTPs and rebalance the relationship between the different links of the food chain.

NEED OF A SET OF CONCRETE MEASURES.

If Europe wants a strong and balanced food chain, able to share all the value added generated across it under fair conditions, able to reinforce the position of producers as the most vulnerable link, and generate wealth up to the consumer, a minimum set of issues has to be tackled.

These core issues are the following:

  1. A set of guiding principles for the commercial relationships in the food chain. There are three kind of relations in the food chain: 1) producer – industry, 2) producer – retail , 3) industry – retail. For all cases, the relation shall be governed by the principles of balance and fair reciprocity between parties, freedom to enter into agreements, goodwill, mutual interest, equitable sharing of risks and responsibilities, cooperation, transparency and respect of free market competition.
  2. Identification of the unfair practices to be relegated from commercial practice.There is a vast literature about UTPs , and in general terms they can be described as all kind of practices imposed to the supplier that do not respect fairness in the contractual relation, passing on inefficiencies or risks without any compensation.          Under this broad description we should include:
    • Unilateral or retroactive changes to the agreed terms (concerning volumes, quality standards, prices),
    • Unforeseen commercial payments,
    • Charges of fictitious services,
    • Transfer of charges in promotions to the supplier with no negotiation and participation of the buyer,
    • Imposing unconditional return of unsold merchandise,
    • Non-compliance with payment delays as established in Directive 2011/7/EU,
    • Sudden and unjustified cancellation of a contract,
    • Non-transparent, discriminatory electronic auctions.
    • No request for upfront payments to secure or retain contracts.
  3. Written contracts. Modern commercial relations imply taking into account a set of complex issues – quality, quantity, price, discounts, logistics and transportation, terms of delivery,…- that cannot be left to uncertainty. Moreover, clear conditions mean secure and stable relationships, as well as less legal controversies. We propose as a general rule the need for written contracts along the chain, with a minimum set of criteria, conditions that should be compulsory when requested by the supplier. In the case of agri producers, Producers’ Organizations could play a relevant role in this issue and negotiate on their behalf while Interbranch Organizations could set standard written contracts.
  4. Effective enforcement of rules. Experience shows us the shortcomings and limits of voluntary, non-binding models of enforcement. The most effective way is the supervision and control by an independent authority, granted with public powers, in order to ensure the effective application of the proposed set of rules.
  5. Fear factor avoidance. Enforcement should be possible either through independent authorities’ own initiative, or by operators and their organizations. It is crucial in this sense to establish an effective complaints lodge system that secures anonymity .
  6. Sanctions and name-and-shame. Non-compliance with the proposed set of rules should be subject to sanctions, with dissuasive character, and include “Name and shame” provisions.

All these proposals should be part of a common European framework.

This should be complemented at the national level by the effective participation of stakeholders through codes of conduct / voluntary agreements, as a way to better implement a comprehensive system.

COMMISSION’S PROPOSAL FOR A DIRECTIVE ON UNFAIR TRADING PRACTICES IN BUSINESS-TO-BUSINESS RELATIONSHIPS IN THE FOOD SUPPLY CHAIN.

(from committee on agriculture and rural development draft report on the proposal for a directive of the european parliament and of the council on unfair trading practices in business-to-business relationships in the food supply chain
(com(2018)0173 – c8-0139/2018 – 2018/0082(cod)) rapporteur: paolo de castro 2018/0082(cod))

« The absence, so far, of a common UTP framework stands in contrast to other areas which the CAP governs, and which have direct relevance for operators, such as competition rules, state aid rules and marketing standards. In these areas, the common market organisation (Regulation (EU) No 1308/2013) lays down common rules relevant to the market conditions operators face in the EU so as to contribute to economic and social cohesion, as well as to a level playing field in the single market.

The present proposal for a Directive aims at reducing the occurrence of UTPs in the food supply chain by introducing a minimum common standard of protection across the EU that consists of a short list of specific prohibited UTPs. The protection covers suppliers in the food supply chain insofar as they sell food products to buyers who are not small and medium-sized. This scope aims at contributing to a fair standard of living for the agricultural community, an objective of the CAP under Article 39 TFEU.

Article 43 TFEU, being the principal CAP legal basis, serves as the Commission proposal’s unique legal basis. The measures foreseen in the proposal concern UTPs occurring in the agricultural and food supply chain in relation to the trade of products originating with agricultural producers. It should be noted that, according to Article 38(2) and (3) TFEU, the CAP primarily covers the agricultural products listed in Annex 1 to the TFEU. However, the European Court of Justice has explicitly confirmed that food products not listed in Annex I TFEU (Annex I products are deemed “agricultural products” under the Treaty) can also be covered by acts adopted under Article 43 TFEU if this contributes to the achievement of one or more of the CAP objectives and agricultural products are principally covered.1

Moreover, an approach which protects agricultural producers and their associations (cooperatives and other producer organisations) must also take into account indirect negative effects they may suffer through UTPs occurring downstream in the food supply chain, i.e. by operators who are not farmers but whose weak bargaining position in the downstream chain makes them vulnerable to UTPs. Protection against UTPs applying to downstream suppliers prevents unintended consequences for farmers due to trade being diverted to their investor- owned competitors – for example at the processing stage – which would not enjoy protection (e.g. less legal risk for buyers to be confronted with UTP accusations).

Furthermore, the Commission points out that the proposed measures are complementary to measures existing in Member States and the code of conduct of the SCI.

EP RAPPORTEUR’S POSITION AND AMENDMENTS PROPOSED

The rapporteur supports the Commission proposal as a long expected legislative instrument to defend agricultural producers’ bargaining position in the agricultural and food supply chain; an instrument which can finally complement the measures introduced via Regulation (EU) 2017/2393, the so-called Omnibus Regulation, aiming at reinforcing the negotiating prerogatives of farmers in the EU. It should be reminded that the belief in the necessity of such an instrument was backed up by the conclusions of the Agricultural Markets Task Force issued in November 2016, and it was shared by Parliament in its resolution adopted on 7 June 2016, as well as by the EU Agriculture Ministers who adopted unanimous conclusions in this respect at their Informal Council meeting of 12-13 December 2016 in Bratislava.

The rapporteur underlines that completing the legislative procedure on the UTPs proposal before the end of the present parliamentary term, thus making this new legislation a concrete “deliverable” for European farmers, is both an important and realistic objective for this Parliament. On the side of the other co-legislator, the Austrian Presidency has clearly indicated its intention to give top priority to the UTPs proposal, as indicated in a letter of 4 June 2018 by the Austrian Minister for Sustainability and Tourism, Elisabeth Köstinger, to the Chair of the AGRI Committee. The letter indicated the UTPs proposal as one of the main priorities for the Austrian Presidency and reminded that both Parliament and the Council had asked repeatedly for legislation to protect farmers who are the weakest link in the supply chain, before concluding that “the time has come to harmonise twenty different national regulations and to set minimum standards for all Member States” so as to “solve the problems of farmers treated unfairly by other, more powerful partners in the supply chain”.

Amendments proposed by the rapporteur

While widely supporting the proposal, the rapporteur proposes nevertheless a number of amendments to improve its efficiency. These are the following:

  • ?Extension of the scope to suppliers in the food supply chain which are not SMEs, in order to include farmers’ organizations and avoid possible trade diversions away from SMEs;
  • ?Extension of the scope to all agricultural products, i.e. not only to food products, in order to include the horticultural sector, feed industry, and other agricultural sectors not falling under food production;
  • ?Extension of the “buyer’s” definition to include those operators that, though established outside the EU, buy and sell products in the EU market. The aim is to avoid that a buyer can escape the provisions of the Directive by simply moving its place of establishment outside the EU;
  • ?Again as regards the definition of the “buyer”, the provision of related services should be included into the scope, together with processing, distribution or retail of agricultural and food products;
  • ?Inclusion of a definition of “unfair trading practice” (in the sense of an overarching principle), along the lines of the definition given by the Council Conclusions of 12 December 2016, which is reflected in recital 1 of the proposed Directive;
  • ?Inclusion of a definition of “economic dependence” as a power relationship between a supplier and a buyer;
  • ?Introduction of a payment term for non-perishable products at 60 days from the receipt of the invoice, as also provided for in Directive 2011/7/EU on late payment;
  • ?Exemption from the provisions on payment terms for all contributions from farmers to their producer organisations and cooperatives, as well as for agreements of inter- branch organisations where those agreements concern quality products;
  • ?Definition of the notion of “short notice” (when a buyer cancels orders of perishable food products) with a fixed time-limit (60 days);
  • ?Improvement of the introductory sentence in paragraph 2 of Article 3 (so-called “grey UTPs”) through including the concept of “economic dependence” to take into consideration the imbalance in market power between actors, that can be used and abused by some buyers to impose unilaterally their terms to weaker suppliers;
  • ?Introduction of the possibility for Member States to prohibit any other unfair trading practice (i.e. going beyond the prohibitions of Article 3), based on the definition of “unfair trading practice” added into Article 2;
  • ?Inclusion of mandatory written contracts upon request of a supplier, as laid down – through the “Omnibus Regulation”- in Article 168 of the Single CMO, and of the possibility for Member States to encourage an increased contractualization between different actors in the supply chain;
  • ?Inclusion of the possibility for complainants to lodge a complaint to foreign authorities through their own national authorities;
  • ?Extension to representative associations of the right to lodge a complaint on behalf of one or more of their members;
  • ?Inclusion of the obligation for the enforcement authority to start an investigation within 60 days from the date on which the complaint has been lodged, and to conclude it within 6 months. In duly justified cases, the 6 months can be extended by another 6 months (thus, the whole investigation has to be concluded within 14 months from the complaint); 
         ? Inclusion of the obligation for the enforcement authority, in case an infringement has been established, to require the buyer to terminate the prohibited trading practice;
  • ?Introduction of the possibility for Member States to promote the use of mediation or an alternative dispute resolution mechanism;

? Introduction of the obligation for Member States to include in their annual report to the Commission of an evaluation on the effectiveness of the implemented measures in order to ban UTPs ».

[1]EP Resolution of 7 June 2016 on unfair trading practices in the food supply chain.

[2]more detailed information in the study commissioned by the Spanish Agency for Food Information and Control (AICA) ,” Informe sobre la aplicacion de la regulacion de practicas comerciales en los paises UE” 2016. www.aica.gob.es

Financial impact of Brexit on the CAP budget of the EU Member States

The financial impact of Brexit can be explained in other words, and from the point of view of the contributions that the United Kingdom made to the CAP budget, by the challenge of absorbing:

– the loss of the UK’s net annual contributions, which is, for the EU budget,  almost €7 billion(€6.6 billion/year on average 2010-2016), and specifically 2,7 billion euros for the CAP;

– The decline in the European Union’s own resources linked to the shrinking of the EU market (less customs duties on lower imports), i.e. €2.8 billion annual average over the period 2010-2016; this fall is irrespective of what could be expected in the forthcoming post-Brexit trade agreement between the EU27 and the UK, and the UK’s possible contribution to EU market access. This contribution could compensate as a whole or partly for the smaller amount of EU own resources.

At this stage of discussions between the EU and the UK on post-Brexit relations, the actual net cost of UK departure from the EU budget is therefore at least €6.6 billion and €9,4 bn at most.

The EU’s own resources which finance 12.4% of the EU budget over the period considered, might face a decrease of €2.8 billion, which might in turn generate a funding shortfall for the CAP of €1.15 billion to be added to the € 2.7 billion mentioned above.

Through the voice of its Commissioner for Budget and Human Resources, the European Commission proposed, under the Financial Perspective 2021-2028:

– that 50% of the cost of Brexit is borne by an effort of major European policies (cohesion and CAP essentially)

– that 20% of the financing needs of the new European priorities (i.e. around €2.5 billion/year) are also financed by margins generated by the so-called major European traditional policies, i.e. some €1.2 billion that would then be earmarked on the annual CAP budget for these new challenges.

Without going into the debate about the acceptability (or not) of a reduction of the CAP budget in view of the economic and territorial challenges that the EU has to address with the leverage of this policy, Farm Europe with this analysis, endeavours to estimate, in an EU27, the cost of the different options mentioned hereafter for each MS, by integrating its contribution to the CAP budget and the financial returns received under the CAP.

In a nutshell, 3 scenarios are analysed in each of the three cases presented here below:

-Brexit net cost for the EU budget of €6.6 bn and for the CAP of €2.7 bn;

– the net cost of Brexit for the EU budget of €6.6 bn (and for the CAP of €2.7 bn) and the financing of the new EU priorities through an additional reduction of €1.2bn in the CAP budget, i.e. a total CAP reduction of €3.9 bn

– “maximum” Brexit cost (loss of own resources linked to the UK market and no compensation in a Brexit post-trade agreement), a loss of €9.4 bn for the EU budget, an uncovered requirement of €3.85 bn under the CAP (€2.7 bn as the end of the contribution of the UK to the CAP + €1.15 bn CAP share of the reduction of own resources) and a financing by the CAP of the new EU priorities for €1.2 bn/year, which amounts to a total of €5.05 bn linked to the CAP.

With regard to the CAP budget of the Member States, for each of the above mentioned three cases, in order to cope with the current challenges, the 3 scenarios presented in this document are:

  • Scenario 1:increasing national contributions to maintain the same level of CAP aid received by Member States;
  • Scenario 2:decreasing CAP expenditure to compensate for 50% of the net deficit due to withdrawal of the UK from the CAP budget (i.e. Case 1: €1.35 bn for the UK net contribution to the CAP budget; Case 2: €1.35 bn plus €1.2 bn to finance the new EU priorities and; Case 3: €1.35 bn + €1.2 bn + €0.575 bn for the decrease in own resources;
  • Scenario 3:to decrease CAP expenditure by the total cost linked to the withdrawal of the UK from the CAP budget (i.e. Case 1: €2.7 bn, Case 2: €2.7 bn + €1.15 bn, Case 3: € 2.7 bn + €1.15 bn + €1.2 bn);

Please note that the calculated impacts are expressed in constant euros.

The relative cost for the MS will then have to be assessed in view of the expected growth rate of the EU economy and the inflation rate that can be projected, while the latest budgetary agreements have renewed the principle of aid under the first pillar of the CAP reduced by the rate of inflation as expressed in constant euros.

These scenarios are examined in terms of their consequences for each EU Member State (changes in national contributions to the EU budget and changes in CAP funds received by the MS).

The consequences can be summarized in, for each one of the scenarios:

– on the one hand, the envisaged increase or decrease in the national contribution to the CAP budget, which will be financed in proportion to the contribution of the MS to the EU budget;

– on the other hand, considering the end of the “special scheme”to finance part of the EU budget not paid by the UK and borne by the other 27 MS at present (the so-called “UK rebate”) with the “rebate on rebate”granted to certain MS – all contributions to the CAP budget are now provided by the MS according to the common definition of EU Budget funding allocation;

– lastly, the impact on CAP Budget expenditure (CAP aids received by farmers in each MS).

A last part of this note is aimed at shedding light on the impact of each of the simulations on the agricultural incomes of the various Member States.


I – United Kingdom’s position in the EU budget

1 – MS contributions to the EU budget: the net cost of Brexit (in €bn)


2 – Impact of the UK’s departure on the EU’s own resources

The table below shows the own resources collected in the EU28 and those collected in the UK over the period 2010-16. That is an average of 2.8 billion euros a year that has been collected via the UK.


II – Impact on the EU27 Member States’ contributions to the EU budget following the UK departure, in a pattern of lowering the EU budget equal to 100% of the tied loss: the impact of abandoning the specific “rebate on rebate”

In the context of a reduced budget equal to the full net cost of the UK departure, the cost for national budgets results from applying a new allocation key to fund the historic “rebate”, which will be no longer the “rebate on rebate” key but rather the usual allocation method of the MS to the EU budget.

Indeed, even without compensation by the 27 Member States of the EU for the net cost of Brexit, the distribution of allocations from the EU27 to a reduced EU budget would be modified. This change translates, logically, into a decrease in contributions for the majority of Member States, and an increase for the four MS that benefited from the “rebate on rebate”scheme.

The table below shows the impact, by Member State, in terms of its budgetary contribution to the CAP budget. The origin of the British rebate and therefore the existence of a specific scheme “rebate on rebate”being linked to the CAP, the full cost or benefit for the MS as a result of the end of the specific scheme is included in this study and fully born by the national contributions to the CAP budget.


III – Possible Brexit impacts on the CAP: CASE STUDIES

1 –Brexit total net cost of €6.6 bn, net cost for the CAP of €2.7 bn

A) Scenario 1: The CAP budget increases by 2.7 billion euros

Assuming a budget increase of €2.7 billion to fully offset the decline in the UK’s net contribution to the CAP budget, the cost for national budgets is the addition of the new allocation scheme to finance the “rebate” (no longer the “rebate on rebate” scheme but the normal allocation scheme of the MS to the budget cf. II) and the financing of the additional 2.7 billion by the GDP allocation key. CAP envelopes received by the 27 MS do not change from those currently allocated.

In this scenario, the CAP budget represents 38.6% of the EU budget.[1]

B) Scenario 2: The CAP budget decreases by 1.35 billion euros(50% of the UK’s net contribution to the CAP budget)

In the context of a budget decrease of €1.35 billion that is half of the UK’s net contribution to the CAP budget (according to the position put forward by the Commission), the cost for national budgets is the addition of the new allocation scheme to finance the “rebate” (no longer “the rebate on rebate” but by the usual allocation key of the MS to the budget), and national contributions to finance the other 50% of the UK net contribution to the CAP, which remains at their whole expense (€1.35 bn) and the decline in CAP aids received in the various MS due to the shrinking of the CAP budget of €1.35 billion.

In this scenario, the CAP budget represents 35.6% of the EU budget.

C) Scenario 3: The CAP budget decreases by 2.7 billion euros

In the context of a budget cut of €2.7 billion, thus the entire UK net contribution to the CAP budget, the cost for national budgets results from the addition of the new allocation criteria to finance the “rebate” (no longer “the rebate on rebate” but by the usual allocation key of the MS to the budget) and of the decrease of the CAP aids received in the different MS due to the reduction of the CAP budget of 2.7 billion.

In this scenario, the CAP budget represents 34.6% of the EU budget.


2 – Brexit total net cost on national contributions of €6.6 bn, Brexit net cost on national contributions to the CAP of €2.7 bn & CAP funding of new EU priorities of €1,2 bn (20% for new budget priorities) – i.e. a total of €3.9 bn in relation to the CAP

A) Scenario 4 : CAP budget increases by €3.9 billion(maintaining CAP aid)

Assuming a budget increase of €3.9 billion to the CAP budget, the cost for national budgets is the addition of the new allocation criteria to finance the “rebate” (no longer “the rebate on rebate” but by the usual allocation key of the MS to the budget cf. II), the financing of the additional 2.7 billion, by the GDP allocation key, and €1.2 bn of the CAP budget that the Commission wishes to use for new priorities. CAP envelopes received by the 27 MS do not change from those currently allocated.

In this scenario, the CAP budget represents 39.5% of the EU budget.

B) Scenario 5: The CAP budget decreases by 2.55 billion euros(€1.35 bn + €1.2 bn)

In the context of a budget decrease of €2.55 billion, half of the UK’s net contribution to the CAP budget (€1.35 bn) and funding from the CAP new EU priorities (€1.2 bn), the cost for national budgets is the addition of the new allocation key to finance the “rebate” (no longer “the rebate on rebate” but by the usual allocation key of the MS to the budget) and national contributions to finance 50% of the UK net contribution to the CAP, which remains at their expense (€1.35 bn) plus the drop in CAP aids received in the various MS due to the shrinking of the CAP budget by €2.55 billion.

In this scenario, the CAP budget represents 34.7% of the EU budget.

C) Scenario 6: The CAP budget decreases by € 3.9 billion

In the context of a budget decrease of €3.9 billion, thus 100% of the UK’s net contribution to the CAP budget (€2.7 bn) and funding from the CAP new EU priorities (€1.2 bn), the cost for national budgets is the addition of the new allocation key to finance the “rebate” (no longer “the rebate on rebate” but by the usual allocation key of the MS to the budget) and the decrease in CAP aid received in the different MS due to the shrinking of the CAP budget of €3.9 billion.

In this scenario, the CAP budget represents 33.7% of the EU budget.


3 – Brexit total net cost of €6.6 bn on national contributions, plus a decrease in EU own resources of €2.8 bn (contraction in the EU market without the UK), i.e. €9.4 bn in total. Maximum net Brexit cost for the CAP of €3.85 bn ( 2.7 bn linked to the CAP budget + 40% of the decline in own resources) + CAP funding of new EU priorities of € 1.2 bn, thus €5,05 bn at stake for the CAP.

A) Scenario 7: The CAP budget increases by €05 billion(€3.85 bn + €1.2 bn)

In the context of a budget increase of €5.05 billion to compensate in full for the decrease in net CAP contribution (€2.7 bn) and the share of own resources (€1.15 bn) collected via the UK for the budget of the CAP, as well as the €1.2 bn of the CAP budget that the Commission wishes to use for new priorities, the cost for national budgets is the addition of the new allocation key to finance the “rebate” (no longer “the rebate on rebate” but the normal contribution key of the MS to the budget cf. II) and the financing of the additional 5.05 billion euros, by the GDP allocation key. CAP envelopes received by the 27 MS do not change from those currently collected.

In this scenario, the CAP budget represents 40.4% of the EU budget.

B) Scenario 8: The CAP budget decreases by €125 billion(€1.35 bn + €0.575 bn + €1.2 bn)

The table below shows the consequences of Brexit for the Member States at the level of the CAP budget. In the context of a budget decrease of €3.125 billion, which results from half of the UK’s net contribution to the CAP budget (€1.35 bn), 50% of the decrease in the resources from the UK to the CAP budget (€0.575 bn) and CAP funding of the new EU priorities (€1.2 bn), the cost for national budgets is the addition of the new allocation key to finance the “rebate” (no longer by the “rebate on rebate” but by the normal contribution key of the MS to the budget), additional national contributions to finance 50% of the net contribution of the UK to the CAP budget, which remains at their expense (€1.35 bn) and 50% of the UK’s own resources collected missing, plus the drop in CAP aid received in various MS due to the shrinking of the CAP budget of €3.125 billion.

In this scenario, the CAP budget represents 34.2% of the EU budget.

C) Scenario 9: The CAP budget decreases by 5.05 billion euros

The table below shows the consequences of Brexit for the Member States at the level of the CAP budget. In the context of a budget decrease of €5.05 billion, caused by the net contribution of the UK to the CAP budget (€2.7 bn), the decrease in resources from the UK to the CAP budget (€1.15 bn) and CAP funding of the new EU priorities (€1.2 bn), the cost for national budgets is the addition of the new allocation key to finance the “rebate” (no longer by the “rebate on rebate” but by the normal allocation key of the MS to the budget) and the decrease of the CAP aids received in the different MS due to the tightening of the CAP budget of €5.05 billion.

In this scenario, the CAP budget represents 32.8% of the EU budget.

IV. Impacts on farms incomes of Brexit of the 3 different cases studied

1 –Brexit total net cost of €6.6 bn, net cost for the CAP of € 2.7 bn (Scenario 1 to 3)

This table presents the impact of the scenarios on the average farm net income per Member State, in the Case n°1. This is a low approximation of impact as only the share of direct payments has been taken into account – farm income at EU level would decrease between at least around 2 and 4%– with a constant policy framework.

2 –Brexit total net cost of €6.6 bn, Brexit net cost for the CAP of €2.7 bn and CAP funding of new EU priorities of €1.2 bn (Scenario 4 to 6)

This table presents the impact of the scenarios on the average farm net income per Member State in the Case n°2 – farm income at EU level would decrease between 3,5 to 5,2%.

3 – Brexit total net cost of €6.6 bn, plus a decrease in own resources of €2.8 bn (tightening of the EU budget without the UK), which is €9.4 bn in total. Maximum net Brexit cost for the CAP of €3.85 bn. CAP funding of new EU priorities of € 1.2 bn (Scenario 7 to 9)

This table presents the impact of the scenarios on the average farm net income per Member State in the Case n°3 – farm income at EU level would decrease by 4 to nearly 7%.


[1]This rate is the ratio between the average 2010-16 CAP budget, UK excluded, and the new average EU budget, i.e. EU average budget 2010-16 excluding UK + 12 billion for new aids.

NBTs: ECJ Advocate General’s preliminary conclusions

New plant-breeding techniques (NBTs): ECJ Advocate General’s preliminary conclusions

A first sound and promising basis on which to proceed


“Ever since humans have grown plants and raised animals for food, they have selected plants and animals with beneficial traits for further breeding. Such traits reflected naturally occurring genetic variations and resulted, for example, in an increased yield or resistance to diseases or environmental pressures”.

 EFSA (European Food Safety Authority)


“Targeted genome modification techniques could have revolutionary applications in agriculture. They consist in introducing very precise genetic modifications which make it possible to accelerate the selection speed. They represent a fundamental departure from the “old” GMOs, insofar they could occur naturally and are virtually undetectable”.

French Parliamentary Office for evaluation of scientific and technological options (OPECST)


January 18th 2018, the European Court of Justice (ECJ) Advocate General  issued preliminary conclusions on whether some of the new genetic engineering techniques fall within the scope of the European legislation on GMOs (Case C-528/16).

It is true that this is only a first opinion on the long-standing issue, whose final conclusions, and the related framework, are expected to be presented by the ECJ by summer 2018, however it has to be underlined what this outcome may entail for the future of plant improvements at European level.

On this issue, it is absolutely necessary to focus first and foremost on facts, namely scientific arguments.

First of all, what the Advocate General Mr. Michal Bobek did today, was to provide a legal interpretation as a response to France enquiry in 2016, which asked the ECJ to specify whether a type of herbicide-resistant rapeseed obtained through gene-editing should undergo the approval process for GMOs, and so if plants resulting from the new techniques will be covered by the EU GMO legislation – Article 2(2) of GMO Directive 2001/18/EC. To be even more precise, French Council of the State posed to the ECJ four interlocutory questions (available here) on the scope of the EU’s GMO legislation and specifically, (i) if classical and/or newer site-directed mutagenesis plant breeding techniques produce GMOs and (ii) if EU Member States retain any discretion in transposing these EU Directives to their national laws.

“Directive 2001/18/EC regulates the deliberate release into the environment of genetically modified organisms (‘GMOs’) and their placing on the market within the Union. In particular, the organisms covered by that directive must be authorized after an environmental risk assessment. They are also subject to traceability, labelling and monitoring obligations”.

“Article 3(1), read in conjunction with Annex I B, states that the GMO Directive shall not apply to organisms obtained through certain techniques of genetic modification, such as mutagenesis (‘the mutagenesis exemption’)[1]”.

The Advocate General’s opinion attempts to make clear if and to what extent organisms developed through conventional and innovative plant breeding techniques (specifically mutagenesis), are to be regulated either through the same framework as conventional plant breeding or as genetically modified organisms (GMOs). It is necessary to specify that under the current EU legislative framework, organisms developed through traditional mutagenesis breeding techniques are regulated as conventional and are therefore exempt from the EU’s main GMO regulation, Directive 2001/18/EC.

“In my view, provided that they meet the substantive conditions of Article 2(2) of the GMO Directive, organisms obtained by mutagenesis are GMOs within the meaning of the GMO Directive (a). However, as long as the process of mutagenesis does not involve the use of recombinant nucleic acid molecules or GMOs other than those produced by one or more of the techniques listed in Annex I B, those organisms are exempt from the obligations laid down by the GMO Directive by virtue of Article 3(1) of the GMO Directive, read in conjunction with its Annex I B (b)”. – Advocate General on the scope of the GMO Directive and of the mutagenesis exemption.

Furthermore, he also specified that: “Like the Commission, I am of the opinion, that there is only one relevant distinction that should be made in order to clarify the scope of the mutagenesis exemption: the caveat set out in Annex I B, namely whether the mutagenesis technique involves ‘the use of recombinant nucleic acid molecules or [GMOs] other than those produced by … mutagenesis [or] cell fusion … of plant cells of organisms which can exchange genetic material through traditional breeding methods’ (‘the Annex I B caveat’)(1). No further distinctions should — or even could — be made judicially”.

Having in mind that this legal advice is not binding but that it is usually followed by European Court of Justice (ECJ) panel of judges, what it states in short is that crops obtained by the plant breeding technique of mutagenesis do not fall under laws restricting the use of genetically modified organisms (GMOs) however, and this is a point which has to be thoroughly analyzed, the Advocate General pointed out that  the Directive 2001/18 does not preclude Member States from adopting measures governing mutagenesis provided that, in so doing, they respect the overarching obligations arising from EU law.

“Against this background, I am of the opinion that Member States have the competence to regulate organisms obtained through mutagenesis provided that they comply with their overall EU law obligations, whether of secondary law origins or the rules of primary law, such as Articles 34 and 36 TFEU”.

For a more precise explanation here below an extract from the Advocate General’s conclusion:

(1) Provided that they meet the substantive criteria of Article 2(2) of Directive 2001/18/EC of the European Parliament and of the Council of 12 March 2001 on the deliberate release into the environment of genetically modified organisms and repealing Council Directive 90/220/EEC, organisms obtained by mutagenesis are genetically modified organisms within the meaning of that directive;

The exemption laid down in Article 3(1) of Directive 2001/18, read in conjunction with its Annex I B covers all organisms obtained by any technique of mutagenesis, irrespective of their use at the date of the adoption of that directive, on the condition that they do not involve the use of recombinant nucleic acid molecules or genetically modified organisms other than those produced by one or more of the methods listed in Annex I B.

(2)      Council Directive 2002/53/EC of 13 June 2002 on the common catalogue of varieties of agricultural plant species is to be interpreted as exempting varieties obtained by mutagenesis from the specific obligations laid down therein for the inclusion of genetically modified varieties in the common catalogue of agricultural plant species.

(3)      Directive 2001/18 does not preclude Member States from adopting measures governing mutagenesis provided that, in so doing, they respect the overarching obligations arising from EU law.

As clarified by a USDA-FAS Report on January 16th on the expected legal opinion for New Breeding Techniques in the EU, “Advocates General are assigned to most cases before the ECJ to serve as an advisor to the court on how the case should be resolved. Their opinions are given considerable weight, and often are followed by the court, but are non-binding in all cases”. Furthermore, USDA Rapporteur found that by reviewing ECJ case law, what appears is that the majority of ECJ judgements complement the opinions of the advocate general.

In order to provide a brief background on the issue but without going back to the far past, last year, on April 28, 2017 the SAM-HLG (Scientific Advice Mechanism -High Level Group) released its explanatory Note in response to the request, formulated in the Scoping Paper (adopted by the HLG on 25 November 2016), by the European Commission, to provide an up-to-date overview and a comprehensive scientific comparison on new techniques in agricultural biotechnology, including their potential agri applications in both fields of synthetic biology and gene drives, considering the key characteristics of each of these new techniques.

Among the others, the Note highlighted that “all breeding techniques applicable in agriculture (conventional breeding techniques, CBT; established techniques of genetic modification, ETGM; and new breeding techniques, NBT) make use of genetic diversity and change whether naturally occurring or resulting from human intervention, in order to select or generate plants, animals or microorganisms that exhibit preferred characteristics” and that “the NBT of genome editing offer not only the ability to target insertions (resulting in comparatively fewer unintended effects on the expression of other genes or their disruption) but also the ability to make small, precise and specific changes, such as point mutations, which can also be observed in nature”. 

This independent explanatory note, as also specified in the Scoping Paper, does not take a position; it does not cover legal issues and it does not make policy recommendations to policymakers. It is another piece to the puzzle.

[1]Mutagenesis involves an alteration of the genome of a living species. Unlike Transgenesis, which is a genetic engineering technique that consists in inserting one or more genes from other species into the genome of another species, it does not, in principle, entail the insertion of foreign DNA into a living organism. Techniques of mutagenesis have evolved over time as the result of scientific progress in biotechnology” Source: Case C-528/16 – OPINION OF ADVOCATE GENERAL BOBEK, 18 January 2018(1)


What should the EU’s Plant Protein Strategy do?

A review of existing CAP measures for protein, oil protein and oilseed crops and market trends What lessons? What next?

Policy Briefing, October 2017.

In the European Union, the goal of ‘protein independence’, or rather the EU’s heavy reliance on plant protein imports ‒ mainly in the form of soybean meal ‒ which are used to feed livestock, is a recurring theme.

Over the last three decades, the EU has made independence a strategic priority at every major policy review: the Blair House negotiations, the CAP reforms of 1992, 2000, 2003, 2008, & 2013, and in the European Strategy for Biofuels from agricultural sources. This has given varying degrees of satisfaction and has had varying degrees of success.

Commissioner Hogan has decided to revisit this goal. And the context is a busy one: the CAP’s greening measures are being modified, there is a proposal to revise the REDII Directive, the business outlook in the agricultural sector is manifestly depressed and preparatory discussions are underway for the post 2020 EU budget, including the CAP. It is therefore a good time to consider the lessons from the measures that have already been implemented, and to use them to outline what an effective growth plan might look like.

Over the last 30 years, European support has come in three main forms:
– voluntary coupled support (VCS) for protein and oil-protein bearing crops, with Member States (MS) having been asked to decide on the adoption of this type of voluntary support measure in 2003, 2008 and 2013;

– biofuels targets in the EU transport sector’s energy mix;
– the requirement, introduced by the CAP in 2013, which obliges farmers to put 5 % of arable land into Ecological Focus Areas (EFAs) and to be able to grow nitrogen-fixing plants and catch crops in them.

In light of the objectives of increasing both the ‘area under cultivation’ (AUC) and the quantity of protein and oilseed crops produced in the EU, this study analyses the impact of these three principle policy measures in two main Parts.

Part 1 outlines the current situation for protein and oil-protein bearing crops:
– section 1 analyses of how the CAP and the incentives for these crops have changed over time;
– section 2 attempts to identify the extent to which there is a correlation between

CAP incentives and trends in the AUC/quantity metrics for protein and oil- protein bearing crops.

Part 2 analyses the changes in EU oilseed production and the extent to which these are attributable to the EU’s biofuels policy.

This analysis shows the positive outcome of the 2013 reforms, which doubled the production of protein and oil-protein crops, principally through the introduction of greening and Ecological Focus Areas (EFA) but also by retaining the discretionary option for MS to allocate coupled support to these crops.

I- Protein and oil-protein crops (peas, broad beans & field beans, and soya beans)

1) Changes in the CAP and incentives for protein-bearing crops

– 1999: Agenda 2000

Following the Berlin Agreement, the “Agenda 2000” CAP reform package was adopted. Among its key provisions were the principle of eco-conditionality for direct support schemes, and common regulations for field crops (cereals, oilseeds and protein-bearing crops).

In 1999 and 2000, a direct support payment was created based on: a single all-crop rate of 63 euros/t and the historic yields of specific production zones. A protein- bearing crop premium was also introduced. The payment for protein-bearing crops was initially set at 78.5 euros/t, and reduced in 2000-2001 to 72.5 euros/t, which amounts to a premium of 9.5 euros/t for protein-bearing crops.

– 2003: The Luxembourg Agreement

A new CAP reform, part of the mid-term review, initiated the decoupling of support with a 75% reduction in the amount of coupled support and the shift to a “single farm payment” scheme. In addition to this single payment scheme, based on hectarage, a premium of 55.57 euros/ha was introduced for protein-bearing crops.

– 2008: The CAP Health Check

2007-2013 saw the opening of a fresh programming round for the CAP. In 2010, 6 MS made use of article 68 (possibility for MS to use Pillar 1 funds for specific objectives, drawn from the country’s Pillar 1 decoupled support budget) to support protein-bearing crops: Finland, France, Lithuania, Poland, Slovenia and Spain (source: EC-DG Agri 2010).

Member State (MS)

Details

Finland

6.5 M euros for protein and oilseed crops in 2011; 83 000 ha or approx. 78 euros/ha

France

80 M euros in 2010-2011; peas, field beans, lupins: 100 euros/ha in 2010 and 140 euros/ha in 2011

Poland

21.6 M for 2010-2011; 163 euros/ha in 2012

Spain

1 M euros/year in 2010 and 2011

Table 1: amount of CAP article 68 support for protein-bearing crops in 2008 (Sources: European Parliament, The Environmental Role of Protein Crops in the New Common Agricultural Policy, 2013)

– 2013: CAP reform

The 2013 CAP reform gave MS a discretionary option to reallocate 13 % of their Pillar 1 direct support budget to voluntary coupled support (VCS) measures. This 13% could be raised to 15% if the MS decided to devote 2% or more of their VCS budget to the production of protein crops (including soya).

On the 1st August 2014 MS notified the European Commission of their VCS measures for protein-bearing crops. 11% of this VCS support was allocated to protein-bearing crops ‒ within a quantitative limit of 4.3 million hectares and an annual total budget at EU level of 441 million euros (or 102 euros per hectare on average). The figures mean that the protein-bearing crop sector has been the fourth most supported sector in terms of VCS support, lagging behind the livestock rearing sector. VCS measures came into force in 2015 and will run until (end) 20201.

1 Source: Commission Information Note, 30 July 2015.

The 16 MS that opted to support protein-bearing crops through VCS were:

Member States

Details (amounts in millions of euros)

Bulgaria

16 M euros

Czech Republic

17 M euros

Greece

7 M euros

Spain

45 M euros (209 euros/ha)

Finland

6 M euros

France

146 M euros (187 euros/ha)

Hungary

27 M euros

Croatia

4 M euros

Ireland

3 M euros

Italy

36 M euros

Lithuania

14 M euros

Luxembourg

Latvia

4 M euros

Poland

68 M euros (266 euros/ha)

Romania

49 M euros

Slovenia

3 M euros

Table 2: VCS for protein-bearing crops, entry into force in 20152.

With the 2013 reform, which included the objective of increasing the EU’s independence in Protein-Rich Materials, soya production became eligible for voluntary coupled support (VCS). In 2015, in the MS that adopted VCS for these crops, their rate fluctuated between 96 and 419 euros/ha.

The 9 MS that did so (amount in euros/ha) were: Bulgaria: 156; Croatia: 260; Czech Republic: -; France: 100 with a limit of 12.5 ha per farm; Hungary: 150-200; Italy: 96; Poland: -; Romania: 325; and Slovenia: 419.

Moreover, the 2013 CAP reform linked 30% of Pillar 1’s direct payments to greening measures, which included creating Ecological Focus Areas (EFA) on at least 5 % of each farm’s arable land. This obligation has been largely fulfilled by the EU’s farmers: 15%, or 8 million hectares, of arable land was put into EFAs by 2016. Nearly 40% of total EFA land area has been planted with nitrogen-fixing crops. With respect to soya, out of the 12 MS that produce it, 10 made it eligible for planting in EFAs.

2 Source: Commission Information Note, 30 July 2015.

2) Trends in area under cultivation (AUC) and production quantities in the EU

– High-protein peas


Screen Shot 2018-01-08 at 15.53.37

Figure 1: Trends in production and AUC for high-protein pea crops from 2000 to 2016 (source: Eurostat database)

Due to successive falls in yields, the production of high-protein peas in the EU fell progressively from 2000 to 2003. However, the AUC remained stable at around 750,000 ha.

With the accession of 10 additional countries to the EU in 2004, production picked up again. This spike would only be a temporary reprieve, however, as the falling trend for AUC/quantity produced returned in 2005 and continued until 2009. The low yield problem (and thereby mediocre profitability compared to the alternative field crops available) persisted, and the AUC fell markedly year on year, despite the coupled support of 55.57 euros/ha. Up to and including 2009, European high-protein pea production seemed to be fighting a losing battle with AUC collapsing from 851 290 ha in 2004 to 411 930 ha in 2008, in other words a reduction of 51.61%.

Between 2009 and 2011, the AUC began to grow again, only to fall back in 2012 and 2013. It is possible to posit a correlation between the end of the fall in production and ‒ and even a modest recovery ‒ with the application of the new article 68 introduced following the 2008 CAP Health Check, however, this measure was unable to prevent fresh falls in the AUC in 2012 and 2013.

Since 2014 the trend has reversed and high-protein pea production has enjoyed continued growth both in terms of quantity and AUC. 2015 and 2016 saw strong growth with, respectively, 2,076 million tonnes and 744 260 hectares and 2,329 million tonnes and 911 690 hectares ‒ in other words the highest levels since 2000. Between 2013 and 2015 production increased by 60.83% and AUC by 60.70%. Between 2013 and 2016 production increased by 80.49% and AUC by 96.85%.

This growth occurred after the 2013 reform. There are two types of support for protein crops: on the one hand, voluntary coupled support, and on the other hand, the discretionary option of planting protein crops in the EFA.

Now, by examining the situation for high-protein peas in Germany, where voluntary coupled support has not been applied to protein crops, we get an interesting perspective on which support has driven this growth.


Screen Shot 2018-01-08 at 15.56.46

Figure 2: Trends in production and AUC for high-protein pea crops in Germany from 2000 to 2017 (Source: Eurostat database).

In Germany, the AUC and quantities of production for high-protein peas fell each year from 2000 to 2008. From 2008 to 2014 both metrics stagnated. However, in 2014 and 2015 they increased significantly (+78.23% for production and +89.68% for AUC). Growth between 2013 and 2016 was 124.09% for quantity and 130.87% for AUC.

What we see here is that in Germany, as in the whole of the EU (and without prejudice to (any potential) differential impact of voluntary coupled support in the MS that have deployed it), by opening up the EFA to protein crops the ‘greening’ measure has clearly been the main driver of the return to rising AUC & quantity of production for high-protein peas.

– Broad Beans & Field Beans

Screen Shot 2018-01-08 at 15.58.16

Figure 3: Trends in production and AUC for broad beans and field beans from 2000 to 2016 (source: Eurostat database)

The trend for broad beans & field bean crops mirrored that of high-protein peas over the 2000-2013 period. Despite the different measures implemented between 2000 and 2013, production struggled to grow and the small rise in 2009-2010 petered out quickly.

Having said this, as for high-protein peas, from 2014 to 2017, broad bean and field bean crops have grown both in terms of AUC and production quantity ‒ and experienced extremely high growth in 2014 and 2015. In 2016 production levels stabilised at the 2015 level, and 2017 has seen a fresh increase in AUC. Through 2014 and 2015 production grew by 55 % and AUC by 61 %.

As for high-protein peas, the hypothesis of causality between the increase in EU broad bean and field bean production from 2014 to 2017 and the support introduced by the 2013 reform, appears a convincing one.


Screen Shot 2018-01-08 at 15.59.28

Figure 4: Trends in production and AUC for broad beans and field beans from 2000 to 2017 in Germany (source: Eurostat database)

As for high-protein peas, the trends observed in Germany from 2014 to 2017 tend to show a very positive impact from the EFA greening measure for nitrogen-fixing crops (including protein-rich varieties). This can be seen clearly in Figure 4, which shows a constant increase in both quantities produced and AUC from 2014 onwards, whereas levels had previously been stable. In percentage terms, from 2013 to 2016, growth was 157.45% for quantity of production, and 135.15% for AUC. And, as for protein peas, this increase was especially pronounced between 2014 and 2015 (+52.05% for quantity of production and +83.41% for AUC).

The measure promoting nitrogen-fixing crops in EFA has therefore clearly encouraged the growing of broad bean and field bean crops in the EU.

– Soybean Production


Screen Shot 2018-01-08 at 16.01.50

Figure 5: Trends in production and AUC for soybean from 2000 to 2016 (source: Eurostat database)

The graph shows fluctuations in the AUC and quantities produced for soybean crops in the EU up to and including 2013. With the exception of 2007-2009 (a noticeable dip) production held up, but was hardly buoyant.

In 2015 and 2016 both metrics showed a significant increase, reaching a new level substantially above the previous average, including 2013. In 2015 production increased by 112.34% and AUC by 103.21% relative to the previous average up to and including 2013.

Even if the 2016 levels are slightly lower than in 2015, a clear correlation between MS implementing the 2013 CAP reform (entry into force in 2015) and the positive progression in soybean production is apparent. In implementing the 2013 reforms, the EU’s main soybean producing countries chose to encourage production with coupled support and by choosing to plant soybean crops in their EFA. However, conclusions about the relative weight of these two measures in the strong soybean growth figures since 2014 cannot be drawn at this point.

In summary:

During the 2000-2013 period, the reformed CAP’s new measures and policy adjustments were unable to turn around what had been a negative or stagnating trend. Only the improvement for high-protein peas from 2009 to 2011 could be interpreted as a ‒ temporary ‒ impact of the measures adopted following the 2008 Health Check.

However, in the wake of the 2013 reforms, the increasing AUC and production quantities for high-protein peas, broad and field beans and soybeans, appears highly correlated with the double decision to require 5% of arable land to be put into EFA and to allow nitrogen-fixing crops in them. This double decision had the positive outcome of enabling EU protein and soybean production to jump to a new level ‒ and has also led to (the EU) having not just 5% of arable land in EFA, as regulations require, but 15 %.

In the absence of coupled support and therefore with the double EFA measure as the sole incentive, Germany has experienced similar growth to that described here for the EU as a whole. However, we cannot rule out there being a correlation between coupled support and the newly positive trends in protein crop production in the other MS on the basis of the German case alone.

There is, however, an important question mark now hanging over the immediate future: will the Commission’s recent total ban on the use of pesticides for nitrogen-fixing crops grown in the EFA bring to a halt or even reverse the positive progression of EU protein crop production? By opting for a blanket ban rather than require ‘reasonable use’, has the Commission carefully assessed the risks, which may be the end of production of this type of crop in the EFA as farmers weigh up the opportunity costs between:

  • –  the cost of sowing and growing their crops without the ability to control damage from pest invasions;
  • –  and the option of reducing EFA area to the regulatory minimum, or even of not growing crops in them at all (thus opening the door to additional protein crop imports into the EU and undermining both European and global food security)?There is another under-explored area where progress could be made: improving crop technology and achieving more stable yields ‒ even in a context of climate/weather variability. This can be achieved through research to help farmers optimise crop management, combined with substantial investment in variety research. Seed companies abandoned variety research for protein crops because in the EU their production had either been stagnant or in the worst cases were falling, so they have not been seen as attractive business prospects.The conditions for investment in improved varieties will return when the outlook for production is positive and levels reach a critical threshold to become credible markets. These basic conditions have been emerging during the 2014-2017 period but the positive outlook could easily be broken. The (policy) goal is not so much to invest public money in variety research but to create the conditions in which it can take place. The EU can do this via the CAP, but also by taking, as it will have to, responsible positions, for example, on the subject of new variety selection technologies.

    On the question of the CAP, the changes affecting the conditions for greening measures discussed above raise the question of what the CAP is seeking to achieve: is it a policy that seeks to achieve results and which empowers farmers, as business entrepreneurs who are able to take decisions ‒ and allocate resources effectively ‒ or a policy that dictates the agronomic approach that farmers should follow in order to respond to what ‘public opinion’ is thought to want?

II- Rapeseed oil crops

1) The EU’s biofuels policy

In the 1990s the EU launched a policy to stimulate biofuel production. The aim was to reduce energy dependence on imported fossil fuels and to strengthen the resilience of the agricultural sector. Objectives for a biofuels contribution to energy use in the transport sector were set: in 2003, an objective of 2% was set, then in 2009, an objective of 5% by 2010 and 10% by 2020 was set. Following the 2003 Biofuels Directive, and the reform of the CAP taking place in parallel, a financial subsidy for energy crops of 45 euros per hectare was introduced and this ran until the CAP Health Check in 2008. A biofuels industry was thus born, was favourably received in general and benefited from EU regulatory and financial incentives.

Following the 2007 food riots and intense lobbying by certain organisations, the public perception of biofuels changed, that is, for conventional biofuels, even though the arguments made were false and have since been formally discredited by institutions such as the FAO, by the science community and by the Commission itself (DG Agri, JRC). The goals were nonetheless revised downwards, with the objective of a 7% contribution by 2020 set in 2015, and MS were encouraged to redirect their subsidies to so-called ‘advanced’ biofuels.

2) Rapeseed: AUC and production trends

Rapeseed is the most used agricultural product in biodiesel production in the EU. It is ahead of palm oil (which is imported) and far ahead of soybean and sunflower oils (the share of the latter remaining limited throughout the period in question).


Screen Shot 2018-01-08 at 16.03.26

Figure 6: Trends in production and AUC for rapeseed from 2000 to 2016 (source: Eurostat database)

Figure 6 shows a clear jump in the quantity of rapeseed produced from 2004 to 2009 (+35% compared to the average of previous years). In 2004 the AUC increased by a smaller percentage (9%) but from 2003 to 2007 it increased by 57%, and has remained relatively stable since.

Screen Shot 2018-01-08 at 12.46.23

Figure 7: Supply of rapeseed oil to the food and biofuel markets (Source: calculations by FEDIOL, using Oil World Annual data 2000-2011)

Figure 7 shows that the increased production of rapeseed oil in 2004 was driven by its use as an energy source, so, we can say that in the EU, the increase in AUC for rapeseed is directly correlated with the progression of rapeseed-based biodiesel.

The financial support measures for energy crops adopted in 2003 before being abandoned in 2008 therefore seem to have, in parallel with tax incentives introduced in different MS, successfully spurred rapeseed production.

The production of biodiesel from EU oilseed crops has generated the production of high-protein oilseed meal as a co-product, reducing the EU’s dependence on imported soybean meal. The emergence of these new energy markets for European oilseeds (especially rapeseed) in fact sustains an additional annual production of 9.3 MT of European rapeseed meal, reducing imports on which the EU depends.

Biodiesel production in the EU was, initially, almost exclusively rapeseed-based. And in 2008 rapeseed’s contribution to biodiesel was still 72% although it has subsequently lost market share to competition from imports of palm oil ‒ and this has occurred despite the serious questions about the environmental and economic record of biodiesels made from imported palm oil (see our report « producing fuel and feeds – a matter of security and sustainability for europe» http://www.farm- europe.eu/travaux/poducing-fuel-and-feeds-a-matter-of-security-and-sustainability-for- europe/ ).

In summary:

Rapeseed meal production has doubled since 2004. 9.3 million tons of rapeseed meal are directly attributable to biodiesel production in the EU. Rapeseed oil is used to produce biodiesel, and the high-protein co-product of this process is available to EU farmers as an animal feed.

This greater availability of plant protein within the EU market directly reduces the quantity of primary agricultural produce for use in animal feed imported into the EU. Setting this in context, Europe is structurally deficient in protein and imports 70 % of its protein crops and meal from third countries. A recent report of the European Parliament has estimated the EU’s ‘protein gap’ at 20 million tonnes[24].

In light of this, both the European Parliament and Member States, “Calls on the Commission swiftly to submit to Parliament and to the Council a report on the possibilities and options for increasing domestic protein crop production in the EU by means of new policy instruments (also taking into account the use of oil seeds and their by-products and the potential extent for substituting imports), the potential effect on farmers’ revenues, the contribution it would make to climate change mitigation, the effect on biodiversity and soil fertility, and the potential for reducing the necessary external input of mineral fertilisers and pesticides”.

The increase in the production of rapeseed and sunflower meal (the seed is made up of approx. 60 % protein-rich meal and 40 % oil) has given the EU a minimum of independence. Imports of soybean meal have reduced, especially compared to the peak import levels of 2007.

While the use of rapeseed oil in food consumption has been stable for several decades, the emergence of a growing European supply in protein-rich meal has only been possible by developing alternative commercial uses for the oil.

It is therefore clear that the production of biofuels from European plant and cereal oils is essential if (and is today the only option offering sufficient scale) the EU is to improve and secure a domestic (EU grown) supply of plant protein that can be used as an animal feed, thereby limiting imports.

Biofuels based on palm oil – even those based on imported used cooking oil – do not make sense for the EU, both in environmental and economic terms. It should be noted that this report does not deal with the subject of the sustainable use of palm oil in the EU food industry, which is one that would benefit from greater clarity.

The question that arises today is therefore that of the appropriateness of the EU’s REDII proposal which is currently on the table and which would eliminate much of the production of conventional biofuel, with no justification.

The absence of a strategic EU vision raises questions. Are we still applying terms such as ‘growth’, ‘profitability’ and ‘competitiveness’ to our food production system and to our agriculture, or have we replaced them with the term ‘decline’?

Do we want to grow forests rather than crops across the entire EU and limit agriculture to, at best, the domestic supply of food, using imports to meet a host of EU citizens’ other needs, such as green chemistry and green energy, to name just a few?

Do we want to use EU agriculture as a driver for the green economy or do politicians in fact have other economic priorities, such as, for example, protecting the position of fossil fuels and encouraging biofuels based on used cooking oil (palm)?

If it is the latter then we will need to prepare for a constantly increasing CAP budget. Not only this, we will also be completely abandoning the goal of a market-oriented agriculture, with dependence on imports in its place. Such an approach would also generate additional fluctuations in the world’s agricultural markets.

If, on the other hand, the objective is to be serious and have genuine ambition for our agriculture and our related ‘green growth’ industries; then it needs to be recognized that conventional biofuels, made from EU grown primary agricultural materials, have a key role to play in the development of the EU’s food system.

The Commission’s REDII proposal3, currently being debated in the European Parliament and in the Council, would lead, in the short term, to a drastic reduction of the European production of oilseed-based biodiesel.

3 A new Renewable Energy Directive for the period after 2020.

In practice, the consequences of this would be:

– greater consumption of fossil fuel energy and imported biofuels, which have questionable environmental records (2nd generation European biofuels are emerging more slowly than the somewhat pious hope evident in Commission statements);

– but also a greater quantity of imported plant protein due to the fact that the proposal sounds the death knell for the annual 9.3 million tons of rapeseed meal produced to supply the biodiesel industry.

***

The present analysis of changes in (plant-based protein) policy has discussed the relative effectiveness of the different initiatives implemented by the EU following the European Commission’s decision to initiate a debate on the content of a new Protein Strategy, the aim of which is to reduce Europe’s dependence on imports of soybean and soybean meal from the Americas.

Since 2000, the EU has launched more than half a dozen initiatives to increase protein and oil-protein crop production. Analysis of market trends over the 2000-2016 period clearly shows that two approaches in particular have been effective in boosting production in a significant way:

  • –  first, expanding the biofuels industry, which today offers the best route to a Protein Strategy with sufficient scale and ability to reduce Europe’s dependence on soybean imports.
  • –  second, and more recently, the CAP’s 2013 greening initiative, and in particular the authorisation of nitrogen-fixing crops in Ecological Focus Areas, which led to the doubling, at least, of the quantities of peas, broad beans and field beans and soybeans, that are produced in Europe.It is surprising to see that these two pillars of European policy, which have unquestionably given tangible results, are today being undermined by the European Commission itself.By banning the use of pesticides in the Ecological Focus Areas the Commission risks undermining the progress made since 2013. Moreover, in their current proposals for revising the Directive on the promotion of the use of energy from renewable sources (REDII), the Commission completely omits any reference to the benefits of having an agriculture-based biofuels industry, which it now risks crippling, despite the fact that this industry contributes both to more sustainable transport and to the resilience of the EU’s agricultural sector overall.

Looking to the future, any ambitious Protein Strategy should include:

– the ability of the biofuels industry to play its role to the full; and, in a complementary manner,

– continuing to green the CAP in an intelligent, pragmatic and proactive way ‒ putting ideology to one side ‒ and reconciling business and environmental approaches. It is clear that nitrogen-fixing crops have a key role to play in such a strategy.


UNLOCKING THE POTENTIAL OF THE EU FOOD SUPPLY CHAIN. A BALANCED, COMMON APPROACH TACKLING UTPs

October 2017

1. INTRODUCTION

2016 has been quite productive in terms of debates around the Food Supply Chain at the European level. The issue has been triggered by the Agricultural Markets Task Force (AMTF) instigated by Commissioner Hogan, which examined the position of the farmer in the supply chain, and proposed a number of recommendations on different issues, amongst them trading practices in agricultural markets and contractualisation.

The Report has been deeply debated in the Agri Council, whose Conclusions of December 2016 on “Strengthening Farmers ́ Position in the Food Supply Chain and Tackling Unfair Trading Practices” made clear that imbalances in the bargaining positions often lead to unfair trading practices (UTPs), as well as to the need for a level-playing field for all actors in the chain.

The AMTF was not the only initiative around the issue of how to improve the functioning of the European food chain. The European Parliament has also been very active, and its last positioning was adopted in June 2016 with the adoption of a new Resolution on “Unfair Trading Practices in the Food Supply Chain”, in which it openly pledges for a framework legislation at EU level in order to tackle UTPs .

Along the same line, the European Economic and Social Committee supported the European Parliament ́s Resolution in its Opinion adopted at the plenary in October 2016 (“A Fairer Agro-Food Supply Chain”) and highlighted the need for a framework legislation at the European level as well as to take swift action to prevent UTP ́s .

In this context, the Commission is expected to come back with an initiative in the next months and give an answer both to operators and institutions on how to rebalance the relationship between the different links of the food chain and unlock its whole potential under clear, and common rules.

This paper is the contribution of Farm Europe to this debate, whose objective is fully shared if we want to improve in the long run the structure of this value added chain which is number one in the European economy.

2. WHY DO WE NEED A NEW FRAMEWORK? WHAT HAVE WE REACHED?

Discussions about the need to rebalance the food chain relationship are not new at the European level. All the institutions have participated in several attempts urged by different stakeholders, but in the end no concrete action has been taken.

On the contrary, in 2013, seven European Associations motivated by the former Commissioner Verheugen launched the Supply Chain Initiative (SCI) as a voluntary, private-led action in order to increase fairness in commercial relations along the food supply chain.

Since then, some advances have been achieved in promoting cultural changes and improving business ethics, but a set of important shortcomings have also been highlighted in the analysis of its effective application. Weakness in governance, limitations in transparency, no enforcement measures or penalties, a lack of effective deterrents against UTP and not allowing individuals to make anonymous complaints by potential victims, no own–initiative investigations by an independent body and under-representation of SMEs and farmers are the most important ones. 1

1 EP Resolution of 7 June 2016 on unfair trading practices in the food supply chain.

On the other hand, a fresh look to what is happening at the national level can give us a better idea of the framework in which the European debate is taking place. It is very clear that the primary concerns on the issue were born at the MS level, and all of them have been – in one way or another – actively looking for remedies. If we summarize what is going on in the different Member States, several distinctions can be made:

  •   There are some MS with specific measures for the food chain (i.e. Spain, UK, Italy…), and others refer directly to horizontal legislation (Germany, France,.. ).
  •  Four main types of models coexist: regulated in detail (UK, Spain, Italy..), self-regulated (Belgium), mixed model (Spain, UK) , horizontal regulation and countries with no specific UTP ́s regulation (Denmark, Sweden, Luxembourg,..).
  •  When there is a regulatory framework and control authorities, they can be either the Ministry of Finance (France), Competition Authorities (Germany), Food Safety and Economy (Portugal) or Agriculture (Spain).2

Nevertheless, considering facts and circumstances, we can reach the conclusion that despite the efforts made, self-regulation or voluntary approaches are not enough to solve the present imbalances in the food chain, and what is most worrying, disparities between national systems in place do not help to keep a level-playing field and ensure the proper functioning of the Internal market, while at the same time the fragmented nature of the markets expose supply chain operators to different conditions, regulatory uncertainty and inefficiencies.

3. A SET OF CONCRETE PROPOSALS.

If Europe wants a strong and balanced food chain, able to share all the value added generated across it under fair conditions, able to reinforce the position of producers as the most vulnerable link, and generate wealth up to the consumer, the Commission has to put forward a common framework with a minimum set of issues .

2 more detailed information in the study commissioned by the Spanish Agency for Food Information and Control (AICA) ,” Informe sobre la aplicacion de la regulacion de practicas comerciales en los paises UE” 2016. www.aica.gob.es

These core issues should be the following:

a) A set of guiding principles for the commercial relationships in the food chain.

There are three kind of relations in the food chain: 1) producer – industry, 2) producer – retail , 3) industry – retail.

For all cases, the relation shall be governed by the principles of balance and fair reciprocity between parties, freedom to enter into agreements, goodwill, mutual interest, equitable sharing of risks and responsibilities, cooperation, transparency and respect of free market competition.

Identification of the unfair practices to be relegated from commercial practice. There is a vast literature about UTPs , and in general terms they can be described as all kind of practices imposed to the supplier that do not respect fairness in the contractual relation, passing on inefficiencies or risks without any compensation.

Under this broad description we should include:

Unilateral or retroactive changes to the agreed terms (concerning volumes, quality standards, prices),

Unforeseen commercial payments, Charges of fictitious services,

Transfer of charges in promotions to the supplier with no negotiation and participation of the buyer,

Imposing unconditional return of unsold merchandise,

Non-compliance with payment delays as established in Directive 2011/7/EU,

Sudden and unjustified cancellation of a contract, Non-transparent, discriminatory electronic auctions.

No request for upfront payments to secure or retain contracts .

b) Identification of the unfair practices to be relegated from commercial practice. There is a vast literature about UTPs , and in general terms they can be described as all kind of practices imposed to the supplier that do not respect fairness in the contractual relation, passing on inefficiencies or risks without any compensation.

Under this broad description we should include:

  • Unilateral or retroactive changes to the agreed terms (concerning volumes, quality standards, prices),
  • Unforeseen commercial payments, Charges of fictitious services,
  • Transfer of charges in promotions to the supplier with no negotiation and participation of the buyer,
  • Imposing unconditional return of unsold merchandise,
  • Non-compliance with payment delays as established in Directive 2011/7/EU,
  • Sudden and unjustified cancellation of a contract, Non-transparent, discriminatory electronic auctions.
  • No request for upfront payments to secure or retain contracts .

c) Written contracts. Modern commercial relations imply taking into account a set of complex issues – quality, quantity, price, discounts, logistics and transportation, terms of delivery,…- that cannot be left to uncertainty. Moreover, clear conditions mean secure and stable relationships, as well as less legal controversies. We propose as a general rule the need for written contracts along the chain, with a minimum set of criteria, conditions that should be compulsory when requested by the supplier. In the case of agri producers, Producers’ Organizations and Interbranch Organizations could play a relevant role in this issue and negotiate on their behalf.

d)  Effective enforcement of rules. Experience shows us the shortcomings and limits of voluntary, non-binding models of enforcement. The most effective way is the supervision and control by an independent authority, granted with public powers, in order to ensure the effective application of the proposed set of rules.

e)  Fear factor avoidance. Enforcement should be possible either through independent authorities’ own initiative, or by operators and their organizations. It is crucial in this sense to establish an effective complaints lodge system that secures anonymity.

f) Sanctions and name-and-shame . Non-compliance with the proposed set of rules should be subject to sanctions, with dissuasive character, and include “Name and shame” provisions.

All these proposals should be part of a coherent, common European framework that needs to be covered under a legal umbrella.

Of course Member States should be able to have the maximum of flexibility to effectively apply this general framework, because in the end, what is important is the final outcome. On the other hand, changes of attitude and habits do not come from one day to another, so time and awareness are also part of the process.

Finally, this entire model should be complemented at the national level by the effective participation of stakeholders through codes of conduct / voluntary agreements, as a way to better implement a comprehensive system. In this sense, the work that has been already done at EU and national level must be useful to draw a baseline, as the set of principles agreed under the Supply Chain Initiative might be a first base of discussion.

AGRICULTURE AS A PROVIDER OF NON-FOOD PRODUCTS

October 2017.

The fact that agriculture is a provider of non-food products is not new. Agriculture, including animal rearing and forestry, has traditionally been a source of fibres, fuel, construction and other materials like hides and skins.

What is new is the scale and the range of products originating in basic agricultural raw materials, creating new important outlays for farmers and for the agri-industrial sector at large.

This paper aims at providing an overview of this promising area, and at underlining its significance for the economy of the sector.

Other than the traditional uses of agricultural, forestry and livestock raw materials that remain significant, new uses have developed at great speed in the last decades.

To name a few of the more illustrative examples: the large scale use of feedstock and biomass to produce biofuels, the use of oilseeds to produce oleo-chemical products, the expansion on the use of starch in a wide range of products including polymers for biodegradable plastics, or the expansion on the use of fibres in the textile and automotive industry.

Fuel, fibres, starch, oils, solvents, dyes, resins, proteins, speciality chemicals and pharmaceuticals, are today to various degrees of biological, agriculture origin.

These products present significant advantages as compared to similar products from other origins, as for instance fossil fuels:

-they benefit the environment by reducing greenhouse gases -they cut waste and pollution

-they produce social benefits by stimulating rural communities through establishment of local industries and providing new markets for farmers

-they improve the economic competitiveness of the agri-industry through development of new markets and products

This bio-economy is also a large provider of employment outside the primary agricultural sector: in the EU non-food bio-based products account for 2.7 million jobs, which is a figure that by itself shows how relevant the bio-economy is nowadays.

STARCH, OLEO-CHEMICALS AND FIBRES

Plants can synthesise an immense range of compounds. As ‘cell factories’ they contain structures which can be used by the physical, chemical and biochemical sciences to produce useful materials as fibres, starch, oils, solvents, dyes, resins, proteins, speciality chemicals and pharmaceuticals.

Some non-food crop uses such as textiles are widely known. Others may be less familiar such as plastics made from starch-based polymers. There are implications for consumer behaviour – for example in choice of ‘green’ products, and co-operating with waste disposal strategies to realise the benefits of biodegradable materials.

Many industrial applications of crop materials are already in use. For example it has been estimated that 15% of global oleo chemical production from plants enters non-food markets. About half of the 9m tonnes of starch produced in the EU from maize, wheat and potatoes is used for non-food purposes. In recent years there has been a strong increase in interest in particular applications, such as the use of natural fibres in building construction and as a replacement for fibreglass in composite materials for example in vehicle manufacture. Some of these are bulk applications while others are of particular interest to small and medium-sized enterprises seeking highly innovative specialised markets.

To give an idea of the significance of these new outlays to farmers, who are the producers of the raw materials, just to produce starch and oleo-chemicals more than 1.2 million ha were planted in the EU. This is an area similar to the whole utilised agriculture land in Belgium, by far and large not a marginal figure.

By the same token, the share of green, renewable and biodegradable products is far from negligible in the EU. The lead example comes from surfactants, where the share of renewable products in total consumption is over 50%. There is also a growing market for renewable lubricants, solvents and polymers.

Physical, chemical and genetic sciences can combine to produce new applications. Research in this promising field is a must, and the European Commission should be encouraged to dedicate adequate resources to the development of new non-food uses of agriculture production.

BIOFUELS

One of the most striking examples of non-food uses of agriculture raw material is biofuel, in particular the use of rapeseed to produce biodiesel and of maize, wheat and sugar to produce bioethanol.

In 2014, 13 million tonnes of biofuels were produced in Europe. Biodiesel made up 72% of this total, while bioethanol reached 28%.

Biodiesel

Biodiesel is a renewable fuel that can be produced from domestically cultivated and processed oilseeds (rapeseed mainly, sunflower seeds and soybeans). Today, biodiesel produced in the EU derives first from rapeseed, accounting for 55% of total production in 2014, and 49% in 2015.

Rapeseed used for the production of biodiesel is cultivated within the EU as a break- crop, which means basically that the agricultural product is grown after a sequence of cereal cultivation and plays a vital role in diversifying production, preventing plant diseases, managing weed and pest levels, restoring essential soil nutrient and nitrogen balance, and improving soil structure.

The introduction of alternative species (break-crops) into the cropping sequence boosts yield and reduce the need of inputs for the following crops. Indeed, rapeseed cultivation reduces the need for fertilisers, contributing in this way to the GHG reduction target.

However, its share in the feedstock mix has considerably decreased compared to the nearly 100% in the early stage and even around 60% in 2012. This is mostly due to higher use of imported palm oil linked to new plants using HVO (hydrogenated vegetable oil).

Use of palm oil for biodiesel in Europe has grown to over 3 million tons per annum contributing to the expansion of palm oil deforestation in Sumatra and Indonesia,

undermining valuable efforts engaged in the food sector to focus on certified palm oil production and fight against the expansion of unsustainable production.

Recycled vegetable oil/used cooking oil (UCO), is also being produced locally, but with a growing part being imported (UCO was the third most important biodiesel feedstock in 2015).

Contradictions around the use of UCO as an advanced biofuel arise in part because collectable UCO volumes in Europe amount to just a couple of litres per person per year or less than 1% of the amount of diesel fuel consumed per person on Europe’s roads.

Hence UCO imports will make up the majority of supply in any market in which UCO biodiesel is a growing biofuel. This is significant because UCO outside the EU is generally not a waste and is used for both feed and fuel. Its preferential use in Europe as a non-feed “waste” is thus highly questionable and appears to contradict the Waste Framework Directive’s instruction never to create waste if that is avoidable.

Bioethanol

In Europe, maize is the main feedstock used to produce renewable ethanol (5.4 million tonnes) followed by wheat and sugar, with almost all from European origin. As a practical matter, the EU ethanol industry no longer imports its feedstock from outside Europe.

In addition to that the EU’s ethanol bio refineries are the most advanced in the world in terms of co-products, producing an expanding array of high value bio economy products every year. Whereas in 2009 the most advanced ethanol bio refineries in Europe produced only animal feed and ethanol, today they produce ethanol, animal feed, vegetable oil, nutraceutical products, various products for human food, bio-electricity, fertilizer and other products.

The EU legal framework

The European Commission has made a proposal in the context of a revised RED (Renewable Energy Directive) that would phase out to a large extent the production of conventional or first-generation biofuels, produced from feedstock.

Nevertheless, facts are very clear: EU sourced biofuels have no negative impacts on food availability and prices. On the contrary, they have a positive impact on agricultural land, environment and transport decarbonisation.

1) Not only European sourced biofuels have not displaced any food and feed production…

Since 2008 EU biofuels production increased by 68% while global food prices dropped by 20%.

If one looks more closely to the relationship between the production of conventional biofuels in the EU and the availability of food and feed, the facts are that the EU production of the main feedstocks used for producing biofuels (rapeseed, wheat, maize and sugar) has either increased or remained stable (by quotas in the case of sugar), due to productivity gains.

European sourced biofuels have not displaced food and feed production, and have had no real impact on prices. On the contrary biofuels have helped in limiting the adverse effects of the food markets U-turn, offering some economic stability to struggling EU farmers, without adverse effects on food or feed availability. It is estimated that the production of crop-based biofuels in the EU generates at least 6.6 billion euros of direct revenue for EU farmers.

In addition, the bioethanol industry is said to have created 70 000 direct and indirect jobs since the EU introduced its biofuels policy, while the biodiesel sector has generated 220 000 direct and indirect jobs in the EU biodiesel production chain.

2) But they improve European and global food security…

There is another very important positive impact of biofuels production in the EU – the production of protein feed as a by-product.

Europe is still dependent for 70% of soybean meal imports to meet its growing livestock demand. The EU biofuels industry processing rapeseed and cereals now produces approximately 13 million tonnes annually of high protein meals that otherwise would be imported from the Americas.

It should be noted that less imports from the Americas mean more feed and food availability from these regions, to the benefit of consumers all over the world, thus contributing to increased global food security.

3) EU biofuels produced from EU feedstock provide immediate and efficient answer to transport decarbonisation…

Moving on to the crucial issue of the climate benefits of biofuels as compared to the use of fossil fuels, the fact is that transport is responsible for 25% of GHG emissions in Europe. This sector is at the heart of the climate challenge and biofuels are an alternative to fossil fuels.

Biofuels in the EU must conform to strict sustainability criteria to ensure that their production and use do not cause any harm to the environment. These criteria include a minimum rate of direct greenhouse gas emission savings (35% in comparison to fossil fuels in 2009, and rising to 50% in 2018) and restrictions on the types of land that may be converted to production of biofuels feedstock crops. Currently biofuels produced in the EU from EU feedstock achieve even better results.

In spite of the climate and economic benefits of conventional biofuels production, and the lack of negative impacts on the availability of food and feed, the Commission is proposing to limit its use to a maximum of 3.8% of the total energy consumption in the EU by 2030. Worth recalling that today the EU has a target of 7% use of biofuels in the transport sector.

4) The Commission is proposing to scale down the production of conventional biofuels, without any facts or analysis that would support its proposals.

Its proposal put at stake as well the emergence of second generation biofuels which development needs support of a strong conventional biofuels sector.

To make it even more unacceptable, the Commission seems to ignore that today the EU is a net importer of biofuels. Well informed decisions to promote balanced and locally sourced biofuels in the EU will mean that for every additional production of locally sourced biofuels, there would be a corresponding decrease of imports of biofuels produced in third countries with uncertain sustainability practices. There will be a decrease in feedstocks produced in third countries to be exported to the EU to produce biofuels and a decrease of feed meals imported into the EU from third countries. Moreover, those third countries could use the freed-up land resources for afforestation and food security purposes.

Amongst the imported biofuels, palm oil comes first. As a result of the 2012 Commission’s proposal on “crop-based biofuels”, the EU has been locked into strong levels of increasing imports into Europe.

The one consensus element, arising from all the scientific data, is the negative impact of unsustainable palm oil, especially in the context of deforestation of highly diverse and carbon rich ecosystems. Use of palm oil for biodiesel in Europe has grown thus contributing to the expansion of palm oil deforestation in Sumatra and Indonesia.

RED II should adequately respond to these concerns in the use of palm-oil based biofuels in the EU, instead of curtailing the production of sustainable EU based biofuels.

EU sourced biofuels cogenerating proteins are to be promoted if the objective is truly to fight climate change while improving food security and job creation.

Indeed, it his high time to get back to facts and confront populist positions that attempt to equate conventional biofuels to hunger and deprivation. On the contrary, conventional biofuels are a source of job creation and increased incomes, improving food security.

The debate on the current Commission proposals should make the targets for the use of renewable energy in transport more ambitious, not erase them. In addition to that, the sustainability criteria for feedstock originating biofuels should promote those that deliver protein feed, replacing imports, and freeing-up land in third countries for food and feed production or environmental improvement, on top of their emissions savings.

That would benefit the environment, create jobs and growth, diminish EU dependency on imports of protein feed and oil, and improve food security overall.

CONCLUSION

Agriculture, including forestry and animal rearing, has always been a provider of non- food products, a source of fibres, fuel, construction and other materials like hides and skins.

What is new is the scale and the range of products originating in basic agriculture raw materials, creating new important outlays for farmers and for the agri-industrial sector at large, and the speed at which they have developed in recent times.

The bio-economy brings 2.7 million jobs to the EU, outside those employed in the farming sector providing the raw materials for non-food uses.

These products present significant advantages as compared to similar products from other origins, as for instance fossil fuels, as they benefit the environment by reducing greenhouse gases, cut waste and pollution, produce social benefits by stimulating rural communities through establishment of local industries and providing new markets for farmers, and improve the economic competitiveness of the agri-industry through development of new markets and products.

Agriculture land has been used in the EU to a significant extent to generate non-food products, be it biofuels, starch, oleo-chemicals or fibres, without reducing the availability of food or feed, nor having a negative impact on consumer prices. The starch and oleo- chemicals production alone mobilize over 1.2 million ha, whilst at the same time food and feed production have increased as a result of productivity gains.

Non-food production contributes positively to farmers revenues, creates jobs in less- favoured rural areas, and increases the competitiveness of the agri-industry sector. Non-food production is a well-diversified sub-sector, with a promising future.

Public policies should encourage the development of the bio-economy, through applied research and other means. Public policies should in particular be based on facts and extend and strengthen existing mandates for biofuels, and thus contribute to decarbonisation of transport fuels.

Biofuels: surmounting populism for a fact-based policy

October 2017

The European Commission has made a proposal in the context of a revised RED (Renewable Energy Directive) that would phase out to a large extent the production of conventional or first-generation biofuels, produced from EU feedstock.

Why are conventional biofuels being targeted for quasi-extinction? Are they not valuable in reducing greenhouse gas emissions, and therefore mitigating climate change, as some claim? Are they a burden to feeding the European consumer and the world at large, as goes by the “accepted wisdom” of many NGOs?

Let’s first have a hard look at facts, then contrast those facts with the current Commission proposals, and conclude by putting forward what should be done in the best interest of the EU.

It is crucial that the European Institutions do not bow under pressure of populistic, un- verified, and factually wrong positions in the current debate.

The best interest of the EU is to promote policies that mitigate climate change and promote growth and jobs, and that do not undermine the availability of food to European and world consumers. It is well worth going against “accepted wisdom” if that “wisdom” is little more than baseless claims and statements that taint the value of biofuels.

THE FACTS

1) European sourced biofuels have not displaced any food and feed production

The public perception of biofuels changed dramatically in 2007, from a positive view on products that helped mitigate climate change and could replace favourably fossil fuels, to a largely negative view on products that compete with the production of food and therefore increase food prices.

Yet today it is clear that the oil price spike, which impacted the prices of all commodities, was the driving cause of food price peaks in 2007/2008, and that biofuels had a very limited impact.

It is the lead world organization for food that says so. FAO’s HLPE (2013)26 study determined that many factors caused the steep rise in food prices, such as: the impact of high oil prices on agricultural fuel and input costs, rising food demand, combined with a shift to animal protein diets in the large emerging economies, the influence of China ́s cereal stock management, weather events in major exporting countries, a slowdown in agricultural productivity growth, and speculation. In addition, the impact of biofuels on commodity prices may be considered as too low to quantify, as determined recently by the World Bank’s leading expert on the issue.

For those that like ad contrario arguments, the current feed and food price situations provides a good example, and further validates the assessment that biofuels do not play a significant role in food prices.

As a matter of fact biofuels production has kept growing since 2007/2008, and agriculture prices have fallen over since 2010. Since 2008 EU biofuels production increased by 68% while global food prices dropped by 20%.

If one looks more closely to the relationship between the production of conventional biofuels in the EU and the availability of food and feed, the facts are that food and feed production has gone up as the production of biofuels.

The EU production of the main feedstocks used for producing biofuels (rapeseed, wheat, maize and sugar) has either increased (doubling in the case of rapeseed) or remained stable (by quotas in the case of sugar), due in particular to productivity gains.

In this context, European sourced biofuels have not displaced food and feed production, and have had no real impact on prices. On the contrary biofuels have helped in limiting the adverse effects of the food markets U-turn, offering some economic stability to struggling EU farmers, not only without adverse effects on food or feed availability, but with a very important positive impact of biofuels production in the EU – the production of high quality protein feed as a by-product.

2) European sourced biofuels improve European and global food security

Europe is still dependent for 70% of soybean meal imports to meet its growing livestock demand.

Soybean meal imports declined, especially from the 2007 peak level, as a result of increased vegetable protein meal production within the EU which allowed to reduce imports each year of nearly 13 million tons of rich protein meal, reducing the EU deficiency by one third.

Indeed, The development of the output of rapeseed and sunflower meal (protein meal accounts for about 60% of the seed and oil 40%) has ensured with an extra production of 10 Mt a minimum of self-sufficiency.

While food consumption of rapeseed oil has been steady for decades, the development of an increasing European supply of protein meal has been made possible by finding alternative outlets for oil, i.e the production of biofuels.

In 2015 EU bioethanol companies produced 5 million tonnes of high protein animal feed. That is enough protein to feed 3.5 million dairy cows, or 17% of the EU dairy herd.

The EU biofuels industry processing rapeseed and cereals now produces approximately 13 million tons annually of high protein meals that otherwise would be imported from the Americas.

It is an evidence therefore that feed meal production and biofuels production from European vegetable oils and cereals are key (and today the only realistic option) for improving and securing the availability of higher volumes of vegetable protein produced locally and used as animal feed source, limiting imports.

It should be noted that less imports from the Americas mean more feed and food availability from these regions, to the benefit of consumers all over the world thus contributing to increased global food security.

What appears quite clearly from the facts is that production of biofuels from EU agriculture origin complements food demand: the increased production had no impact on the availability of cereals, oilseeds or sugar for human or animal feed consumption but instead the production of biofuels is vital for the production of proteins for animal feed and, thus, has a positive impact on European and global food security.

Let us now move on to the climate benefits of biofuels as compared to the use of fossil fuels.

3) EU biofuels produced from EU feedstock provide immediate and efficient answer to transport emission.

Transport is responsible for 25% of GHG emissions in Europe. This sector is at the heart of the climate challenge. Biofuels are an alternative to fossil fuels. In this context, the share of biodiesel and bioethanol is expected to grow in the energy mix, as their role as an alternative to fossil fuels is of paramount importance.

The EC’s 2016 Strategy on Low Emissions Mobility envisages biofuels comprising 35% of transport energy in 2050, twice the level of renewable electricity. The data shows that biofuels will continue to make up over 90% (around 28.9 MTOE) of renewable energy demand in 2020, with the remaining 3.1 Mt being met by renewable electricity.

Biofuels and feedstock production in the EU must conform to strict sustainability criteria to ensure that their production and use do not cause any harm to the environment or negative social effects. Accordingly, the Renewable Energy Directive, which was adopted in 2009, sets out biofuels sustainability criteria for all biofuels consumed in the EU.

These criteria include a minimum rate of direct GHG emission savings (rising to 50% in 2018 in comparison to fossil fuels) and restrictions on the types of land that may be converted to production of biofuels feedstock crops. The latter criterion covers direct land use changes only. Specifically, biofuels cannot be grown in areas converted from land with previously high carbon stock such as wetlands or forests and also they cannot be produced from raw materials obtained from land with high biodiversity such as primary forests or highly biodiverse grasslands.

The revised Fuel Quality Directive (FQD), adopted at the same time as the RED, includes identical sustainability criteria and targets a reduction in lifecycle greenhouse gas emissions from transport fuels consumed in the EU by 6% by 2020.

It is very important to note that actual GHG saving values currently being certified and calculated with RED methodology are exceeding by far both the typical and the default values published in the RED.

The EU produced ethanol reached for example on average 68 % of GHG reduction in 2016.

4) Biofuels have a clear economic value as well.

They help reducing EU oil imports dependency. As regards biodiesel alone, in 2010 its energy share in diesel for road transport was 5% in the EU. This helps greatly to reduce EU dependence on imported crude oil for its energy supply. In France, for instance, more than 98% of oil is imported. This represents almost half of the trade deficit of the country. In producing about 2 million tons of biodiesel each year, France is saving 1.5 billion euros per year.

Regarding bioethanol, in 2014 European renewable ethanol displaced 4.8% of Europe’s petrol volumes, saving €1.5 billion of the EU oil bill. Increased ethanol use, via a shift to E10 fuel, would further strengthen the benefits of ethanol use, and reduce oil use by 50 million barrels, and thereby saving €4bn for the European economy based on 2014 oil prices. The improvement in biofuels production can thus respond to one of the main struggles that EU countries face, by satisfying domestic energy demand.

In addition to the previous point, production of biofuel feedstock crops benefits European farm incomes, assuring long term demand stability at the higher end of price ranges for farmers selling to nearby refineries. It is estimated that the production of crop-based biofuels in the EU generates at least 6.6 billion euros of direct revenue for EU farmers.

Specifically, as explained by the EP in a recent report, “the EU’s biofuels policy supports jobs, especially in rural areas”. It reported that the EU biofuel sector has generated more than 220 000 direct and indirect jobs in the EU biodiesel production chain. Not negligible figures when unemployment is still so high.

It is worth reminding that limiting the contribution of conventional biofuels would represent a real economic damage for farmers and a loss of jobs and wealth for the regions where refineries are present.

THE COMMISSION LATEST PROPOSALS : Get back to facts and confront populism.

EU sourced biofuels cogenerating proteins are to be promoted if the objective is truly to fight climate change while improving food security and job creation.

In spite of the climate and economic benefits of conventional biofuels production, and the lack of negative impacts on the availability of food and feed, the Commission is proposing to halve it markets by limiting its use to a maximum of 3.8% of the total

energy consumption in the EU by 2030. Worth recalling that today the EU has a target of 7% use of biofuels in the transport sector for 2020.

The Commission is thus proposing to scale down the production of conventional biofuels, without any facts or analysis that would support its proposals.

To make it even more unacceptable, the Commission seems to ignore that today the EU is a net importer of biofuels. Well informed decisions to promote balanced and locally sourced biofuels in the EU will mean that for every additional production of locally sourced biofuels, there would be a corresponding decrease in farming biofuels in third countries with uncertain sustainability practices. There will be a decrease in feedstocks produced in third countries to be exported to the EU to produce biofuels and a decrease of feed meals imported into the EU from third countries. Moreover, those third countries could use the freed-up land resources for afforestation and food security purposes.

Amongst the imported feedstock for biofuels, palm oil comes first. As a result of the 2012 Commission’s proposal on “crop-based biofuels”, the EU has been locked into strong levels of increasing imports into Europe.

The one consensus element, arising from all the scientific data, is the negative impact of unsustainable palm oil, especially in the context of deforestation of highly diverse and carbon rich ecosystems contributing to the expansion of palm oil deforestation in Sumatra and Indonesia. Use of palm oil for biodiesel in Europe has grown to over 3 million tonnes per annum, undermining valuable efforts engaged in the food sector to focus on certified palm oil production and fight against the expansion of unsustainable production (world palm oil capacity increased from 45Mtpa to over 60Mtpa in the five year period to 2016, with EU production of palm biodiesel accounting for nearly a fifth of this growth). This issue should be tackled, including via a proper trade coherent action, but the Commission is mute at this respect. RED II should adequately respond to the concerns in the use of palm-oil based biofuels in the EU.

Furthermore, specific provisions in the ILUC (Indirect Land Use Change) Directive has led to the highly questionable choice of imported Used Cooking Oil (UCO) which is generally not a waste outside the EU but instead is used for both feed and fuel, over domestic UCO or rapeseed.

Waste-based fossil fuel is also advantaged in the Commission proposals, over emissions saving biofuels. It should not be included in the obligation to incorporate a minimum share of renewable energy imposed by Member States on fuel suppliers, nor should it be counted in the EU target.

The European Parliament Rapporteur on the Commission proposals, whilst recognizing the advantages of a specific EU target for renewable energy in the transport sector, and

proposing to increase the current 10% to 12%, also dramatically scales down without any valid justification the contribution of conventional biofuels to no more than 3%.

It his high time to get back to facts and confront populist positions that attempt to equate conventional biofuels to hunger and deprivation. On the contrary conventional biofuels are a source of job creation and increased incomes, improving food security.

If “accepted wisdom” is little more than baseless opinion, it should be confronted without hesitation. The last thing one expects from the European Institutions is that they cave-in to widespread false beliefs. They should be in the front line to confront them.

The debate on the current Commission proposals should make it more ambitious the targets for the use of renewable energy in transport.

In addition to that the sustainability criteria for feedstock originating biofuels should

promote those that deliver protein feed, replacing imports of grains, and freeing- up land in third countries for food and feed production or environmental improvement, on top of their emissions savings.

That would benefit the environment, create jobs and growth, diminish EU dependency on imports of protein feed and oil, and improve food security overall.