October 2017. The fact that agriculture is a provider of non-food products is not new. Agriculture, including animal rearing and forestry, has traditionally been a source of fibres, fuel, construction and other materials like hides and skins. What is new is the scale and the range of products originating in basic agricultural raw materials, creating […]
Our Works
GROWTH - 5 April 2016
Has the Common Agricultural Policy realised its income objective?
An analysis of farm incomes in the European Union in comparison with the United States
Improving the welfare of farmers has always been an important goal of the European agricultural policy. When the Common Agricultural Policy (CAP) was created in 1957, one of its five objectives included in the Treaty of Rome was “to ensure a fair standard of living for the agricultural community, in particular by increasing the individual earnings of persons engaged in agriculture”. [1]
While the initial objectives of the CAP have not officially changed, other dimensions have received increasing attention in the last 25 years, in particular the role of agriculture in achieving environmental sustainability and rural development. [2] Nevertheless, there is a general consensus among agricultural economists and specialists that securing the income of European farmers has remained the CAP’s most pressing concern. [3] As the European Court of Auditors stated in 2003, “although this is only one of the five objectives of agricultural policy expressly stated in the EC Treaty, the income of the agricultural community runs like a leitmotif through the CAP.” [4]
In order to assess how successful the Common Agricultural Policy has been in achieving this objective, this report will examine the evolution of farm incomes in Europe in comparison with those of farms in the United States.
The European Union and the United States adopt a different approach to support the incomes of their farmers. While the Common Agricultural Policy (CAP) of the EU mainly provides direct payments, the US has terminated this payment system and now focuses on supporting the use of agricultural insurances. The difference becomes clear when looking at the respective weight of these instruments: while the US agricultural policy consists of at least 60% insurance tools and no direct payments, the CAP only involves 1% insurance instruments and 60% income support through direct payments. [5]
However, as there is a severe shortage of harmonised data on farmers’ income levels, particularly for the period prior to the 1990s, it has been difficult for researchers to assess the effectiveness of both policy approaches. This article will therefore evaluate the agricultural policy of the EU and US by examining the evolution of their farm incomes since the 2000s, based on the available official statistics of the Farm Accountancy Data Network (FADN) and the Economic Research Service of the US Department of Agriculture (USDA ERS).
- The general evolution of farm incomes
1.1 Comparing the evolution of farm incomes in the EU and the US
The FADN and USDA ERS statistics are often difficult to compare, as they use a different range of instruments and indicators to collect information about the economic situation of their farms. The statistics are also expressed in different ways: while the FADN data mostly involves averages, the USDA ERS mainly provides information on the total income of farms.
Nevertheless, both databases have one indicator in common that can be used to compare the general agricultural income levels in both parts of the world, namely Farm Net Income (FNI). The FADN database collects data on Average Farm Net Income by correcting Gross Farm Income levels for wages, rents, interests, subsidies, and taxes. [6] The USDA ERS adopts a slightly different approach, as it adds the total revenues from farm sales, government payments, and other farm-related income, and subtracts this by the total amount of farm expenses. [7]
The Average Net Farm Income of the EU can thus be compared with that of the US by dividing the total US Farm Net Income by the number of American farms and expressing it in the same currency (euro) in real terms. Since the FADN database only provides statistics on Average Net Farm Income between 2004 and 2013, it is necessary to limit our comparison to this period. The results are visualised in Graph 1.
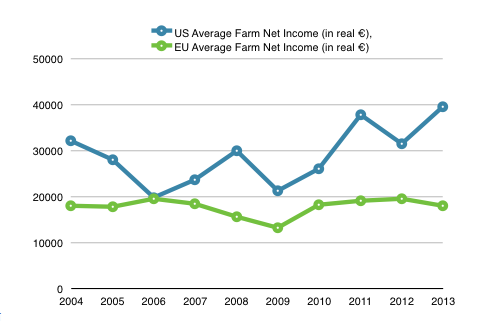
This graph shows that while Average Net Farm Income levels were still similar in both parts of the world in 2006, with €19 586 in the EU and €19 798 in the United States, a different evolution has taken place in the following years. In the United States, average farm incomes rose steadily (with the exception of a downfall in 2009 during the financial crisis) and had doubled by 2013 to €37 750. On the contrary, farm incomes in the EU have stagnated (experiencing a similar drop in 2009), and were even slightly lower in 2013 with an average of €17 903.
It has to be emphasised that a part of the differences in farm incomes can be explained by a divergence in farm structures. While the European Union currently has around 12 million farms with an average size of 15 hectares, the United States only has 2 million farms with an average size of 180 hectares. [8] Put differently, it is estimated that only 37.7% of American farms are smaller than 20 hectares, while this number is 86.3% in Europe. [9] [10] In short, as the average farm size is significantly higher in the United States than in Europe, their average income level also tends to be higher. Nevertheless, the contrast in the evolution of incomes remains striking, as the American agricultural policy has managed to double their incomes in 7 years, while incomes have stagnated in the European Union during the same period.
1.2 The evolution of farm incomes within the EU Member States
Even if farm incomes in the EU as a whole did not increase between 2003 and 2014, the previous figure suggests that they at least remained relatively stable and thus experienced low levels of income volatility. However, the statistics on Average Net Farm Income per member state prove that this broader trend masks the fluctuations and variations at the national level.
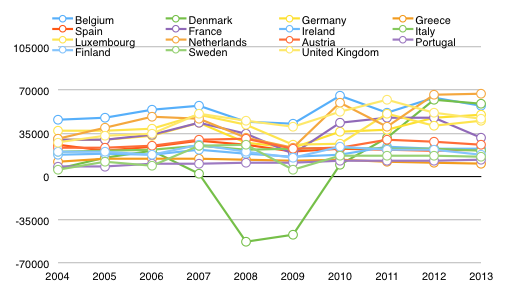
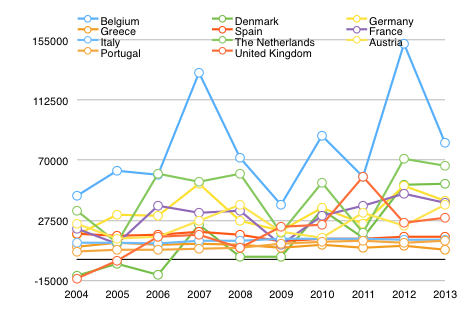
In the ‘old’ EU-15, Average Net Farm Income only remained relatively stable in 7 countries (Ireland, Italy, Portugal, Austria, Finland, Spain, and Greece), while there were strong income fluctuations in the other countries (the UK, the Netherlands, Belgium, Sweden, Germany, France, Denmark and Luxembourg). The most extreme example of income volatility was in Denmark, where incomes consisted of €6 299 on average in 2004, dropped massively to a negative amount of – €52 705 in 2008, and rose again sharply to €59 011 in 2013 (see Graph 2).
Within this 9 year period, incomes increased significantly in 4 countries (UK, the Netherlands, Denmark and Belgium), rose slightly in 8 countries (Sweden, Germany, France, Luxembourg, Ireland, Italy, Portugal, and Austria), and even decreased in 3 countries (Finland, Spain, and Greece). In 2013, average farm income levels still diverged sharply between €10 487 in Greece and €66 820 in the Netherlands.
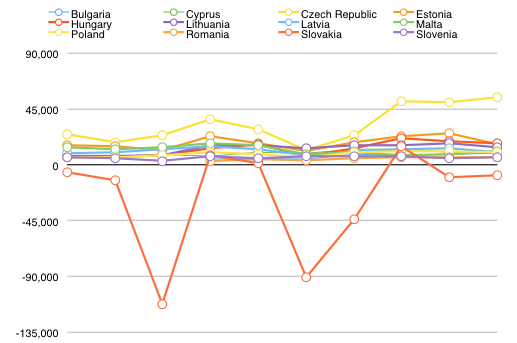
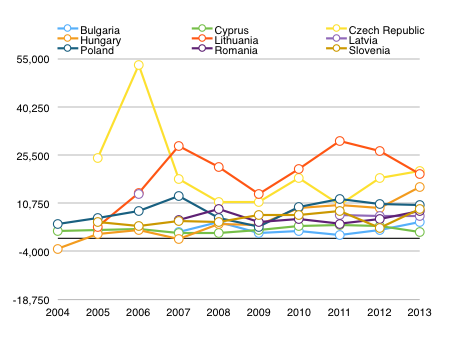
Similar divergences can be seen within the ‘new’ EU-12 member states (see Graph 3). Incomes were highly volatile in 8 countries (Lithuania, Hungary, Czech Republic, Cyprus, Latvia, Estonia, Slovakia, and Malta), while they remained stable in only 4 countries (Romania, Poland, Bulgaria, and Slovenia). The extreme case here is Slovakia, where incomes were mostly negative and reached – €122 033 in 2006 and – €90 365 in 2008, recovering to 15 220 in 2010 before dropping again to – € 8 683 in 2013. Apart from this outlier, farmers in the member states had average incomes of between € 5 771 (in Slovenia) and € 53 979 (in the Czech Republic) in 2013.
Average Net Farm Income levels have increased significantly in 7 countries (Lithuania, Hungary, Czech Republic, Cyprus, Romania, Poland, Bulgaria), risen slightly in 2 countries (Latvia and Estonia) and decreased in 3 countries (Malta Slovenia, and Slovakia) within the investigated period.
In short, the evolution of Average Net Farm Income between 2004 and 2009 has been highly volatile in the majority of the EU countries. Furthermore, incomes have increased strongly in 11 countries, have risen slightly in 10 member states and have even decreased in 6 countries within this timeframe. Significant differences in the economic situation of farmers between EU countries remain, in particular between the ‘old’ and ‘new’ member states.
- The evolution of incomes for different agricultural sectors
2.1 Comparing the evolution of incomes per agricultural sector in the EU and the US
Assessing and comparing the evolution of farm incomes in specific agricultural sectors is fraught with even more difficulties, as the US does not provide statistics on Net Farm Income per sector and uses different categories of commodities to those used in the EU. Therefore, the economic situation of the various American agricultural sectors will be assessed by analysing their average Net Cash Farm Income (NCFI).
The difference from Net Farm Income is that Net Cash Farm Income only includes cash revenues and expenses of farmers, while it excludes several relevant aspects such as inventory changes and and the costs of wages, rents, and interests. [11] As such, this indicator is not entirely comparable with Net Farm Income, but it nevertheless remains the most useful indicator for our comparison.
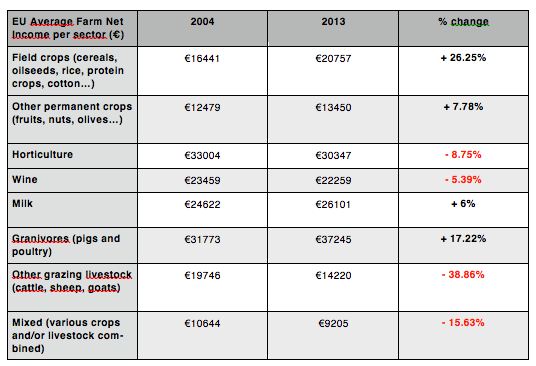
Graph 4 presents the evolution of Average Net Farm Income in Europe for different agricultural sectors. They reveal that income levels have remained relatively stable for producers of some commodities (horticulture, permanent crops, cattle, sheep and goats, and mixed sectors), while other sectors have experienced high levels of income volatility (field crops, pigs and poultry, milk, and wine).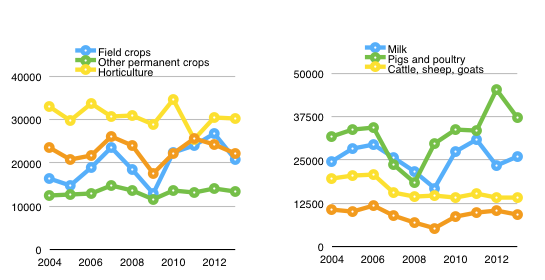
Additionally, Table 1 shows that farms in half of the categories saw their incomes decline since 2004, namely in the wine; horticulture; cattle, sheep and goats; and mixed agricultural sectors. Average Net Farm Income has increased only slightly in the milk and permanent crop sectors, while it has risen significantly for field crops, pigs, and poultry.
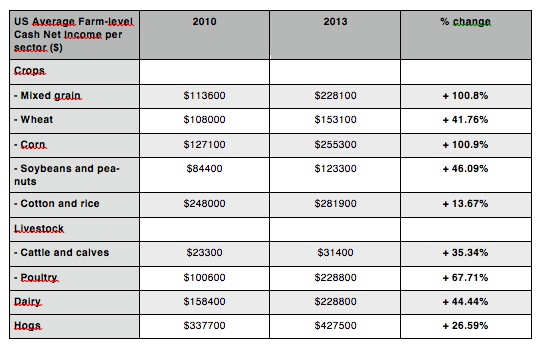
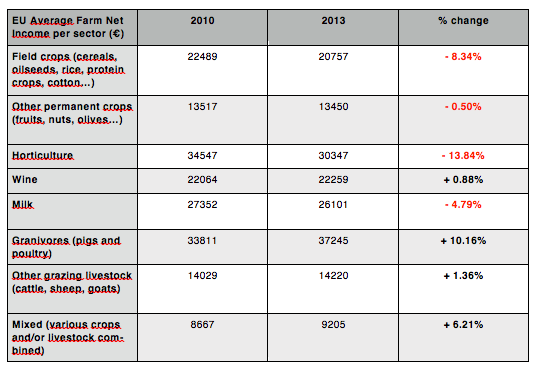
Unfortunately, the statistics of the USDA ERS on Net Farm Cash Income per sector are limited to the period 2010-2013. Nevertheless, the data shows a clear pattern: incomes have risen significantly for all agricultural sectors, especially for mixed grain and corn, whose revenues more than doubled in three years time (see Graph 5 and Table 2). If we look at the same period for the FADN data, it is clear that farm incomes in the EU have only increased slightly for wine, livestock and mixed agricultural producers, while they have even decreased for the field crops, permanent crops, horticulture, and milk sectors (see Table 3).
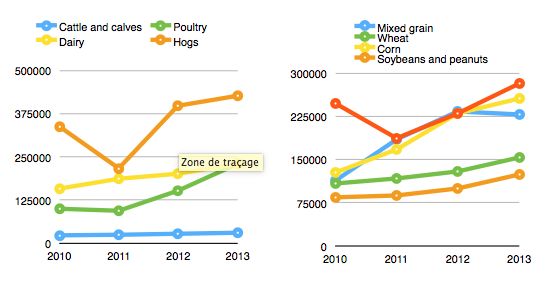
In short, half of the specific agricultural sectors in the EU were confronted with significant volatility and half of them saw their incomes decline over a period of 9 years.
Meanwhile, the United States has managed to significantly increase the agriculture average Farm net income and, during a 3-year period (2010-2013), to increase the incomes for all agricultural sectors, while the EU faced stagnation and decline for all of sectors except pigs and poultry.
2.2 The evolution of farm incomes within the EU Member States: the example of ‘other permanent crops’
Even where the general evolution of income levels gives the impression that the revenues in some sectors have been rather stable throughout the years, these figures hide diverging evolutions at the national level. For instance, if we focus on the category “other permanent crops” (which covers among others fruits, nuts and olives) the more or less straight line in Graph x is misleading as it hides the variations at the national level (Graph 6 and 7).
Within the traditional EU-15 Member States, the ‘other permanent crops’ sectors have only experienced a pattern of relatively stable incomes in 4 countries (Greece, Spain, Italy, and Portugal), while there were strong fluctuations in 7 countries (Belgium, Denmark, Germany, France, the Netherlands, Austria and the United Kingdom). Furthermore, Denmark and the UK experienced periods of negative average income levels, respectively in 2004-2006 and 2004-2005.
Graph 6: Average Farm Net Income in the EU-15 countries for ‘other permanent crops’
The situation has been even worse within the EU-12, as all of the countries producing ‘other permanent crops’ were confronted with strong income fluctuations in this sector. In Hungary, the average income levels were even negative in 2004 and 2007. The income drop in the Czech Republic has been particularly striking, as it fell from €53 156 in 2006 to €20 554 in 2013.
In 4 EU member states (Austria, the Czech Republic, Latvia, and Spain), the economic situation of these particular sectors has worsened between 2004 and 2013, while it improved slightly in 4 (Greece, Italy, Romania and Slovenia) and significantly in 11 countries (Belgium, Bulgaria, Denmark, Germany, France, Hungary, Lithuania, the Netherlands, Poland, Portugal, the United Kingdom).
- Conclusion
The analysis of the statistics provided by the FADN and the USDA ERS enables us to evaluate whether the Common Agricultural Policy has achieved its main objective of increasing the earnings of European farmers.
Firstly, the data on Net Farm Income levels showed that after 2006, when farm incomes were still on the same level in both parts of the world, the United States has managed to double its incomes by 2013, while the European Union experienced stagnation and even a slight decrease during the same period. Furthermore, while these general figures suggested that incomes have been relatively stable in the EU, this masks the fact that farm incomes were highly volatile in the majority of the member states.
Secondly, a focus on the different agricultural sectors revealed that the income of EU producers has dropped since 2004 for half of the commodity categories and that almost all the EU agricultural sectors have experienced a stagnation or decrease since 2010. In contrast, between 2010 and 2013, the United States managed to raise the incomes of all their agricultural sectors significantly. The evolution of the sectoral incomes within the EU member states also exposed that most of the agricultural sectors in Europe have been affected by high fluctuations in revenues.
As such, the statistics suggest that the incomes of European farmers have not improved since 2004, despite the fall in the number of farmers and some on-going restructuration of the EU agri-sectors, and that they were not shielded from volatility.
The difference in the patterns between incomes in the EU and the US should lead us to question the effectiveness of the agricultural policies put in place on both sides on three essential elements:
– the creation of a positive environment for the competitiveness of agricultural businesses, encouraging investment in productivity and sustainability;
– the opening of new markets, both for exports and in the domestic context, for each sector, notably via commercial leverage, innovation, and regulation;
– the capacity of the agricultural sector to be effectively armed at the sectoral level and at farm-level in order to continue to grow on volatile markets.
In other words, this data raises the question of the effectiveness of the CAP as it is today and as it has evolved since the start of the early 2000s. In view of the challenges of sustainable growth and competitiveness, the EU must provide the means to the European agri-food sector to regain its unequivocal dynamism.
References
European Commission, http://europa.eu/rapid/press-release_MEMO-13-631_en.htm.
European Commission, http://ec.europa.eu/eurostat/statistics-explained/index.php/File:Agricultural_holdings,_by_size_of_holding,_by_country,_2013.png.
European Parliament, Comparison of Farmers’ Incomes in the EU Member States, 2015.
FADN, http://ec.europa.eu/agriculture/rica/database/database_en.cfm.
Hill, B. Farm Incomes, Wealth and Agricultural Policy: Filling the CAP’s Core Information Gap, 2012.
Newton, D. ‘Small Acreage Farming in the United States’, USDA ERS Economic Information Bulletin, 2014.
OECD, Evaluation of Agricultural Policy Reforms in the European Union, 2011.
USDA ERS, http://www.ers.usda.gov/data-products/farm-income-and-wealth-statistics.aspx.
[1] European Parliament, Comparison of Farmers’ Incomes in the EU Member States, 2015, p. 11.
[2] OECD, Evaluation of Agricultural Policy Reforms in the European Union, 2011, p. 22.
[3] Ibid., p. 142.
[4] B. Hill, Farm Incomes, Wealth and Agricultural Policy: Filling the CAP’s Core Information Gap, 2012, p. 20.
[5] Ibid., pp. 13-14.
[6] FADN, http://ec.europa.eu/agriculture/rica/database/database_en.cfm.
[7] USDA ERS, http://www.ers.usda.gov/data-products/farm-income-and-wealth-statistics.aspx.
[8] European Commission, http://europa.eu/rapid/press-release_MEMO-13-631_en.htm.
[9] European Commission, http://ec.europa.eu/eurostat/statistics-explained/index.php/File:Agricultural_holdings,_by_size_of_holding,_by_country,_2013.png.
[10] D. Newton, ‘Small Acreage Farming in the United States’, USDA ERS Economic Information Bulletin, 2014, p. 3.
[11] USDA ERS, http://www.ers.usda.gov/data-products/farm-income-and-wealth-statistics/update-and-revision-history/faqs.aspx.