For a new deal in the EU food chain

Context

Agriculture and agri-food constitute, together, one of the European Union’s main economic strengths. With a total turnover of €1 350 billion per year and 14 million jobs, agriculture and agri-food are not only one of Europe’s leading business sectors, but also one of its principal sources of employment. It is second only to the metal industry and accounts for 16% of total European industrial turnover

  • The agricultural sector has an annual turnover of €394 billion, is made up of 12 million agricultural holdings and provides full-time employment to 10 million people.
  • The agricultural base in Europe is the mainstay and lifeblood for 310 000 agri-food businesses (99% of which are Small and Medium Enterprises), which generate an annual turnover of €956,2 billion and sustain 4,1 million direct jobs in Europe. 3 000 of these agri-food businesses generate 50 % of the total turnover.
  • Regarding the distribution of food products, it needs to be underlined that beyond the large number of small distribution enterprises in each of the EU Member States, 5 distribution groups represent between 43% and 69% of national sales, depending on the specific country.
  • An additional element of on-going evolutions in the food chain lies in the significant development of away-from-home catering during the past two decades, which increased the weight of the “distribution” pole in the chain, notably through centralised global purchasing. However, it can also represent an element of balance in cases of local supply and food services, although this occurs a lot less frequently.

Challenges

While the distribution of the margins in the food chain has been generally maintained between farmers, processors and distributors, increased price volatility since 2007 has fundamentally changed the rules of the game, due to the impact of harsh global price movements on the different actors in the food chain.

  • During periods of falling prices, farmers represent the main shock absorber for the entire industry and see their margins shrink rapidly, which undermines their already fragile economic balances.
  • Price declines are rarely passed on to consumers in the EU market, except in the cases of highly perishable products such as fresh fruits and vegetables. The couple processors and distributors thus benefits from a minimal shock absorbing effect, and can even benefit from some improvement of the margins for processed products on the EU market.
  • When prices are rising, the ability of farmers to benefit from these surges depends on the nature of their agricultural products, and more precisely on whether they can be sold directly on the market or not. As such, when agricultural products need a stage of processing (f.e. sugar) or processing and packaging before they can be sold on the markets (f.e. milk), the capacity of farms to pass these price increases upwards in the food chain seems limited, or involves long periods of delay. The distribution sector prioritises defending the interests of consumers and blocks any movement in this regard, despite the factors mentioned in the previous paragraph.

In other words, in a context of upwards fragmentation of the agricultural sector and a limited and very partial access for farmers to relevant information on market trends and the value of products, the three pillars of the food chain do not act collectively:

  • The distribution one builds on general competition rules to prioritise the protection of consumers. There is no (or only little) transmission of price increases, and there are large time delays when there is so. However, transmission of price decreases to consumers are as well very limited.
  • The processing sector defends its margins and market share in an environment of competition and bargaining power deficits towards the downstream sectors (2nd processors and distributors)
  • Farmers: the final link of the chain, for which the legal provisions exempting them from general competitions rules are not fully enforced. As such, the farmer has become the main shock absorber in case of price drops. This disadvantage is coupled to a slowness in benefitting from price increases, especially for products that can only be consumed after processing or packaging.

Analysis

Thus, taking into account the globalisation of markets and the need for a renewed competitiveness of the European agri-food sector, policymakers need to make it an ambition to foster the responsible, competitive and sustainable growth of this economic sector at the heart of European policies.

Research underlines that the growth and competitiveness of the processing food sector is correlated to the growth of the related agricultural sector. There is proof that short term strategies aiming at increasing the profits of one part of the chain are detrimental for sure for the viability of the other part but as well on a longer term for the viability of both parts of the chain agriculture and processing sector.

The general framework for competition in the EU, concerning agreements between undertakings, is based on TFEU Article 101, which prohibits “as incompatible with the common market all agreements which may affect trade between Member States and which have as their objective or effect the prevention, restriction or distortion of competition within the internal market.”

Article 42 establishes that “the provisions of the Chapter relating to rules on competition (including the aforementioned Article 101 TFEU) shall apply to production and trade in agricultural products only to the extent determined by the European Parliament and the Council and within the framework of Article 43.2” which calls upon the EP and the Council to establish the common organisation of agricultural markets in order to achieve the objectives of the CAP.

If competition law would have applied by principle to the agricultural sector, Article 101 would have been sufficient and Article 42 would not have been necessary. By consequence, under the TFUE, competition law would apply only by exception to the agricultural sector.

At the same time, Article 39 TFEU establishes the goals of the Common Agricultural Policy, which are “to increase agricultural productivity, to ensure a fair standard of living for the agricultural community, to stabilise markets, to assure the availability of supplies, and to ensure that supplies reach consumers at reasonable prices”.

According to the Court of Justice – judgment in Maizena, 139/79, paragraph 39 – Article 39 recognises the precedence of the objectives of the Common Agricultural Policy over the aims of the Treaty in relation to competition.

It has to be noted that there is one exemption for all sectors: agreements reached between independent producers on quantities and sales can be exempted from competition rules under the general provision of Article 101.3 of the TFUE. Such kind of agreements need to be indispensable to create efficiencies (e.g. in terms of the distribution of the product), they should not eliminate competition and these agreements need to allow consumers a fair share of the resulting benefits. So, specialisation agreements can be exempted according to the so–called Specialisation Block Exemption Regulation (SBER) – Article 2 Regulation 1218/2010.

These Treaty provisions have been implemented through the CMO Regulation 1308 of 2013.

Under the CMO Regulation, we can differentiate two kinds of derogations to the general competition rules :

  • Derogations applied to severe market imbalances (Article 222). During this period, the Commission may adopt implementing acts to the effect that Article 101.1 TFEU is not to be applied to agreements and decisions to recognised interbranch organisations, provided that such agreements and decisions do not undermine the proper functioning of the internal market, strictly aim to stabilise the concerned sector and fall under one or more of the following categories:

a) market withdrawal for free distribution,

b) processing,

c) storage by private operators,

d) joint promotion measures,

e) agreements on quality requirements,

f) joint purchasing of inputs,

g) temporary planning of production. This article establishes severe conditions in terms of substance, geographical scope, and time.

Derogations applied to any market situation, which can be general or specific, are laid out in Articles 206 to 218, which foresee different degrees of product specific derogations for the dairy, ham, fruits and vegetables, beef and veal, pig, olive, wine, sugar, cereal and arable crops sectors.

It is crystal clear that the legal framework is complex to understand and complex to implement, with many particular provisions and case-by-case solutions. In some cases it has not been applied, so there is no legal certainty as to know what can be done, such as for the Delegated Act of the 2016 Milk Package.

It is also worth mentioning that there is a sort of ambiguous reading of both the TFEU and the CMO Regulation. While in the TFEU the rule is that competition principles are not applied to agriculture, in the CMO Regulation the rule is the application, with explicit derogations.

In terms of collective bargaining, there is a case pending at the European Court of Justice concerning the French producers of endives, that was promoted after a resolution of the French competition authority and will shed light on the issue (in 2018?).

This brings us to another point, which is the role of national competition authorities. In many cases, there are no common criteria in their resolutions and they differ so much that they make the scenario even worse.

In general terms, the CMO Regulation has brought more market orientation for the CAP. Some sector have or are going to dismantle quotas and other traditional mechanisms that make the negative effects of volatility, market crisis and the asymmetric bargaining power of the different actors of the chain more obvious.

If we do not want to fuel those market disturbances, we need to explore a new and clear set of rules to adjust and rebalance the relationship between producers and buyers, especially in order to avoid abuses of dominant positions.

Take the case of sugar, for example. Today, the CMO allows for interbranch agreements, including price repartition between growers and factories, at a national level. From October 2017, this relationship will be allowed between the sellers and a sugar company.

Sugar beet is a perishable, barely transportable and non-storable product whose production implies important and specific investments. On even more volatile markets, it happens that there is a need to negotiate the delivering conditions, including the price, in a balanced way and in advance. This is the reason why a delegated act (2016/1166) has been issued to authorise collective price negotiation at a company level (and not at a national level). This authorisation is not an obligation, and may not happen in Member States where sugar undertakings refuse it.

Similar situations can be found in other sectors, like milk, meat and horticulture, where production is as perishable as sugar beets. The milk sector itself, despite the milk package and related decisions entailed in the last CAP reform, seems not to have overcome the challenges of balanced negotiation powers within the sector.

The point is how we can overcome these challenges? At the same time, we are facing a lack of valid rules and clarity and new market conditions that can alter competition – while the original objective is to protect it.

Do we need common rules applied horizontally to all sectors in certain conditions (particularly concerning perishable, barely transportable and non-storable products), or specific ones depending on the sector involved?

What lessons can be learnt from the implementation of the milk package and its mixed success and from past sectorial legislation (sugar, olive, fruits and vegetables) both in terms of fair competition and increased balanced competitiveness?

What is the room for manoeuvre that we have under the existing legislation, and what are the changes to be made?

Recommendations for regulatory actions at the EU level

  • Reaffirm the primacy of the CAP on EU competition law, with a uniform and compulsory application by all national competition authorities.
  • Transparency of the markets:
    1. Improve the quality of the data that is collected, so that all stakeholders have a clear overview of the markets and their evolution. As such, compulsory collections need to be carried out by all Member Status, not only on the prices and volumes for regular farm output, but also on prices and volumes for the first processing industries and the following links of the food chain, all the way up to the prices on consumer markets. These price collections should be undertaken regularly and with a sufficient frequency, and need to be refined according to the type of markets and products.
    2. Quality of the data: the frequency of data collection must not be higher than today, aiming at collection on a weekly basis? Outdated statistics are irrelevant. Their provision to economic actors in the sector should also be undertaken within tight time frameworks. On rapidly evolving markets, data on periods of 2, 3 or 6 months hardly have any value other than historical information.
    3. In parallel, regular prospective analyses (on a monthly basis) should be developed with the economic actors and the European Commission, on a sector-by-sector basis, in order to provide and distribute dynamic analyses on the likely short-term market developments.
  • Contractualisation:
    1. Currently, the CAP gives Member States the possibility to make contracts compulsory between agricultural producers and their first buyers. Yet few Member States have made use of this provision up to now, even if all analyses underline the weak capacity of farmers to request a contract within the current regulatory framework.
    2. Henceforth, it would be appropriate to foresee having a contract as a right for farmers, thus enabling them to require a contract dealing with the volume and price components, without the buyer being able to refuse it.
    3. Collective bargaining:
      • Collective bargaining by Producer Organisations or Associations of Producer organisations on behalf of their member farmers must be authorised and not seen as a cartel, which is the case today in certain Member States.
      • In this context, the limits on a dominant position should be determined at the European level, but also adjusted to the relevant markets. These markets are regional, national or European, depending on the products. It seems, in the light of the evolution of consumer markets and the concentration of the processing and distribution sectors, that the relevant markets in this regard are becoming more and more European. It cannot be accepted anymore that the relevant market is almost always quasi-automatically considered to be the national one, at best, by the competition authorities. A provision should be included in the Community legislation for the agricultural sectors, stating that the relevant market is in principle the European market, except if it can be demonstrated otherwise by the national competition authorities.
    4. Maintaining the authorisation of cartels for a given time period, as provided in the current CAP, to deal with events of crisis.
  • Negotiations of volumes and prices:
  1. A key problem with the distribution of the added value in the food chain lies in the management of large and rapid price declines and the transmission of price increases.
  2. Balanced contractual relationships between farmers and processors should be encouraged.
  3. This involves providing an explicit authorisation for negotiations in each sector on the distribution of added value in rising prices and on sharing the burdens in case of falling prices, which is to be defined at a consistent level and should at least take into account the experiences with these decisions for the beet and sugar industry.
  • Unfair trading practices: effectively articulate regulatory requirements and guidelines for good practices.

The actions undertaken in Finland, England and Spain tend to demonstrate that the proper functioning of guidelines for good practices presupposes a binding basic regulatory framework. It is therefore necessary to provide:

  1. A basic regulation at the EU level, which explicitly provides a list of prohibited practices and makes it obligatory that dissuasive sanctions should be applied (in and by the Member States)
  2. The ability, at Member State level, for complainants to do so collectively and while maintaining the confidentiality of the complainant’s identity.

Recommandations: How to improve the resilience of the EU agriculture

  • Agriculture will be faced in the future with growing climate and market volatility. Risk management tools will therfore be necessary to achieve the resilience of the large range of EU agriculture models ;
  • This will not be obtained through a single tool at European level, but through a choice of complementary tools, most of them defined at EU level, the Member States, each sector and industry then being able to enforce at there own level ;
  • Some of these tools already exist in the present EU legislation, others will have to be defined and decided in the future CAP reform ;
  • In each Member State involved in such a scheme, farmers should be free to opt for one or several of these tools according to their specific situation ;
  • The center of the scheme stands in the crop yield insurance (weather) system. This system already partly exists in the present EU legislation and has been tested by certain Member States.
  • The analysis and quantitative forecasts show that crop yield insurance (weather) is realistic, easy to inforce in the whole range of arable crops, pastures and vineyards, and can easily be financed inside the present CAP. This could be a first objective as soon as 2018 with the system being tested on a larger scale, before taking formal decisions for the next CAP reform.
    • In this scope, the 30% excess and streshold parameters should be lowered to 20%, which meens steping out of the WTO green box principle. WTO is not a constraint for the EU in that respect. We have margins and notably via our de minimis and/or the amber box of the Marrakech commitments. It is up to the EU to decide to use theses possibilities to build its future.
    • European cofinancing should be increased from 65 % to 80 % to make it enough attractive.
    • 20 % & 80 % = financially workable . Not expensive at all : 4 billons to cover all EU farmers
    • if not insured, no hope of other aids for farmers

The coming omnibus regulation should allow EU to deel with this important question.

On top of this basic insurance system, farmers should be offered complementary options : 

  • A precautionary saving mechanism allowing them to buid up their own individual self-insurance system and benefit at the same time from income tax stabilisation over several years. Such supportive tax policy depend on Member States decision, but should enter a EU framework. The mechanism could benefit from a EU top-up.
  • Collective saving mechanism , as mutual funds, should also be develloped notably in certain sectors by as the dairy industry. The Commission has just proposed to adjust the IST. This proposal is a good move and it is our common responsability to improve it to make this tool effective. In that respect, the tool has to be fully reactive. Mutual funds based on index seems to be promoted if we want this tool to be efficient.

On top of that, to answer to both financial European constraints and effectiveness of the saving mechacinsms be they individual or collective, European cofinancing should happen when savings are done and not when the tool has to be activited.

  • For sectors that may use existing future markets, more extensive studies should be encouraged in the perspective of the future reform of the CAP in order to quantify the costs/benefits/efficiency of revenue, margin or income insurance, which may provide additional resilience tools to farmers. These approaches will have to keep in mind their potential impact on the suppression of the first pillar direct payments, and their compatibility with EU budgetary capacity and rules.
  • All these mechanisms have been developped in two work-shops yersterday. They aim to strengthen both farm and industry resilience to crises, while increasing their ability to invest during favourable periods. The discussions also showed the willingness both to keep a sufficient level of decoupled direct payments and in same the time open such new possibilities for risk managment tools.

2016_1014_GFForum_116_low

2016_1014_GFForum_092_low


The CAP: Where does the future lie?

The 2014 reform has consolidated the ‘public goods’ component of the Common Agricultural Policy. However, the economic reform of this policy, which remains the primary aim of the common European policy, is still to be finalised. Economic reform is a matter of meeting the most pressing societal challenge: sustainability of production, or, in other words, the long term ability of agriculture to meet the needs of the planet and of the responsibility which the EU must assume in this regard.

In responding to this issue, all actors are confronted with a number of challenges:

  • the challenge of sustainable and consistent agricultural and industrial investments
  • the challenge of integrating innovation with efficient technologies
  • the challenge of market volatility, and ensuring that it does not disrupt the sustained growth of production.

In the EU, agricultural productivity has declined for over two decades. Income per unit of agricultural work has stagnated since the mid-90s in the EU-15, despite the restructuring of farms and the decline in the AWU: the efforts made by the agricultural sector seem to be consumed by the constant decrease of public aid (CAP) in real terms and the transfer of value added towards other links in the chain. Today, many sectors find themselves in urgent need of investment, in order to ensure their competitiveness.

A thorough understanding of the inseparability and mutuality of the two components – environmental sustainability on the one hand, and economic sustainability on the other – seems to be the primary condition for ensuring sustainable development and effective public policy. In this context, three key words emerge: Resilience, Sustainability, and Investment. How does the current CAP provide adequate responses in that respect?

In other words, a main question happens to be how the EU can overcome two decades of decline in competitiveness in the Agri-food sector, while answering to citizens’ demands of food security, increased sustainable environment and more growth in the EU?

In that respect, a major problem (to solve) occurs to be the lack of investments in the European agri-food sector and the need to focus more public incentives to productive investments, able to achieve all across the EU what can be either called a double competitiveness (economic and environmental) or a double sustainability.

In the context of the post-Brexit referendum and the current crisis which affect most – if not all – agricultural sectors across the European Union, the Common Agricultural Policy is at a crossroads. Will it goes down the path of a more “à la carte” policy, diverting more and more from a Common policy or will it take up effectively the challenges of investments all across the EU offering real responses to farmers needs and legitimate expectations?

Taking into account the urgent need for a wake-up call when it comes to the European dimension of the European policy, Farm Europe held a one day high-level event on the CAP in Bucharest on the 8th of July 2016, under the patronage of the Romanian government to address the key question : how to overcome the challenges of a Common policy to boost investments and confidence in the future of the agricultural sector? 

The event gathered key political decision-makers of the European Union and high-level representatives of key economic actors, who are willing to recall their ambition for a strong European Policy.  

The discussion focused on the following issues:

  • Investments of competitiveness needed :
  • Should the CAP establish greater means of support for investment? If yes, is there a need for a European plan for competitive investment in the agricultural sector in order to stimulate a technological leap towards precision farming?
  • Which kind of investments would have to be incentivised ? And, in which sectors and which scale of amounts are at stake in the different member states? Which incentives to make them happen in a short-term period ?
  • Efficient investments of sustainability and how to reconcile sustainability and competitiveness which are, truly, two sides of a same coin:
    • Both the greening measures and measures of the 2nd pillar are criticised due to their complexity and/or their questioned efficiency. For the future, could we work on a strategic approach making full use of innovation to respond to the challenge of providing public goods at the European level, allowing economic actors to decide and to mobilise the most appropriate means of achieving this ?
    • Sustainability of our environment, sustainability of our food and sustainability of our rural areas require all the existence of a vibrant farming sector as ground for any action. How can it be achieved all across Europe and notably, how can we address the structural lack of competitiveness of a region or of a specific sector in a particular region ?
  • How to invest in a context of volatile markets and crises, whereas all our world’s competitors have chosen to implement public policies encouraging agricultural productions via strong market management tools, either based on insurance schemes or prices protection ?
    • Confronted with market crises, the new CAP arrangements remain, to this day, rudimental (schemes for income stabilisation in 2nd pillar) or have proved to be ineffective in face of recent crises (emergency measures and markets measures of the single CMO).
    • In this context, and given the new economic environment of increased market volatility and the need for investment, do the tools available to the European farming sector to create a favourable environment for investments require adjustment?
  • Insurance “income loss, margin loss”?
  • Incentives to individual or sectorial (mutual) savings
  • Bank guarantees
  • Public support via the CAP
  • Role of the EIB, commercial banks, and insurance companies

Are futures the future for farmers?

An evaluation of agricultural futures as a risk management tool in the context of price volatility

Agricultural markets have an inherent tendency towards instability. This is mainly because the supply and demand market fundamentals of the agricultural sector are characterised by rigidity, as food is a basic necessity for consumers and agricultural production is seasonal. Producers of agricultural commodities are therefore much more vulnerable to price shocks than other industrial sectors. [1]

 This vulnerability became particularly clear during the fallout of the global financial crisis in 2008, which initiated a period of high variations in the prices of agricultural products. As a result, the issue of price volatility has come to the forefront of public policy attention in recent years. [2]

 This was especially the case within the European Union, where farmers have been gradually exposed to these global price fluctuations due to the increased market orientation of the reformed Common Agricultural Policy. In this context, European policy-makers are considering the need for specific risk management instruments in order to tackle price volatility and/or enable farmers to deal with its negative consequences. [3]

While there are several possible tools to achieve this, such as insurances and specialised financial instruments, prominent attention has recently been given to agricultural futures, which has risen from relative obscurity to become a buzz word and a topic of intense debate in agricultural decision-making circles. [4]

 This report examines the effectiveness of futures in tackling and managing price volatility by firstly explaining how this instrument works in theory, before assessing its potential benefits and shortcomings, and finally giving an overview of the existing practices and regulations in the European Union. 

  1. What are futures, and how do they work?

Futures contracts (or simply ‘futures’) are standardised, binding agreements in which a buyer and a seller agree to trade a specified quantity of an (agricultural) commodity at an agreed price on a given future date.

There are always five standardised elements in these contracts:
1. The type of commodity (for example wheat, corn, meat…)
2. The quantity of the commodity (the number of bushels of grain, pounds of livestock…)
3. The quality of the commodity (using specific grades)
4. The delivery point (the location at which the product should be delivered)
5. The delivery date (the day at which the product should be delivered; there are typically no more than four or five delivery dates per year) [5]

These standards are determined by futures exchanges (or futures markets), which are the public marketplaces where people can buy or sell futures contracts. This differentiates futures from forward contracts, which are private bilateral agreements (‘over-the-counter’) between two parties who can freely decide on the terms of the contract themselves. [6]

These futures markets add a time dimension to the physical market (or ‘spot market’) for agricultural productsNevertheless, a key difference with the physical market is that the contract is traded on futures exchanges, and not the actual product itself. Therefore, futures are derivatives, as the value of the contract is derived from the underlying (agricultural) commodity. [7]

The price of the futures contract is determined through an auction process at the futures exchange, based on the balance between demand and supply for these contracts. Because these futures contracts are continuously traded on the futures exchanges, they pass through many hands, and in the end the contract will have a different buyer (‘short position’) and seller (‘long position’) than the original ones. [8]

The courses of these contracts are monitored on a daily basis, and buyers and sellers pay or receive margins on their future contracts, which are executed by a brokerage firm. [9] When the price of the futures drops, the broker will compensate for this price change by withdrawing the corresponding amount of money from the buyers’ margin account and depositing this amount on the sellers’ margin account. Similarly, when the price of the futures contract rises, the gains will be deposited to the account of the buyer and the seller will lose this money on his account. When the buyer or seller is required to deposit more money on his account to cover the losses on his futures contract, this is known as a margin call[10]

In theory, the price of the futures contract and the price in the physical market (‘spot price’) should converge when the delivery date of the contract is approaching. This occurs through arbitrage: if there is a difference between the price on the futures market and the spot price of the commodities on the cash market, traders will buy and sell in these markets to profit from these differences, which will lead to a convergence in both prices. [11]

On the agreed delivery date (‘at maturity’), the contract expires and needs to be ‘settled’ in two possible ways: by actually delivering the goods or through a form of cash settlement. It is estimated that less than 2% of the futures contracts are eventually settled through physical delivery, in which the seller actually delivers the agreed amount of goods to the seller. In the large majority of the contracts, the seller simply offsets the contract by buying another futures contract, and receives or pays an amount of money for the expired futures contract (this is often done even before the date of expiration). Because the seller buys back the same amount of futures, his selling position is cancelled out and only the price will vary. [12]

Nevertheless, the commitment to deliver the physical commodity remains crucial, as it guarantees that the price of the futures contract will converge towards the ‘real’ price of the commodity (spot price) when the end of the contract approaches. For this reason, the delivery points, i.e. the locations where the products need to be delivered when the futures contract expires, also play a key role. The distance between the physical market and the delivery points of the futures market can require significant transportation and storage costs, and will thus largely dictate the affordability of futures for farmers. Because of these costs, there can be a structural gap between the futures price and the spot price, which is called the base[13]

In general, the quality and success of a futures market is determined by its liquidity, or the frequency at which contracts are traded and the ease at which they can be exchanged. When liquidity is low, there are not enough market participants, it is difficult to exchange futures contracts and neutralise trading positions, and the price of the futures contracts do not reflect the actual price of the underlying product. [14]

The proper functioning of futures markets thus requires a sufficient number of actors, both hedgers who want to protect themselves against price changes and speculators who want to bet on these price changes, as this should guarantee that the prices of futures are a good reflection of the ‘real’ prices of the (agricultural) commodities. [15] On the other hand, if the futures market is illiquid, a small number of actors will be able to manipulate the prices of futures and the use of futures markets will become unattractive. [16]

  1. How can futures be helpful for farmers?

Futures markets perform two key functions which can be helpful for farmers: risk management and price discovery.

In the first place, futures are a risk management tool. Futures contracts give farmers the possibility to ‘lock in’ a certain harvest price for (a part of) their agricultural production, thus excluding the possibility that their selling price will fall in the future. [17] This method is commonly referred to as ‘hedging’. As a result, farmers do not have to cope with price volatility for these commodities anymore, as the risk of price changes is transferred from the farmers to speculators, who are willing to accept this risk in the hopes of making a profit out of it. [18] [19]

Secondly, futures can also be valuable as an instrument for price discovery. As futures markets reflect the price expectations of both buyers and sellers, they allow farmers to estimate the future spot prices for their agricultural products. In the context of unstable agricultural markets, being able to estimate the selling price at the beginning of the production process is especially valuable for farmers. [20]

These hedging and price discovery functions thus enable farmers to fix their prices for the future, reduce their risks, and better plan their production and investment decisions. [21]

  1. An example of how futures contracts work

Imagine a wheat producer has planted a crop in his field in May, when the price on the physical market (‘spot price) for wheat is €4 per bushel. However, the farmer will only be able to harvest and sell this wheat in September, and is not certain which price he will receive for his products at that moment. If the price of wheat rises between May and September, he will have higher earnings, while he will have less profits if the price drops in the coming months.

In order to protect himself against the possibility of a price drop, he can secure the current selling price by selling a number of bushels of wheat in the futures market in May, and buying a futures contract with the same number of bushels back in September, when he will sell his crops on the physical market. This will enable him to plan his investments over a longer term and limit potential losses. [22]

Meanwhile, a bakery may also try to secure a fixed buying price for wheat in order to determine its future production and profits. Therefore, the farmer and the bakery may enter into a futures contract, in which the farmer agrees to deliver 5 000 bushels of wheat to the bakery in September at a price of €4 per bushel. The value of this futures contract will be 20 000 euro (5000 bushels x €4).

In this scenario, the farmer holds the short position (agreeing to sell) while the bakery holds the long position (agreeing to buy). In practice, they can sell their positions for this contract on the futures market at any time, but for reasons of simplicity, we assume in this example that they keep their contract until the expiration date.

By entering into a futures contract, the farmer will receive the price mentioned in the futures contract in September, as any losses on the physical market will be compensated by a gain on the futures market. For instance, let’s assume that when the farmer buys the futures contract in May, the spot and future prices are identical at €4 per bushel of wheat. Because the futures market is assumed to function perfectly, these two prices should also continue to change in the same way.

If in September, the price of wheat has dropped by €1 to €3 per bushel, the farmer will make a loss of €1 per bushel on the sale of his wheat on the cash market. However, the value of his futures contract is now €1 per bushel higher than other futures contracts (€4 compared to €3). Therefore, if he sells his futures contract of €4 per bushel and buys another futures at €3 per bushel, he makes a profit of €1 per bushel. Because the profits on his future position equal his losses on the physical market, his net selling price will still be €4 per bushel. [23] (See Example 1)

Agri futures markets Ex1

Likewise, if the price of wheat rises by €1 to €5 per bushel, the net selling price that the farmer receives would still be €4 per bushel, as the additional €1 per bushel he receives for selling his crops on the physical market are offset by the loss of €1 per bushel on the futures contract. (See Table 2)

Agri futures market Ex2

Notice that in both examples, the gains and losses on the two markets cancel each other out, and the ‘locked in’ price target is achieved: a selling price of €4 per bushel of wheat in September. [24]

Before the expiration date, buyers and sellers are also required to have funds on a brokerage account to cover day-to-day gains or losses on their futures contract. Since the market rates for futures contracts change constantly, the margins are settled on a daily basis. These daily gains and losses from the trade in futures are immediately added to or subtracted from the buyers’ and sellers’ accounts by their broker.

For instance, let’s suppose that the price of futures contracts for wheat increases to €5 per bushel the day after the farmer and the bakery agreed on a futures contract of €4 per bushel. In this case, the farmer loses €1 per bushel, because the futures price is now higher than the future price at which he agreed to sell his wheat. The bakery, on the other hand, has made a profit of €1 per bushel, since he has to pay less than the rest of the market for the futures contract.

On the day of this price change, the farmer will therefore ‘lose’ €5 000 (€1 per bushel x 5 000 bushels) on his account, while the bakery’s account will gain €5 000 (€1 per bushel x 5 000 bushels). Nevertheless, it should be stressed that even if the farmer is making losses on his futures contract, it is likely that he is making gains on the ‘real’ price of his products, which is also expected to be €5 per bushel instead of €4.

This example shows that a futures contract is more a financial position than an actual trade agreement between two parties. For this reason, the farmer and bakery can also sell their positions to two speculators. If we apply the scenario of the daily price change mentioned above, the short speculator (‘seller’) would have lost €5 000 on his account, while the long speculator (‘buyer’) would have gained €5 000.

  1. Risks and shortcomings

4.1 Costs related to the use of futures

Farmers who engage in futures contracts are unfortunately also confronted with a variety of costs. First of all, buyers and sellers of futures are required to act through a brokerage firm to conclude their transactions, and these firms receive commissions and fees for conducting these services. Additionally, farmers have to pay in order to open an account with their broker, and are required to pay margins if their futures contracts experience negative price developments. These margins typically represent between 5% and 10% of the value of the underlying commodity. [25]

Secondly, futures are a complex risk management tool which requires a significant amount of technical know-how of the markets and regular information on daily price changes. However, individual farmers are often not aware of how this instruments functions in practice, and can therefore sometimes make limited use of it. Although they may hire advisors or advisory bodies who can help them with the use of futures by offering training and/or personalised monitoring of their transactions, this represents a considerable investment for farmers in terms of time and money. [26]

Thirdly, while a futures contract may be able to reduce the risk of falling prices for their products, a base risk will always remain: it is possible that the futures price will diverge from the price on the commodity markets, resulting in a lower price for the farmers than the one agreed on in the futures contract. This is a likely outcome if the futures market is not functioning well due to low levels of liquidity. [27]

Overall, it is estimated that these various costs cause the price that farmers receive to vary between 75 and 80% of the actual futures price. As a result, these costs can limit the accessibility and profitability of futures markets for the agricultural sector. [28]

4.2 Excessive speculation on futures can increase prices and price volatility

As outlined above, futures can be an effective instrument to manage price volatility if their exchanges are functioning properly, since they allow producers to hedge against the price risks on their products. However, it needs to be emphasised that this instrument does not reduce price volatility as such. [29]

On the contrary, price volatility is necessary for futures markets to be an effective instrument. If price variations did not occur or were only very limited, futures exchanges would not be attractive for speculators who are searching to make a profit out of these fluctuations, and this would cause futures markets to become illiquid and malfunctioning. [30]

Moreover, speculation on futures can even lead to sudden price risesand more generally to higher levels of price volatility. Indeed, there is evidence that speculation on futures markets can artificially increase the demand for agricultural products, and thus lead to higher prices on the physical markets. In particular, financial speculation on commodity exchanges is seen as one of the main causes for the food price peaks in 2007-2008 and 2010-2011. [31]

In both of these periods, the short-term fluctuations in food prices were too sharp to have been the result of changes in the supply and demand factors for these products. For example, in 2008 wheat prices increased by 46% between January and February, fell back almost completely by May, rose again by more than 20% in June and fell back again from August onwards. Likewise, the price of rice rose by a staggering 165% between April 2007 and April 2008. The magnitude of these price fluctuations is so high that it is likely that they were largely driven by speculation, rather than being the result merely of market factors. [32]

Only speculators are able to make gains out of these extreme levels of price volatility, while they are detrimental for both producers and consumers. Even short-term price increases are unlikely to benefit agricultural producers, because they give misleading signals and wrong information which guide future production decisions. They can also threaten the income of farmers engaging in futures, as their contracts are likely to suffer from substantial costs and losses during price peaks. [33]

  1. Agricultural futures in the European Union

5.1 European futures markets for agricultural commodities

Traditionally, European agricultural markets were highly protected through the guaranteed price system of the original Common Agricultural Policy (CAP). Given that public interventions limited the impact of downward price fluctuations on their incomes, futures contracts were initially not considered as necessary for farmers. [34]

However, the subsequent CAP reforms towards a reduction of market support gradually exposed the European agricultural sector to price variations. Faced with price volatility, farmers became increasingly interested in derivative markets for agricultural products. [35] As a result, a number of futures exchanges were developed in Europe, and futures contracts can now be traded for a variety of agricultural products. [36] [37]

The main European futures exchanges for agricultural commodities are situated in London and Paris. The Intercontinental Exchange Futures Europe (ICE Futures Europe) in London offers futures for wheat, barley, canola, coffee, cocoa, cotton, sugar, and soybeans [38], while the Marché à Terme International de France (MATIF) in Paris trades contracts for wheat, corn, barley, rapeseed, potatoes, and sunflower seeds. [39] In Central and Eastern Europe, the most advanced and liquid exchange is the Budapest Commodity Exchange (BCE), which offers futures for wheat, corn, barley, rapeseed, and sunflower seeds. [40] There are also some smaller futures exchanges, such as the one for olive oil in Jaén (Spain) and the Warsaw Commodities Exchange for wheat (Poland). [41] Moreover, there are plans to create futures markets for other commodities, such as dairy products. [42]

In the past, there have also been a limited number of futures exchanges in which contracts for animal products were traded, in particular for pork. An early example was the Commodity Exchange (‘Warenterminbörse’) in Hanover, which was created in 1998 and had a significant trading volume in the early 2000s, but was closed due to insolvency in 2008. Likewise, contracts on live pigs and piglets were created in Amsterdam in 1980 and 1991, yet these markets disappeared in 2003. [43] A major problem for these exchanges was the lack of market participants: only producers were positioning themselves, while there was limited interest from buyers (slaughterhouses, processors, manufacturers…). [44]

In general, the number of futures contracts traded on European exchanges and the use of futures by farmers has increased steadily in recent years. Nevertheless, the number of trading activities is still significantly lower than in the United States, even for commodities which are largely produced and consumed inside the European Union. European farmers also make less use of commodity futures: it is estimated that between 3% and 10% of them have used this risk management tool, compared to 33% in the United States. [45]

This remarkable difference can be explained by the fact that the US agricultural policy has traditionally focused more on a free market approach, which led American farmers to search for risk management instruments such as futures a lot earlier than their European counterparts. [46] Other reasons for the limited development of futures markets by European farmers include a lack of information and knowledge on futures, the bad image of the instrument due to its association with speculation, and the various costs related to the use of futures (see Chapter 5). [47]

5.2 The suitability of different agricultural sectors for futures

The experience of futures markets in Europe also revealed that not every agricultural commodity is equally suitable for a futures based approach. Because of the nature of futures contracts, it is necessary that the underlying products can be standardised, and not every agricultural sector has the same possibilities to do this.

Futures contracts are considered to be a very appropriate instrument for crops, and grains and oilseeds in particular, since it is relatively straightforward to standardise plant products. This is due to the fact that commodities such as wheat, corn, soybeans, and rapeseed are easy to store and deliver, which also reduces the risk that the quality of the product will fall short of the standards required in the futures contract. The standardisation process is even easier for feed grains, which are seen as the most appropriate commodities for futures contracts. [48]

As a result, ICE Futures Europe in London and MATIF in Paris offer good hedging opportunities for grains, as these markets have a high level of liquidity, have transparent prices which are accepted as European benchmarks, and farmers can easily access these markets through grain merchants or cooperatives. Moreover, efforts have been made to expand these futures markets, as ICE Futures Europe recently added a second delivery point for wheat in Dunkirk to the traditional delivery point in Rouen. [49]

Other plant products also have well-functioning European futures markets. For instance, ICE Futures Europe has a liquid exchange for refined white sugar and all types of cocoa and provides reliable price benchmarks for these products. These markets are liquid because both of these products can be stored for a relatively long period, which enables smooth exchanges and higher trading volumes. [50] Nevertheless, certain crops also suffer from very poor liquidity levels on their European futures markets due to limited trading volumes, such as barley and potatoes[51]

On the other hand, creating standardised contracts poses more difficulties for animal products, due to their specialised nature, differences in species and quality, and the perishability of these products which complicates their storage. As mentioned in the previous section, there are no longer any European futures markets for pigs, as they suffered from very poor liquidity. Futures are also not available for beef products, as the production of multiple breads of beef makes it difficult to standardise these products. The trade volumes for lamb products are also deemed to be insufficient to create a well-functioning futures market. [52]

Likewise, dairy products are so perishable that they require complex storing procedures, which leads to illiquid futures markets with prices unrepresentative of the physical market. In particular, a futures market for milk is likely to have limited liquidity as it is highly vulnerable for spoiling. However, this does not apply to milk powder, which is easier to store and is thus more suitable for futures trading. [53]

In short, the degree to which agricultural products can be standardised is a major determinant for the liquidity, and therefore the success, of their futures exchange markets. Crops, and especially grains and oilseeds, are particularly suitable for a futures approach, while this risk management instrument may have little value for the meat and dairy sectors.

  1. An overview of EU legislation on commodity derivatives

Because of the increase in the trade of (agricultural) commodity contracts and the risks associated with speculation, policy-makers have paid growing attention to the regulation of their derivatives markets. Following the financial crisis of 2008, which was largely caused by problems with these derivatives, the European Union has introduced a variety of legislations to reform and strengthen the European financial markets.

In 2010, a series of reforms were proposed by Michel Barnier, the Commissioner for the Internal Market and Services from 2009 to 2014. This ‘Barnier package’ included the first pieces of EU-legislation regulating the functioning of commodity derivatives markets and the financial actors involved in these markets. [54] This chapter will present a brief overview of these regulations and will explicitly focus on the provisions relevant to futures markets and the aspects related to farming.

6.1 Legislation ensuring the proper functioning of derivatives markets

6.1.1 The MiFID Directive and MiFIR Regulation on markets in financial instruments

The Directive 2014/65/EU on ‘markets in financial instruments’ (MiFID) entered into force in July 2014, but will only be fully applied by January 2018 due to the complexity of its technical implementation details. [55] The MiFID Directive covers three main elements: position limits, trading venues, and speculative trading.

By establishing position limits, MiFID prevents market participants from holding more than a certain number of commodity derivative contracts at the same time. The specific numbers are determined by the national competent authorities and should be in accordance with the rules of the European Securities and Markets Authority (ESMA).

However, these position limits are not applicable if derivatives are traded to hedge against price risks. In practice, this means that financial entities (such as pension funds) have to comply with these limits, while other participants (such as farmers) are normally exempted from this measure. The aim of position limits is to allow prices and settlements to function properly and therefore ensure convergence in the prices for derivatives and commodities. [56]

MiFID also stipulates rules for the trading venues in which commodity derivatives are exchanged, in terms of operational requirements, clearing and settlement services, access to trading, and transparency. Among others, the operators of these venues should be able to distinguish if a trade is performed for reasons of hedging or for speculative purposes, and should publish a weekly report with trading information for their commodity derivatives.[57]

Moreover, the Directive determines the operation conditions for investors, speculators, and speculating entities (banks, investment firms, and hedge funds), in order to avoid disruptive behaviour, manipulation and unfair trade practices. For instance, in order to avoid abusive trading, high frequency trading on extremely small price changes is not allowed. [58]

The MiFID Directive is complemented by Regulation No 600/2014 on ‘markets in financial instruments’ (MiFIR), which entered into force in July 2014 and should also be fully applied by January 2018. MiFIR further regulates trading venues by stipulating that all commodity derivatives traded on exchanges and other regulated markets must be cleared in a non-discriminatory way. Additionally, it requires trading venues and investment firms to continuously publish information on their trading in order enhance the transparency of the market. The MiFIR Regulation also covers commodity derivatives, and includes a definition of agricultural commodity derivatives which includes 20 categories of agricultural products.[59]

6.1.2 The MAR Regulation and CSMAD Directive on market abuse

Regulation (EU) No 596/2014 on ‘market abuse’ (MAR) and Directive 2014/57/EU on criminal sanctions for market abuse (CSMAD) are pieces of legislation against market abuse for derivatives and physical commodities. They entered into force in July 2014, but will only be fully applicable in July 2016. [60] [61]
The MAR and CSMAD legislations originates from a review of the 2003 Market Abuse Directive and its related laws. Their aim is to ensure that all financial markets in the EU apply the same rules for market abuse, which involves ‘insider dealing, unlawful disclosure of inside information, and market manipulation’.

Abuse of inside information occurs if precise information is kept private while it is reasonably expected or legally required to be made public, and if this can have a significant impact on the prices of derivatives or commodities.

Market manipulation in agricultural commodity markets or their derivatives markets is also forbidden: it is not allowed to give false signals about supply, demand or prices; to secure a dominant position on the supply of demand; or to charge an abnormal price for commodities and derivatives. Specific measures includes the prohibition of abusive strategies for algorithm traders strategies and the manipulation of benchmarks for agricultural commodity indexes. [62]

The CSMAD lists the sanctions for these abuses, which are applied by the national competent authorities (in cooperation with ESMA and the financial markets) and can be as high as €5 million and 4 years of imprisonment. [63]

6.2 Legislation covering specific market participants
6.2.1 The AIFMD and UCTIS IV Directives on investment funds

The Directive 2011/61/EU on ’Alternative Investment Fund Managers’ (AIFMD) came into force in July 2011 and was fully implemented in July 2015. The AIFMD legislates the authorisation, operation and behaviour of investment funds (AIFs) and their managers (AIFMs). These investments funds involve hedge funds (including those who trade in commodity derivatives) and private equity funds. [64] [65]

The AIMFD is complemented by the Directive 2014/91/EU on the coordination of laws, regulations and administrative provisions related to ‘undertakings for collective investment in transferable securities’ (UCITS V), which entered into force in September 2014. [66] In practice, a UCITS is also an investment fund, and mostly an exchange traded fund (ETF) or commodity index fund. Among others, UCITS V stipulates that these investment funds cannot buy commodity derivatives with the capital of their investors. They should also be able to fulfil certain risk management requirements and monitor the risks on their positions. [67]

6.2.2 The CRR Regulation and CRD IV Directive on credit institutions and investment firms

The Regulation No 575/2013 on ‘prudential requirements for credit institutions and investment firms’ (CRR) and the Directive 2013/36/EU on ‘access to the activity of credit institutions and the prudential supervision of credit institutions and investment firms’ (CRD IV) were applied in the EU member states from 2014 onwards. However, some provisions of the new banking rules have long transition periods and will only enter into force by 2019. [68]
In general, CRR and CRD IV constitute the legal framework for the authorisation, supervision and rules for credit institutions (banks) and investment firms. Specifically, they regulate how much capital these institutions must hold and which risk management system they must use. These rules cover activities for several derivatives, including futures for (agricultural) commodities. [69]
6.3 Relevance of the legislations for futures markets and agricultural products

The legislations of the ‘Barnier package’ could have some positive consequences for farmers engaging in futures contracts, as some of their general provisions are also applicable to futures markets.

By regulating the behaviour of speculators and restricting speculation through position limits, the MiFID Directive can improve the orderly functioning of futures exchanges and can help to ensure that futures are priced correctly. Together with the MiFIR Regulation, it also regulates the trading venues in which futures are exchanged. By laying down the rules and criminal sanctions for market abuse, the MAR Regulation and CSMAD Directive aim at preventing market manipulation on both the futures and physical markets for agricultural commodities.

Additionally, there are measures targeting specific financial actors who are active on futures exchanges. The AIFMD and UCTIS IV Directives prevent the various investment funds (hedge funds, private equity funds, exchange traded funds, and commodity index funds) from using investors’ money to deal in agricultural commodity futures. Meanwhile, the CRR Regulation and CRD IV Directive cover credit institutions and investment firms, and determine the risk management system they must adapt for trading in commodity futures.

However, the provisions in these EU laws apply mainly to general aspects of futures markets, while specific measures dealing with agricultural commodity futures remain very limited[70] This lack of focus on agriculture can be explained by the fact that the legislation was largely influenced by the financial sector and other commodity producers, while the agricultural sector has hardly been involved in the decision-making process. [71] As the perspectives of EU farmers interested in hedging have not been taken into consideration, only a few of these new provisions protect their particular interests. [72]

Moreover, this complex legislative framework for commodity derivatives will only be fully implemented by January 2018, as important details still need to be settled through technical standards, delegated and implementing acts, and guidelines by the ESMA. The effectiveness of the current legislative framework will thus largely be determined by the implementation decisions on the European and national levels. [73] Due to the unfinished natures of the financial reforms, it cannot be guaranteed that European agricultural futures are already sufficiently protected against excessive speculation and market abuse. [74]

  1. Conclusion

The overview in this article reveals that futures remain a double-edged sword for the agricultural sector. If their exchanges are functioning properly, futures can enable farmers to secure a certain selling price for their products and estimate these prices at the beginning of their production process. This instrument can thus allow them to deal with price volatility risks and better plan their early production and investment decisions.

However, the use of futures also has several compelling disadvantages. The very nature of this instruments prevents farmers from benefitting from positive price developments for their products, as these prices are fixed by the futures contract. Engaging in futures contracts is also a rather expensive undertaking for farmers, as they need to pay commissions and fees to brokerage firms and advisors to manage these complex financial products on their behalf. Moreover, if the futures market are not functioning adequately, it is likely that the futures price will be different to the price on the physical markets, leading farmers to receive a lower price than the one agreed in the futures contract.

Most importantly, futures do not reduce price volatility for agricultural products as such, since fluctuations in prices are a necessary condition for the proper functioning of their exchanges. On the contrary, excessive speculation on futures can lead to artificial short-term price increases and thus even higher levels of price volatility, which is detrimental to both producers and consumers of agricultural products. In short, futures are not an instrument that can reduce price volatility, but remain at best a useful financial tool to manage its negative consequences.

The access for farmers in the European Union to this risk management tool has increased steadily in recent years, in line with the subsequent CAP reforms aiming at a more market-oriented European agricultural sector. A number of futures exchanges have been created and contracts can now be traded for a variety of agricultural products, particularly on the ICE Futures Europe in London and the MATIF in Paris.

Nevertheless, the trading volumes and the number of farmers using futures in Europe remain far more limited than those in the United States. The recent experiences of European futures markets also show that a futures approach is not equally suitable for all agricultural sectors. Exchanges for crops and oilseeds are widely available and rather successful, as these products are relatively easy to standardise and store, while the perishability of meat and dairy puts structural limits on the development of their futures markets.

Because of this growth in the trade of commodity contracts and their problematic role in the economic crisis starting in 2008, the European Union has introduced a number of legislations to better regulate these financial markets. While this ‘Barnier package’ could lead to the better protection of farmers engaging in futures, it only includes very limited specific measures on agricultural commodity futures and is thus not fully adapted to the specific needs of the agricultural sector. Moreover, as some important technical details still have to be settled, this complex legislative framework will only be fully applicable in 2018, which means that farmers are not yet sufficiently protected against excessive speculation and market abuse on agricultural futures markets.  


References

Adenacioglu, H. ‘The Futures Market in Agricultural Products and an Evaluation of the Attitude of Farmers: A Case Study of Cotton Producers in Aydin Province in Turkey’, New Medit, Vol. 10, No. 2, 2011, pp. 58-64.

Budapest Stock Exchange, https://bse.hu/newkibdata/120577480/hat160127.pdf.

CEPS, Price Formation in Commodities Markets: Financialisation and Beyond, 2013.

CME Group, Self-Study Guide to Hedging with Grain and Oilseed Futures and Options, 2015.

De Schutter, O. ‘Food Commodities Speculation and Food Price Crises’, Briefing Note, Vol. 2, 2010, pp. 1-14.

 Dismukes, R. Bird, J. and Linse, F. ‘Risk Management Tools in Europe: Agricultural Insurance, Futures, and Options’, US and EU Food Comparisons, 2004, pp. 28-32.

European Commission, ‘Agricultural commodity derivative markets: the way ahead’, Commission Staff Working Document, 2009, pp. 1-26.

European Commission, Alternative Investmentshttp://ec.europa.eu/finance/investment/alternative_investments/index_en.htm.

European Commission, Commission extends by one year the application date for the MiFID II packagehttp://europa.eu/rapid/press-release_IP-16-265_en.htm?locale=en.

European Commission, Proposals for a Regulation on Market Abuse and for a Directive on Criminal Sanctions for Market Abusehttp://europa.eu/rapid/press-release_MEMO-11-715_fr.htm?locale=EN.

European Commission, UCITS – Undertakings for the collective investment in transferable securities, http://ec.europa.eu/finance/investment/ucits-directive/index_en.htm.

 European Parliament, Financial Instruments and Legal Frameworks of Derivatives Markets in EU Agriculture: Current State of Play and Future Perspectives, 2014.

Ghosh, J. ‘Commodity Speculation and the Food Crisis’, Excessive Speculation in Agricultural Commodities, 2011, pp. 51-56.

Glauben T., Prehn, S., Dannemann, T., Brümmer, B., and Loy, J. ‘Options trading in agricultural futures markets: A reasonable instrument of risk hedging, or a driver of agricultural price volatility?’, IAMO Discussion Papers, 2014, pp. 1-3.

ICE, Products – Futures and Optionshttps://www.theice.com/products/Futures-Options/Agriculture.

Kolb, R. and Overdahl, J. Financial Derivatives: Pricing and Risk Management, New Jersey, John Wiley & Sons, 2009.

Loy, J. Relative Forecasting and Hedging Efficiency of Agricultural Futures Markets in the European Union: Evidence for Slaughter Hog Contracts, 2002.

OECD, Managing Risk in Agricultural Policy Assessment and Design, 2011.

MATIF, Commodity Factsheethttp://www.csidata.com/factsheets.php?type=commodity&format=html&exchangeid=91.

Ministry of Agriculture and Trade of the Czech Republic, Information about European Commodity Exchangeshttp://www.mpo.cz/zprava120086.html.

Norton Rose Fulbright, Key things you should know: MAR/CSMADhttp://www.nortonrosefulbright.com/knowledge/publications/117959/key-things-you-should-know-mar-csmad.

Pennings, J. and Egelkraut, T. ‘Research in Agricultural Futures Markets: Integrating the Finance and Marketing Approach’, German Journal of Agricultural Economics, Vol. 52, No. 6, 2003, pp. 300-308.

Prehn, S., Glauben, T., Loy, J., Pies, I., and Matthias, G. ‘The impact of long-only index funds on price discovery and market performance in agricultural futures markets’, IAMO Discussion Papers, 2014, pp. 1-21.

Roussillon-Montfort, M. ‘Les marchés à terme agricoles en Europe et en France’, Notes et Études Économiques, No. 30, 2008, pp. 99-124.

Report on the High Level Group on Milk, 2010.

Tangermann, S. ‘Risk Management in Agriculture and the Future of the EU’s Common Agricultural Policy’, ICTDS Issue Paper, No. 34, 2011, pp. 1-41.

[1] M. Roussillon-Montfort, ‘Les marchés à terme agricoles en Europe et en France’, Notes et Études Économiques, No. 30, 2008, p. 101.

[2] European Parliament, Financial Instruments and Legal Frameworks of Derivatives Markets in EU Agriculture: Current State of Play and Future Perspectives, 2014, p. 20.

[3] R. Dismukes, J. Bird and F. Linse, ‘Risk Management Tools in Europe: Agricultural Insurance, Futures, and Options’, US and EU Food Comparisons, 2004, p. 28.

[4] H. Adenacioglu, ‘The Futures Market in Agricultural Products and an Evaluation of the Attitude of Farmers: A Case Study of Cotton Producers in Aydin Province in Turkey’, New Medit, Vol. 10, No. 2, 2011, p. 58.

[5] CEPS, Price Formation in Commodities Markets: Financialisation and Beyond, 2013, p. 30.

[6] European Commission, ‘Agricultural commodity derivative markets: the way ahead’, Commission Staff Working Document, 2009, p. 23.

[7] Roussillon-Montfort, op.cit., p. 104.

[8] European Commission, op.cit., p. 23.

[9] R. Kolb and J. Overdahl, Financial Derivatives: Pricing and Risk Management, New Jersey, John Wiley & Sons, 2009, p. 126.

[10] CME Group, Self-Study Guide to Hedging with Grain and Oilseed Futures and Options, 2015, p. 6.

[11] European Parliament, op.cit., pp. 22-23.

[12] CEPS, op.cit., p. 32.

[13] Roussillon-Montfort, op.cit., pp. 106-107.

[14] Ibid., p. 104.

[15] J. Pennings and T. Egelkraut, ‘Research in Agricultural Futures Markets: Integrating the Finance and Marketing Approach’, German Journal of Agricultural Economics, Vol. 52, No. 6, 2003, p. 304.

[16] Roussillon-Montfort, op.cit., p. 104.

[17] S. Prehn et al., ‘The impact of long-only index funds on price discovery and market performance in agricultural futures markets’, IAMO Discussion Papers, 2014, p. 7.

[18] European Parliament, op.cit., p. 19.

[19] T. Glauben, ‘Options trading in agricultural futures markets: A reasonable instrument of risk hedging, or a driver of agricultural price volatility?’, IAMO Discussion Papers, 2014, pp. 1-2.

[20] CEPS, op.cit., p. 30.

[21] J. Loy, Relative Forecasting and Hedging Efficiency of Agricultural Futures Markets in the European Union: Evidence for Slaughter Hog Contracts, 2002, p. 5.

[22] CEPS, loc.cit.

[23] CME Group, op.cit., p. 9.

[24] Ibid., p. 10.

[25] Roussillon-Montfort, op.cit., p. 114.

[26] Ibid., pp. 114-116.

[27] Ibid., p.116.

[28] European Parliament, op.cit., p. 24.

[29] Report of the High Level Group on Milk, 2010, p. 18.

[30] Ibid., p. 19.

[31] Prehn, op.cit., p. 17.

[32] O. De Schutter, ‘Food Commodities Speculation and Food Price Crises’, Briefing Note, Vol. 2, 2010, p. 3.

[33] J. Ghosh, ‘Commodity Speculation and the Food Crisis’, Excessive Speculation in Agricultural Commodities, 2011, p. 54.

[34] OECD, Managing Risk in Agricultural Policy Assessment and Design, 2011, p. 33.

[35] S.Tangermann, ‘Risk Management in Agriculture and the Future of the EU’s Common Agricultural Policy’, ICTDS Issue Paper, No. 34, 2011, pp. 5-6.

[36] Roussillon-Montfort, op.cit., p. 115.

[37] Dismukes, op.cit., p. 29.

[38] ICE, Products – Futures and Optionshttps://www.theice.com/products/Futures-Options/Agriculture.

[39] MATIF, Commodity Factsheethttp://www.csidata.com/factsheets.php?type=commodity&format=html&exchangeid=91.

[40] Budapest Stock Exchange, https://bse.hu/newkibdata/120577480/hat160127.pdf.

[41] Ministry of Agriculture and Trade of the Czech Republic, Information about European Commodity Exchangeshttp://www.mpo.cz/zprava120086.html.

[42] European Commission, op.cit., p. 4.

[43] Roussillon-Montfort, op.cit., p. 114.

[44] Ibid., p. 121.

[45] European Parliament, op.cit., p. 22.

[46] Dismukes, op.cit., p. 31.

[47] European Parliament, op.cit., p. 19.

[48] Roussillon-Montfort, op.cit., p. 113.

[49] CEPS, op.cit., p. 191.

[50] Ibid., p. 246.

[51] Ibid., p. 261.

[52] Roussillon-Montfort, op.cit., p. 113.

[53] Report of the High Level Group on Milk, op.cit., p. 19.

[54] European Parliament, op.cit., p. 39.

[55] European Commission, Commission extends by one year the application date for the MiFID II packagehttp://europa.eu/rapid/press-release_IP-16-265_en.htm?locale=en.

[56] European Parliament, op.cit., p. 45.

[57] Ibid., p. 46.

[58] Ibid., p. 47.

[59] Ibid., p. 48.

[60] European Commission, Proposals for a Regulation on Market Abuse and for a Directive on Criminal Sanctions for Market Abusehttp://europa.eu/rapid/press-release_MEMO-11-715_fr.htm?locale=EN.

[61] Norton Rose Fulbright, Key things you should know: MAR/CSMADhttp://www.nortonrosefulbright.com/knowledge/publications/117959/key-things-you-should-know-mar-csmad.

[62] European Parliament, op.cit., p. 52.

[63] Ibid., p. 53.

[64] European Commission, Alternative Investmentshttp://ec.europa.eu/finance/investment/alternative_investments/index_en.htm.

[65] European Parliament, op.cit, pp. 53-54.

[66] European Commission, UCITS – Undertakings for the collective investment in transferable securities, http://ec.europa.eu/finance/investment/ucits-directive/index_en.htm.

[67] Ibid., pp. 56-57.

[68] Ibid., p. 54.

[69] Ibid., p. 55.

[70] Ibid., p. 67.

[71] Ibid., p. 89.

[72] Ibid., p. 14.

[73] Ibid., p. 88.

[74] Ibid., p. 69.

Has the Common Agricultural Policy realised its income objective?

An analysis of farm incomes in the European Union in comparison with the United States

Improving the welfare of farmers has always been an important goal of the European agricultural policy. When the Common Agricultural Policy (CAP) was created in 1957, one of its five objectives included in the Treaty of Rome was to ensure a fair standard of living for the agricultural community, in particular by increasing the individual earnings of persons engaged in agriculture. [1]

While the initial objectives of the CAP have not officially changed, other dimensions have received increasing attention in the last 25 years, in particular the role of agriculture in achieving environmental sustainability and rural development. [2] Nevertheless, there is a general consensus among agricultural economists and specialists that securing the income of European farmers has remained the CAPs most pressing concern. [3] As the European Court of Auditors stated in 2003, although this is only one of the five objectives of agricultural policy expressly stated in the EC Treaty, the income of the agricultural community runs like a leitmotif through the CAP. [4]

In order to assess how successful the Common Agricultural Policy has been in achieving this objective, this report will examine the evolution of farm incomes in Europe in comparison with those of farms in the United States.

The European Union and the United States adopt a different approach to support the incomes of their farmers. While the Common Agricultural Policy (CAP) of the EU mainly provides direct payments, the US has terminated this payment system and now focuses on supporting the use of agricultural insurances. The difference becomes clear when looking at the respective weight of these instruments: while the US agricultural policy consists of at least 60% insurance tools and no direct payments, the CAP only involves 1% insurance instruments and 60% income support through direct payments. [5]

However, as there is a severe shortage of harmonised data on farmers’ income levels, particularly for the period prior to the 1990s, it has been difficult for researchers to assess the effectiveness of both policy approaches. This article will therefore evaluate the agricultural policy of the EU and US by examining the evolution of their farm incomes since the 2000s, based on the available official statistics of the Farm Accountancy Data Network (FADN) and the Economic Research Service of the US Department of Agriculture (USDA ERS).

  1. The general evolution of farm incomes

1.1 Comparing the evolution of farm incomes in the EU and the US

The FADN and USDA ERS statistics are often difficult to compare, as they use a different range of instruments and indicators to collect information about the economic situation of their farms. The statistics are also expressed in different ways: while the FADN data mostly involves averages, the USDA ERS mainly provides information on the total income of farms.

Nevertheless, both databases have one indicator in common that can be used to compare the general agricultural income levels in both parts of the world, namely Farm Net Income (FNI). The FADN database collects data on Average Farm Net Income by correcting Gross Farm Income levels for wages, rents, interests, subsidies, and taxes. [6] The USDA ERS adopts a slightly different approach, as it adds the total revenues from farm sales, government payments, and other farm-related income, and subtracts this by the total amount of farm expenses. [7]

The Average Net Farm Income of the EU can thus be compared with that of the US by dividing the total US Farm Net Income by the number of American farms and expressing it in the same currency (euro) in real terms. Since the FADN database only provides statistics on Average Net Farm Income between 2004 and 2013, it is necessary to limit our comparison to this period. The results are visualised in Graph 1.

Graph 1 farms income

This graph shows that while Average Net Farm Income levels were still similar in both parts of the world in 2006, with €19 586 in the EU and €19 798 in the United States, a different evolution has taken place in the following years. In the United States, average farm incomes rose steadily (with the exception of a downfall in 2009 during the financial crisis) and had doubled by 2013 to €37 750. On the contrary, farm incomes in the EU have stagnated (experiencing a similar drop in 2009), and were even slightly lower in 2013 with an average of €17 903.

It has to be emphasised that a part of the differences in farm incomes can be explained by a divergence in farm structures. While the European Union currently has around 12 million farms with an average size of 15 hectares, the United States only has 2 million farms with an average size of 180 hectares. [8] Put differently, it is estimated that only 37.7% of American farms are smaller than 20 hectares, while this number is 86.3% in Europe. [9] [10] In short, as the average farm size is significantly higher in the United States than in Europe, their average income level also tends to be higher. Nevertheless, the contrast in the evolution of incomes remains striking, as the American agricultural policy has managed to double their incomes in 7 years, while incomes have stagnated in the European Union during the same period.

1.2 The evolution of farm incomes within the EU Member States

Even if farm incomes in the EU as a whole did not increase between 2003 and 2014, the previous figure suggests that they at least remained relatively stable and thus experienced low levels of income volatility. However, the statistics on Average Net Farm Income per member state prove that this broader trend masks the fluctuations and variations at the national level.

In the ‘old’ EU-15, Average Net Farm Income only remained relatively stable in 7 countries (Ireland, Italy, Portugal, Austria, Finland, Spain, and Greece), while there were strong income fluctuations in the other countries (the UK, the Netherlands, Belgium, Sweden, Germany, France, Denmark and Luxembourg). The most extreme example of income volatility was in Denmark, where incomes consisted of €6 299 on average in 2004, dropped massively to a negative amount of – €52 705 in 2008, and rose again sharply to €59 011 in 2013 (see Graph 2).

Within this 9 year period, incomes increased significantly in 4 countries (UK, the Netherlands, Denmark and Belgium), rose slightly in 8 countries (Sweden, Germany, France, Luxembourg, Ireland, Italy, Portugal, and Austria), and even decreased in 3 countries (Finland, Spain, and Greece). In 2013, average farm income levels still diverged sharply between €10 487 in Greece and €66 820 in the Netherlands.

Similar divergences can be seen within the ‘new’ EU-12 member states (see Graph 3). Incomes were highly volatile in 8 countries (Lithuania, Hungary, Czech Republic, Cyprus, Latvia, Estonia, Slovakia, and Malta), while they remained stable in only 4 countries (Romania, Poland, Bulgaria, and Slovenia). The extreme case here is Slovakia, where incomes were mostly negative and reached – €122 033 in 2006 and – €90 365 in 2008, recovering to 15 220 in 2010 before dropping again to – € 8 683 in 2013. Apart from this outlier, farmers in the member states had average incomes of between € 5 771 (in Slovenia) and € 53 979 (in the Czech Republic) in 2013.

Graph 2 Farms income

Average Net Farm Income levels have increased significantly in 7 countries (Lithuania, Hungary, Czech Republic, Cyprus, Romania, Poland, Bulgaria), risen slightly in 2 countries (Latvia and Estonia) and decreased in 3 countries (Malta Slovenia, and Slovakia) within the investigated period.

In short, the evolution of Average Net Farm Income between 2004 and 2009 has been highly volatile in the majority of the EU countries. Furthermore, incomes have increased strongly in 11 countries, have risen slightly in 10 member states and have even decreased in 6 countries within this timeframe. Significant differences in the economic situation of farmers between EU countries remain, in particular between the ‘old’ and ‘new’ member states.

Graph 3 Farms Income

  1. The evolution of incomes for different agricultural sectors

2.1 Comparing the evolution of incomes per agricultural sector in the EU and the US

Assessing and comparing the evolution of farm incomes in specific agricultural sectors is fraught with even more difficulties, as the US does not provide statistics on Net Farm Income per sector and uses different categories of commodities to those used in the EU. Therefore, the economic situation of the various American agricultural sectors will be assessed by analysing their average Net Cash Farm Income (NCFI).

The difference from Net Farm Income is that Net Cash Farm Income only includes cash revenues and expenses of farmers, while it excludes several relevant aspects such as inventory changes and and the costs of wages, rents, and interests. [11] As such, this indicator is not entirely comparable with Net Farm Income, but it nevertheless remains the most useful indicator for our comparison.

Graph 4 presents the evolution of Average Net Farm Income in Europe for different agricultural sectors. They reveal that income levels have remained relatively stable for producers of some commodities (horticulture, permanent crops, cattle, sheep and goats, and mixed sectors), while other sectors have experienced high levels of income volatility (field crops, pigs and poultry, milk, and wine).Graph 4 FArms Income


Additionally, Table 1 shows that farms in half of the categories saw their incomes decline since 2004, namely in the wine; horticulture; cattle, sheep and goats; and mixed agricultural sectors. Average Net Farm Income has increased only slightly in the milk and permanent crop sectors, while it has risen significantly for field crops, pigs, and poultry.

Unfortunately, the statistics of the USDA ERS on Net Farm Cash Income per sector are limited to the period 2010-2013. Nevertheless, the data shows a clear pattern: incomes have risen significantly for all agricultural sectors, especially for mixed grain and corn, whose revenues more than doubled in three years time (see Graph 5 and Table 2). If we look at the same period for the FADN data, it is clear that farm incomes in the EU have only increased slightly for wine, livestock and mixed agricultural producers, while they have even decreased for the field crops, permanent crops, horticulture, and milk sectors (see Table 3).

Graph 5 FArms Income

In short, half of the specific agricultural sectors in the EU were confronted with significant volatility and half of them saw their incomes decline over a period of 9 years.

Table 1 Farms Income

Meanwhile, the United States has managed to significantly increase the agriculture average Farm net income and, during a 3-year period (2010-2013), to increase the incomes for all agricultural sectors, while the EU faced stagnation and decline for all of sectors except pigs and poultry.

TAble 2 FArms Income

TAble 3 Farms Income

2.2 The evolution of farm incomes within the EU Member States: the example of other permanent crops

Even where the general evolution of income levels gives the impression that the revenues in some sectors have been rather stable throughout the years, these figures hide diverging evolutions at the national level. For instance, if we focus on the category “other permanent crops” (which covers among others fruits, nuts and olives) the more or less straight line in Graph x is misleading as it hides the variations at the national level (Graph 6 and 7).

Within the traditional EU-15 Member States, the ‘other permanent crops’ sectors have only experienced a pattern of relatively stable incomes in 4 countries (Greece, Spain, Italy, and Portugal), while there were strong fluctuations in 7 countries (Belgium, Denmark, Germany, France, the Netherlands, Austria and the United Kingdom). Furthermore, Denmark and the UK experienced periods of negative average income levels, respectively in 2004-2006 and 2004-2005.

Graph 6 FArms Income

Graph 6: Average Farm Net Income in the EU-15 countries for ‘other permanent crops’

Graph 7 Farms Income
The situation has been even worse within the EU-12, as all of the countries producing ‘other permanent crops’ were confronted with strong income fluctuations in this sector. In Hungary, the average income levels were even negative in 2004 and 2007. The income drop in the Czech Republic has been particularly striking, as it fell from €53 156 in 2006 to €20 554 in 2013.

In 4 EU member states (Austria, the Czech Republic, Latvia, and Spain), the economic situation of these particular sectors has worsened between 2004 and 2013, while it improved slightly in 4 (Greece, Italy, Romania and Slovenia) and significantly in 11 countries (Belgium, Bulgaria, Denmark, Germany, France, Hungary, Lithuania, the Netherlands, Poland, Portugal, the United Kingdom).

  1.  Conclusion

The analysis of the statistics provided by the FADN and the USDA ERS enables us to evaluate whether the Common Agricultural Policy has achieved its main objective of increasing the earnings of European farmers.

Firstly, the data on Net Farm Income levels showed that after 2006, when farm incomes were still on the same level in both parts of the world, the United States has managed to double its incomes by 2013, while the European Union experienced stagnation and even a slight decrease during the same period. Furthermore, while these general figures suggested that incomes have been relatively stable in the EU, this masks the fact that farm incomes were highly volatile in the majority of the member states.

Secondly, a focus on the different agricultural sectors revealed that the income of EU producers has dropped since 2004 for half of the commodity categories and that almost all the EU agricultural sectors have experienced a stagnation or decrease since 2010. In contrast, between 2010 and 2013, the United States managed to raise the incomes of all their agricultural sectors significantly. The evolution of the sectoral incomes within the EU member states also exposed that most of the agricultural sectors in Europe have been affected by high fluctuations in revenues.

As such, the statistics suggest that the incomes of European farmers have not improved since 2004, despite the fall in the number of farmers and some on-going restructuration of the EU agri-sectors, and that they were not shielded from volatility.

The difference in the patterns between incomes in the EU and the US should lead us to question the effectiveness of the agricultural policies put in place on both sides on three essential elements:

– the creation of a positive environment for the competitiveness of agricultural businesses, encouraging investment in productivity and sustainability;

– the opening of new markets, both for exports and in the domestic context, for each sector, notably via commercial leverage, innovation, and regulation;

– the capacity of the agricultural sector to be effectively armed at the sectoral level and at farm-level in order to continue to grow on volatile markets.

In other words, this data raises the question of the effectiveness of the CAP as it is today and as it has evolved since the start of the early 2000s. In view of the challenges of sustainable growth and competitiveness, the EU must provide the means to the European agri-food sector to regain its unequivocal dynamism.


References

European Commission, http://europa.eu/rapid/press-release_MEMO-13-631_en.htm.

European Commission, http://ec.europa.eu/eurostat/statistics-explained/index.php/File:Agricultural_holdings,_by_size_of_holding,_by_country,_2013.png.

European Parliament, Comparison of Farmers’ Incomes in the EU Member States, 2015.

FADN, http://ec.europa.eu/agriculture/rica/database/database_en.cfm.

Hill, B. Farm Incomes, Wealth and Agricultural Policy: Filling the CAP’s Core Information Gap, 2012.

Newton, D. ‘Small Acreage Farming in the United States’, USDA ERS Economic Information Bulletin, 2014.

OECD, Evaluation of Agricultural Policy Reforms in the European Union, 2011.

USDA ERS, http://www.ers.usda.gov/data-products/farm-income-and-wealth-statistics.aspx.

USDA ERS, http://www.ers.usda.gov/data-products/farm-income-and-wealth-statistics/update-and-revision-history/faqs.aspx.

[1] European Parliament, Comparison of Farmers Incomes in the EU Member States, 2015, p. 11.

[2] OECD, Evaluation of Agricultural Policy Reforms in the European Union, 2011, p. 22.

[3] Ibid., p. 142.

[4] B. Hill, Farm Incomes, Wealth and Agricultural Policy: Filling the CAP’s Core Information Gap, 2012, p. 20.

[5] Ibid., pp. 13-14.

[6] FADN, http://ec.europa.eu/agriculture/rica/database/database_en.cfm.

[7] USDA ERS, http://www.ers.usda.gov/data-products/farm-income-and-wealth-statistics.aspx.

[8] European Commission, http://europa.eu/rapid/press-release_MEMO-13-631_en.htm.

[9] European Commission, http://ec.europa.eu/eurostat/statistics-explained/index.php/File:Agricultural_holdings,_by_size_of_holding,_by_country,_2013.png.

[10] D. Newton, ‘Small Acreage Farming in the United States’, USDA ERS Economic Information Bulletin, 2014, p. 3.

[11] USDA ERS, http://www.ers.usda.gov/data-products/farm-income-and-wealth-statistics/update-and-revision-history/faqs.aspx.

How to tackle price and income volatility for farmers? An overview of international agricultural policies and instruments

(Executive summary available here in EN and FR)

  1. Introduction

While the markets for agricultural commodities have an inherent tendency to be rather volatile, the price volatility of these products has been particularly high in the last decade. More specifically, sharp increases in global food prices in 2007-2008 and 2010-2011 were followed by recurring periods of often severe price depression. As these changes in prices were unpredictable, price volatility had a number of negative consequences in all parts of the world. [1]

The reason for this is that large variations in prices create a high level of uncertainty among producers and consumers. Producers are more concerned about the prospect of low prices, since a lower income may threaten their viability in the long term. Meanwhile, the ability of poor households to ensure their nutrition and other basic needs (such as education and health care) can be compromised when food prices are high. [2] Additionally, farmers are less willing to invest in productivity-raising assets when prices are unpredictable, and this may encourage them to take sub-optimal investment decisions in the long term. [3] [4]

As a result, the recent price fluctuations and their detrimental impact on the agricultural sector have stimulated a renewed debate on the issue of volatility and the possibilities of stabilising the agricultural markets. [5] Since the volatility in prices and incomes for farmers is likely to remain and even increase in the future, the possibilities to manage these risks should be a primary concern for both stakeholders and policy-makers. [6]

Against this background, this report focuses on the agricultural policies and instruments that can support farmers in the management of these types of volatility. After briefly outlining the causes of price and income volatility for farmers and the options to deal with this, the policy instruments of the main agricultural countries and regions will be assessed, namely those of the European Union, the United States, Brazil, China and Australia. In particular, special attention will be given to the state support for agricultural insurance schemes.

  1. Causes of price and income volatility

Essentially, high levels of price and income volatility for farmers are related to the market fundamentals of supply and demand. However, they can be intensified by other macro-economic variables, the broad political and legislative environment for farmers, and speculation on agricultural products.

In the first place, variations in prices and incomes are the result of shifts in supply and demand. As food demand and supply have a low price elasticity in the short run, meaning that they are not very responsive to price changes, fluctuations in agricultural prices tend to be especially strong. On the one hand, the nature of food as a basic necessity means that it is, by definition, price inelastic. On the other hand, the supply of food cannot respond quickly to price changes, since it often takes a significant amount of time to produce agricultural products. As a result of this limited price responsiveness of demand and supply, unexpected changes in the amount of output often require large price changes to restore the market equilibrium, which causes agricultural markets to be rather volatile. [7]

Other macro-economic conditions can also be important drivers of price volatility. Some of the structural factors that can simultaneously influence the prices of different crops include exchange rates, energy and fertiliser prices, and interests rates. [8] Additionally, due to evolutions in agricultural policies and legislations, and especially under the impulse of the WTO agreements, agricultural markets have become more open and competitive in the last decades, leading to increased price volatility and variations in farm income. [9] Finally, as agricultural products can now also easily be sold as financial assets, they are exposed to shocks on related commodity markets (such as the energy and metal markets), and speculation on these products is deemed to be a major cause of increasing price changes.[10]

These endogenous risks, which are the result of the behaviour of market participants, are the main causes for the volatility in agricultural prices and incomes. However, farmers are also exposed to exogenous risks, which are independent from market conditions and are caused by weather and climatic factors.

Indeed, agricultural activities are especially sensitive for climatic factors, since these play an important role in the production process. Weather conditions can strongly affect the crop and livestock production and cause annual variations in yields, while extreme weather events can significantly damage agricultural output. Therefore, the production of agricultural commodities remains much more variable than the output of other industrial sectors. Moreover, as climate change may result in worsening production conditions for farmers, these exogenous shocks are expected to increase in the future. [11]

 In short, large price fluctuations and the resulting variations in income, which are caused by the endogenous and exogenous factors described above, represent risks that are specific to farmers. However, the agricultural sector also faces multiple risks that affect other sectors as well, including business/entrepreneurial risks, legal risks, social risks, financial risks etc. [12] Nevertheless, price and income volatility are generally considered to be the most important elements of uncertainty for farmers. The remainder of this report will therefore focus on the instruments that are being used to tackle these issues.

  1. Methods to deal with income and price volatility

Instruments to tackle the price and income volatility for farmers can involve private initiatives, public policy measures, or a mix of both.

First of all, there are several ways for farmers to tackle these issues themselves, as they can try to reduce the occurrence of these risks, mitigate their damage and/or cope with the impact of these risks on their income. For instance, by using the appropriate production technologies (e.g. by planting drought-resilient crop varieties or investing in irrigation methods), farmers can reduce the risks of yield losses due to weather conditions.

Risks related to fluctuating prices can also be mitigated through the use of several market-based options, such as future markets and insurances. However, these instruments are often rather costly in terms of fees and prices. Finally, the options for farmers to cope with risks mainly consist of financial approaches, such as saving money when their incomes are high and using these reserves when their revenues are low. [13]

Additionally, there are several other private protection instruments for farmers, including the diversification and rotation of crops, the membership of farmers in a cooperative, and the use of storages for their products.

Governments can also empower farmers by creating policy and legal frameworks that improve their ability to manage these risks. [14] Apart from enhancing the training of farmers and providing reliable information on market developments, public policies can maintain safety nets to help farmers to deal with income loss as a result of catastrophic events or major disturbances of the market.

Some public measures to achieve these outcomes include insurance schemes, the provision of disaster assistance, the enhancement of markets for derivatives, fiscal measures, contra-cyclical payments, mutual funds, storage support and improving the access to credit for farmers. The next chapter presents an overview of the public instruments that are used to tackle price and income volatility in the European Union, the United States, Brazil, China, and Australia. [15]

4. International agricultural policies and instruments to protect farmers against price and income volatility

a) The European Union

  • The evolution of the Common Agricultural Policy (CAP)

The Common Agricultural Policy (CAP) of the EU consists of several policy instruments that help farmers to deal with price and income volatility. These instruments have evolved significantly over time.

When the CAP was established in the early 1960s, it aimed at ensuring a fair standard of living for farmers by maintaining high and stable prices for the major agricultural products, through both domestic (e.g. intervention buying) and border measures (e.g. export subsidies and variable levies on imports). These price support policies largely continued throughout the 1970s and 1980s, although some sector-specific adjustments were made to tackle some of its negative consequences, for instance through production quotas and voluntary set-asides. [16]

However, after the Uruguay round of the GATT negotiations, the traditional CAP policies became unsustainable and pressures to change this approach became too high. In 1992, the European Commissioner for Agriculture Ray MacSharry initiated the first major reform of the CAP by reducing the level of price intervention and import/export tariffs, and offering direcCAP budgetary path
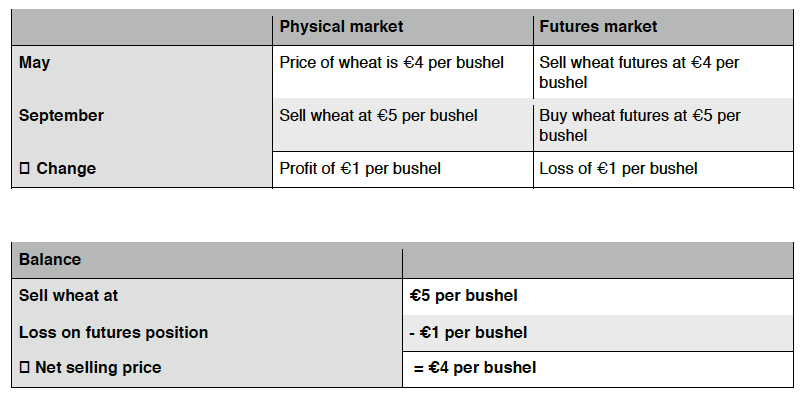
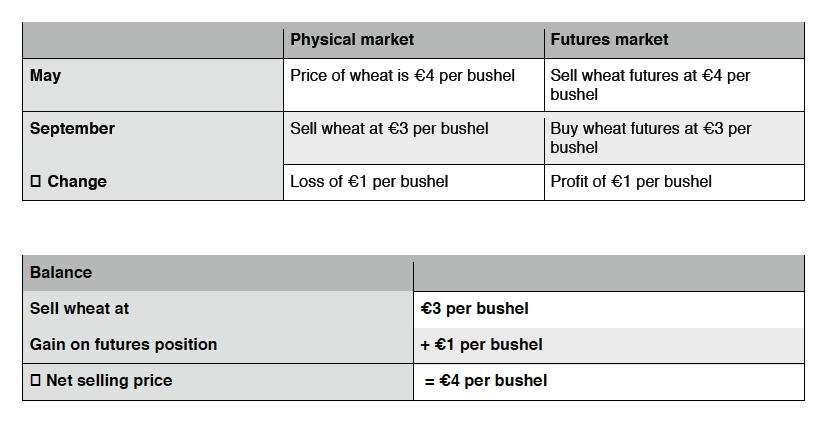
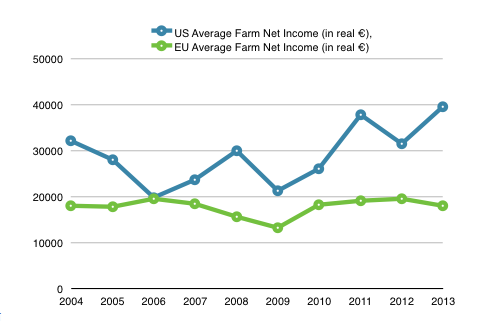
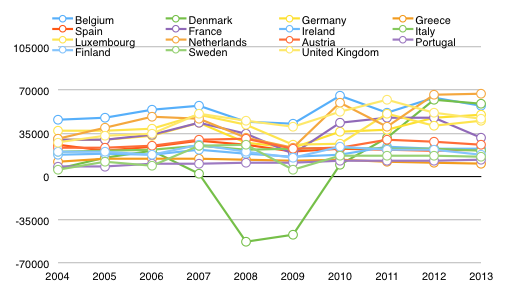
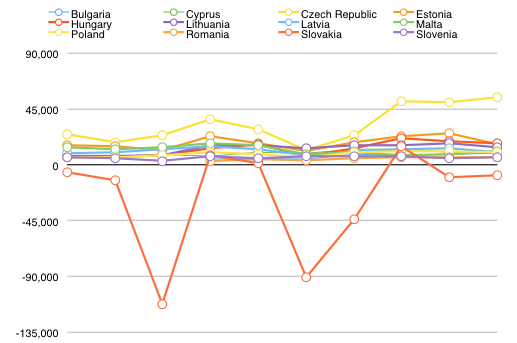
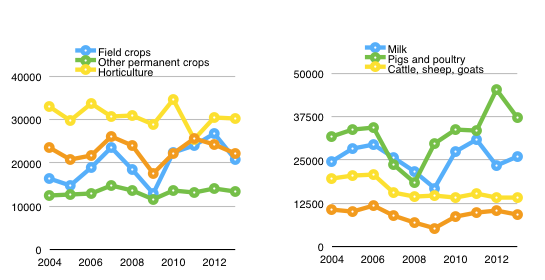
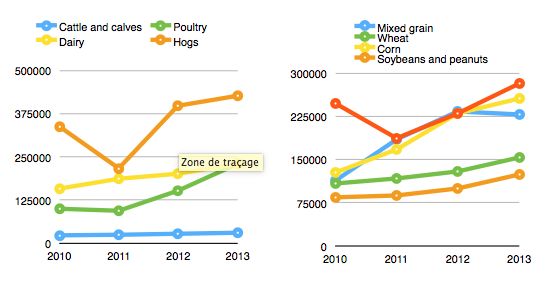
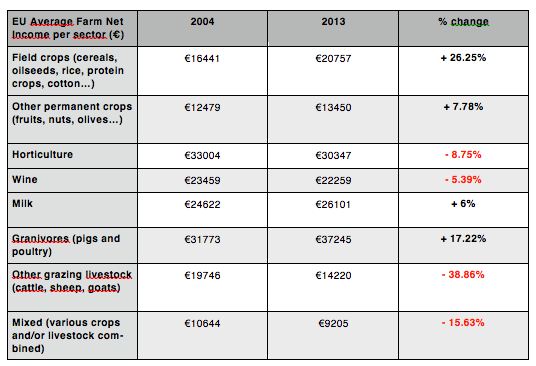
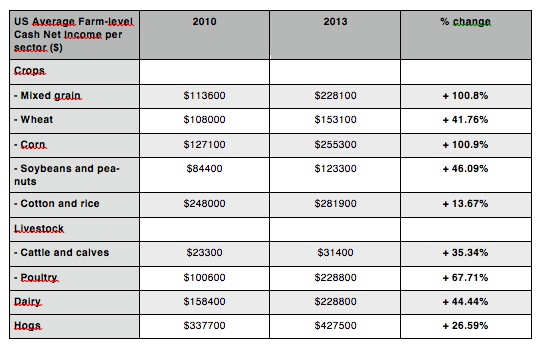
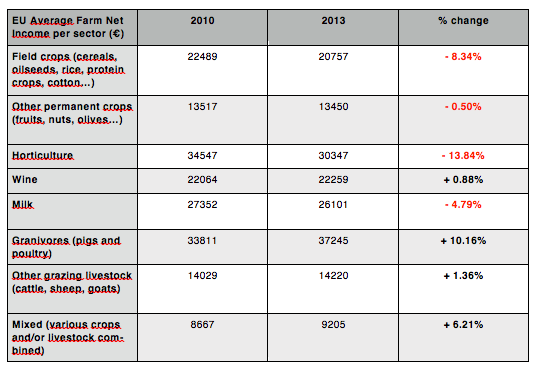
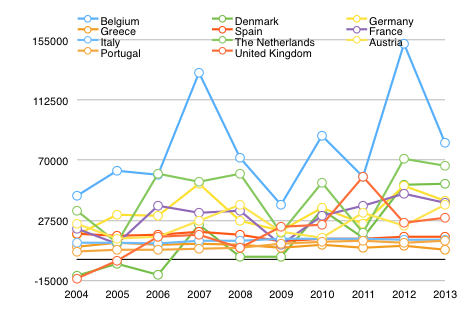
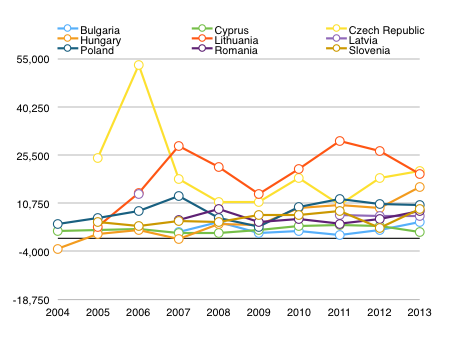
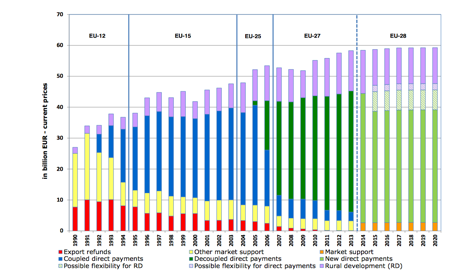
t coupled payments to farmers as a compensation. [17] Afterwards, the reforms implemented under the Commissioners Franz Fischler and Mariann Fischer Boel decoupled these payments from agricultural production, and the EU markets for agricultural products became more open to global influences and more
vulnerable to price swings. [18]

In short, through a series of reforms in the last two decades, the CAP has evolved towards the dismantling of price support for farmers and an increasing market orientation for agriculture, leaving more room for fluctuating prices as a result of changes in global supply and demand (see figure). [19] This transformation can be demonstrated by the evolution of the expenditure on the CAP: while market interventions still accounted for up to 90% of the total CAP budget in 1992, they represented only 5% in 2013. [20]

  • Instruments under the current Common Agricultural Policy (2014-2020)

The current CAP gives assistance to farmers through ‘Market support measures and direct subsidies’ (Pillar 1) and ‘Rural Development Programmes’ (Pillar 2). [21] The budget for the first pillar consists of 312,74 billion euros, while 95,58 billion euros is made available for the second pillar. Although member states can still decide to give some support to farmers coupled to production, market support measures now only account for a small share of the CAP budget. [22]

The most important changes that were introduced in the last CAP reform (for the period 2014-2020) were related to the system of fixed direct payments in Pillar 1, as the Basic Payment Scheme (BPS) replaced the Single Payment Scheme (SPS). While these direct payments are not explicitly designed as an instrument to tackle price volatility, they help to shield European farmers from strong fluctuations in revenues. According to estimates of the European Commission, these ‘decoupled’ payments now account for nearly one third of the income of European farmers. As these continuous financial flows are not subject to market outcomes and unexpected changes, they provide these farmers with a significant degree of income stability. [23] [24]

The CAP for the period 2014-2020 also strengthened the risk management instruments that were introduced in 2009, but they have not been very successful so far. These instruments were transferred from the first to the second pillar, and as a result they have become optional measures which can be co-financed by the Member States. They consist of the three following tools:

– Financial support to farmers for the premiums on insurances for crops and livestock against losses caused by adverse climatic events and diseases

– Financial support for mutual funds to compensate farmers for production losses related to climatic and environmental events

– An Income Stabilisation Tool (IST), mobilising financial support for farmers who experience severe income losses (exceeding 30% of the average annual income) [25]

Firstly, the use of EU funds to finance the premiums on domestic insurance markets has so far been limited to eight countries (France, Hungary, Italy, Lithuania, Latvia, Malta, and the Netherlands) and four regions (Flanders, Continente, Madeiras, and Açores). Only 200 000 European farm holdings are now receiving this type of support for their premiums, and the large majority of them are based in France and Italy (see Table 1). The total expenditure for this instrument, of both the European Union and the national governments, currently reaches around 2.2 billion euros (see Table 2).

Table 1: Number of agricultural holdings supported by European risks management instruments
Number of agricultural holdings Premiums Mutual Funds IST Total
BE – Flanders 1.300,0 0 0 0
ES – Castilla y Leon 0 0 950,0 950
FR 97.000,0 398.000,0 0 495.000
HR 8.300,0 0 0 8.300
HU 10.500,0 0 4.500,0 15.000
IT 80.000,0 5.000,0 5.000,0 90.000
LT 1.450,0 0 0 1.500
LV 4.000,0 0 0 4.000
MT 1.500,0 0 0 1.500
NL 1.300,0 0 0 1.300
PT – Continente 785,0 0 0 800
PT – Madeira 350,0 0 0 350
PT – Açores 150,0 0 0 150
RO 0 15.000,0 0 15.000
Total 206.635 418.000,0 10.450,0 633.850

Table 2: Total expenditure on European risks management instruments

Total expenditure (EAFRD + national) Premiums Mutual Funds IST
BE – Flanders 5.000.000 0 0
ES – Castilla y Leon 0 0 14.000.000
FR 540.750.000 60.000.000 0
HR 56.600.000 0 0
HU 76.540.000 0 18.800.000
IT 1.396.800.000 97.000.000 97.000.000
LT 17.460.000 0 0
LV 10.000.000 0 0
MT 2.500.000 0 0
NL 54.000.000 0 0
PT – Continente 49.700.000 0 0
PT – Madeira 800.000 0 0
PT – Açores 2.350.000 0 0
RO 0 200.000.000 0
Total 2.212.500.000 357.000.000 129.800.000

Secondly, there is the possibility to receive financial support from the EU for mutual funds that compensate farmers for heavy production losses. These funds can be used to compensate for losses which are officially recognised by a competent national authority, or to provide subsidies which partly cover the costs of setting up the funds, the payments to farmers, and eventual interest rates on the loans undertaken by the funds. An index is used to calculate the production losses, and these should involve at least 30% of average past production in order to receive compensatory payments.

However, this proposal has not yet instigated much change in the member states, since creating new mutual funds is often very costly. As a result, it has only been used by France, Italy and Romania, where 418 000 agricultural holdings are benefiting from these funds. However, participation is mainly concentrated in France (representing almost 400 000 holdings), while a very limited number of farmers is affected in Italy and Romania (see Table 1). Total public spending on this measure accounts for 357 million euros (see Table 2). [26]

Thirdly, the Income Stabilisation Tool (IST) is a mutual fund to compensate farmers for severe income losses. This fund, which can be publicly subsidised, may provide support to agricultural producers when they experience an average income loss of 30% over a period of three years. In this sense, the provisions for these tool are similar to those for the mutual funds to compensate for production losses.

However, there has been a lack of details regarding the implementation of this instrument in practice. Therefore, only Italy, Hungary, and the Spanish region Castilla y León are now adopting this tool, covering a very limited number of 10 000 agricultural holdings and accounting for 130 million euro in total public support (see Table 1 and 2). [27]

In short, the three instruments described above are currently weak options for member states rather than full-fledged programmes for farmers to deal with income and price volatility. As the guidelines for designing these tools remain rather vague (especially for the mutual funds and the IST), these programmes are treated more as theoretical concepts than as real instruments, and their implementation through the actions of Member States has been very limited since 2009. Currently, only four regions and eight countries are using the instrument to support insurance premiums, while the mutual funds and IST are only implemented in three countries. The total amount of European financial support for these tools is limited to 1.7 billion euros. According to the Commission, these instruments should be fully implemented by the end of 2018, when the mid-term evaluation of the CAP takes place.[28]

Table 3: European Union expenditure on risk management instruments
Expenditure of EAFRD Premiums + Mutual Funds + IST
BE – Flanders            3.142.949
ES – Castilla y Leon            7.420.000
FR            600.750.000
HR            48.172.367
HU            78.641.932
IT            715.860.000
LT            14.841.242
LV            6.800.000
MT            1.875.000
NL            14.690.000
PT – Continente            40.754.000
PT – Madeira            655.988
PT – Açores            2.000.000
RO            170.000.000
Total 1.705.603.478
  • National agricultural policies in the EU

In general, there are no fully developed national policies of EU Member States to protect farmers from price and income volatility. This might be explained by the fact that, for a long period of time, the agricultural policies of the CAP provided European farmers with a high degree of price and income stability. [29] However, farmers in all Member States have access to some form of insurance against the production risks caused by natural events, yet there are significant differences in the coverage and design of these insurance schemes. [30]

Crop insurances for single risks are well-developed and exist in all EU-countries. In around half of the EU-countries, single risk insurances are provided to farmers on a private basis. These countries include Belgium, Bulgaria, Denmark, Estonia, Finland, France, Germany, Greece, Hungary, Ireland, the Netherlands, Sweden, and the United Kingdom. Other member states provide partial public support to these insurances in the form of subsidies, namely Austria, the Czech Republic, Italy, Latvia, Lithuania, Luxembourg, Poland, Portugal, Romania, Slovakia, Slovenia, and Spain. Finally, in Cyprus there is a compulsory public single risk insurance, which is partially subsidised. In general, the most widely used type of this insurance is the one against hail damage. [31]

Combined insurances covering multiple risks are also provided in several member states. They are available and supported by the state in Austria, the Czech Republic, Italy, Portugal, Romania, Slovakia, and Spain. In Bulgaria, Finland, France, Hungary, Slovenia, and Sweden, this type of insurance is only provided by private companies. Again, Cyprus has a compulsory and partially subsidised insurance scheme, while Greece created a hybrid public insurance system which is partly subsidised and partly compulsory.

In a few countries, farmers also have access to yield insurances, which cover yield losses for a given crop caused by all types of natural events. They are only developed in countries where significant public support is provided to agricultural insurance schemes, namely in Austria, France, Italy, Luxembourg, and Spain. [32]

Finally, revenue insurances have not been developed in Europe yet (they are only applied in the United States). This type of insurance combines yield and price insurances, and takes into account the agricultural production costs. Farmers are compensated if the value of their production falls below a certain (historical) level. [33]

If we look at the EU countries in more detail, it becomes clear that Spain has the most elaborate insurance system against natural risks. In essence, the Spanish and regional government partially cover the costs of the premium that farmers have to pay to private insurance companies (between 20% and 60%). Furthermore, the insurance support is based on institutional arrangements between both public and private actors, and farm unions are actively involved in the management of the system. [34]

This insurance system was created in 1978, and the number of insurable crops covered has been expanding consistently in the following decades. Insurance schemes now cover damage to agricultural production produced by natural conditions such as diseases, drought, fire, flood, frost, hail, rains, snow and wind. While some yield insurances are offered, combined insurances are the most common instrument to cover these risks for different agricultural sectors.

The degree of coverage of the Spanish agricultural insurances differs significantly across sectors and products, and is the broadest for crops such as cereals, fruits and olives. Spain is currently not using the EU funds to subsidise its insurance system. [35]

Other countries, such as France, Italy, Luxembourg and Austria, also have well-developed insurance schemes, and farmers can be covered for most types of risk. Farmers in these countries often have a basic coverage against hail and have access to an additional yield insurance. However, this does not mean that these types of insurance are widely used in these countries. For instance, the level of insurance coverage is rather low in Italy, despite the fact that national legislation promotes the use of these instruments. In general, these insurances are not very attractive for farmers due to their high premium costs. [36]

Both single and combined risk insurances are also available in Bulgaria, the Czech Republic, Hungary, Poland, Portugal, Slovenia, Slovakia, and Sweden; yet they only cover hail damage and a few other risks. In Belgium, Germany, the Netherlands, and the United Kingdom, there is no public support for insurances at all. Single risk insurances are the main instrument to protect farmers in these countries, especially for hail damage, and there is a lack of coverage against other types of risks. Insurance systems are even less developed in some Northern European countries, such as the Baltic States. Finally, Cyprus manages their insurance schemes in a different way as the others, since farmers are obliged to subscribe for insurances provided by the government. [37]

Furthermore, these production risk insurances involve different ‘triggers’, meaning that a certain amount of losses has to occur before the insurance company makes compensatory payments to the farmers. The table below gives an overview of some of these trigger rates for the types of insurance in the EU member states. [38]

Table 4: Trigger rates for agricultural insurance schemes Single-risk insurance Combined insurance Yield insurance Livestock
Austria 8% for hail insurance Depends on type of crop Depends on type of crop
Belgium 5% for hail insurance
Bulgaria 5% 10, 30 or 40%
Cyprus 15% (hail frost and wind), 20% (flood and heatwave), 35% (water), and 40% (drought)
Czech Republic 8-10%
Finland 5-20% Variable
France 15% on average 15% on average 15% on average
Germany Hail damage: 8% for arable crops and wine, 10% for fruits and vegetables
Greece 15% for hail insurance 20% (with exceptions) 1-2%
Hungary 5% 10%
Italy 10-30% 20%
Lithuania 6-12% 10-30%
Luxembourg Hail insurance: 8% (arable crops) and 10% (fruits and vegetables) 8% (flood, frost, storm) and 20-40 (drought)
Poland 10% 10% 20%
Romania 10% 10%
Slovenia 5%
Spain 10-30% 10-35% 10%


b) The United States

The United States is the largest exporter of agricultural commodities in the world and has a big domestic market for these products. The country shifted its agricultural policy away from the traditional price support schemes with the Farm Bills of 1985, 1990 and 1996, in order to fulfil the requirements of the WTO. To compensate farmers for these reduced market payments, there was a move towards direct payments with the 2002 and 2008 Farm Bills, which introduced the counter-cyclical payment programmes of the CCP and ACRE. As a result, fixed direct payments became the most important source of support for farmers from the 1990s until 2013. [39]

The current US agricultural policy (for the period 2014-2018) is described in the 2014 Farm Bill, which was approved around the same time as the last CAP reform. The most important change in this new programme was the elimination of all fixed direct payments, by repealing the Direct Payments (DP), the Countercyclical Payments (CCP), the Average Crop Revenue Election (ACRE) and the Supplemental Revenue Assistance Payments (SURE) programmes. [40]

Instead, two new risk-management programmes were established to supplement crop insurances and protect farmers when they suffer significant losses: a Price Loss Coverage (PLC) programme to address sharp declines in commodity prices and an Agriculture Risk Coverage (ARC) programme to cover a portion of a farmer’s revenue losses when crop prices fall to 86% of the ‘historical’ benchmark. Producers can only enrol in one of these two instruments, and subsidies are limited to a maximum of 125,000 dollars per person. The cost of the PLC programme was approximately 13.1 billion dollars in the financial year 2013, while the ARC programme costed 14.1 billion dollars.[41]

Additionally, a new dairy margin protection programme was created to compensate farmers when national milk prices drop too close to feed costs. The amount of indemnity payments given by the US government depends on the annual coverage decision made by the dairy farmer. [42] This new programme replaces the Milk Income Loss Contract programme and is likely to result in higher government support to help secure the income of American dairy farmers. [43] This contrasts with the situation in Europe, where the abolition of milk quota will lead to lower prices and a higher income risks for farmers in the short term. [44]

Crop insurance programmes are now the main policy tools used to support US Farmers. The 2014 Farm Bill maintains and strengthens the existing crop insurance programmes under the Common Crop Insurance Policy, and expands their scope to other products (organic products, bio-energy crops and speciality crops) and other elements such as livestock diseases, specific production practices, and business interruption.

Additionally, two new crop insurance programmes were created, the Supplemental Coverage Option (SCO) for the main crops and the Stacked Income Protection Plan (STAX) for cotton. Under these programmes, producers can receive additional insurances to cover a part of the losses which is not included by the traditional crop insurance policies (‘shallow losses’). Coverage under SCO is triggered only if the area loss exceeds 14%, and would cost 1.7 billion dollars over the next 10 years. Because cotton growers are not eligible for the new PLC and ARC risk mitigation programmes, the Stacked Income Protection Plan (STAX) was created for them. This programme enables cotton producers to obtain an area wide group-risk insurance as a supplementary insurance or a stand-alone policy.

The financial support for insurances against natural disasters was also extended, as the 2014 Farm Bill reauthorised and modified certain Supplemental Agricultural Disaster Assistance programmes. These programmes include the Livestock Indemnity Payments; the Livestock Forage Disaster Program; the Emergency Assistance for Livestock, Honeybees and Farm-Raised Fish; and the Tree Assistance Program.

The total budget cost of the 2014 Farm Bill is estimated to be 489 billion dollars for the period 2014-2018, and almost 1000 billion dollars for the next ten years. [45]

In short, the US agricultural policy uses a very different set of tools and instruments to deal with price and income volatility for farmers than those available through the CAP. While the EU provides direct payments to support the income that farmers receive from the market for their products, the U.S. terminated their system of direct payments and now focuses on market income, while reducing the risks for farmers by promoting the use of insurances. These differences become clear when we look at the respective weight of different instruments in the US and the EU: while the US agricultural policy consists of at least 60% insurance tools and no direct payments, the CAP only involves less than 1% insurance instruments and 60% income support through direct payments. [46]

c) Brazil

Brazil is a major player on international agricultural markets, being the third largest exporter of agricultural products behind only the European Union and the United States. [47] After the elimination of its import substitution policies, Brazil has moved away from taxing its agricultural sector in the 1980s and 1990s towards providing a moderate level of support to its farmers. [48] As a result, the country has seen its agricultural activities grow strongly in the last three decades. Due to productivity improvements, agricultural output has doubled and livestock production has trebled since 1990. [49] [50]

The Brazilian agricultural policy is characterised by a dual structure, as it is designed by two separate Ministries: the Ministry of Agriculture, Livestock and Procurement (MAPA) focuses on commercial agriculture, while the Ministry of Agrarian Development (MDA) deals with small-scale family farmers. [51] They have created three main policy instruments to help farmers to cope with price and income volatility: rural credit, minimum price guarantees and agricultural insurance subsidies. [52]

Rural credit is the main source of government support to both commercial and family farmers. The National Rural Credit System (Sistema Nacional do Credit Rural, SNCR) provides loans to farmers at preferential interest rates by intervening in the financial system. Through several credit allocations, the MAPA aims to improve the marketing, working capital, and investments of commercial farms. Specific programmes include the Programa ABC, Moderagro, Moderinfra, Moderfrota, PSI Rural, Prodecoop, Pronamp, Procap-Agro, Inovagro and PCA. Credit for family farms for working capital and investment loans is provided by the PRONAF-Credit programme of the MDA. [53]

The preferential interest rates on these credit loans are funded by the Brazilian Development Bank (BNDES) and ‘compulsory resources’ (Exigibilidade dos Recursos Obrigatórios). The latter means that Brazilian Banks are obliged to use at least 34% of their deposits for loans to agricultural activities at an interest rate below the market price. In order to ensure these preferential loans, the government can compensate banks by paying (a part of) the costs for reducing the interest rate. [54]

Specific agricultural sectors benefit significantly from these rural credit programmes and targeted fiscal policies. For instance, the Brazilian government strongly encourages the production of biofuels through these instruments. In particular, concessional credit programmes are provided to oilseeds and biofuel crop producers, ethanol storages are publicly funded through the Moderinfra programme, and a special credit line for sugar producers (Prorenova) was created to overcome the shortage of sugar in the ethanol industry. The consumption of biofuel has also been promoted through tax cuts for owners of cars running on combinations of ethanol and diesel. [55]

Furthermore, since a high amount of outstanding debt is a longstanding issue in Brazilian agriculture, credit support has also been provided to producers through debt rescheduling. For both large- and small-scale farmers, there have been several debt renegotiations throughout the 1990s and 2000s, which involved reductions in interest rates on overdue debt and extensions of the repayment terms. [56]

These concessional credit programmes have expanded consistently in the last years, reaching 76 billion dollars in 2014. Of this amount, 87% was allocated to commercial agriculture, while only 13% went to family farms. The subsidies for this credit provision are estimated to have reached 10 billion dollars for the year 2014. [57]

Minimum guaranteed prices also continue to be a significant pillar of the Brazilian agricultural policy, and aims at protecting farmers against sharp drops in market prices. The National Food Supply Agency (Companhia Nacional de Abastecimento, CONAB) is the regulatory agency in charge of the implementation of this policy. [58]

 For commercial agriculture, this price support is distributed regionally by the CONAB through the PGPM (Política de Garantia de Preços Mínimos). Specific price support measures for large-scale farming include direct government purchases (Aquisição de Governo Federal, AGF) and financial support for storages by the FEPM (Financiamento para Estocagem de Produtos Agropecuários integrates de Política de Garantia de Preços Mínimos). [59]

Instruments targeting the prices for small-scale farmers also include government purchases (Programa de Aquisição de Alimentos, PAA) and minimum price programmes (Programa de Garantia de Preços para a Agricultura Familiar, PGPAF). For the government purchases, the CONAB directly buys agricultural products from family farms at market prices, and distributes these as part of food programmes or uses them to replenish their food stocks. Meanwhile, the minimum price programmes ensure that farmers receive a guaranteed price for their products based on their production costs. [60]

The price guarantee instruments cover more than thirty crops, including cotton, maize, rice, soybeans and wheat, but also regional crops such as açaí, cassava, beans, guaraná, sisal, and some livestock products such as milk and honey. Examples of support prices per tonne include 231 dollars for wheat, 128 dollars for corn and 224 dollars for rice in 2015. [61] In order to finance these instruments, the Brazilian government spent 2.5 billion dollars on the measures for commercial agriculture and 516 million dollars for small-scale agriculture in 2014. [62]

Finally, the Brazilian government also aims to mitigate fluctuations in farmers’ incomes by supporting combined and yield insurances. This form of support is implemented through 4 main programmes which either pay a share of the farmers’ insurance premium or compensate them for production losses caused by natural disasters. [63]

For commercial farms, the MAPA manages the general agriculture insurance programme (Programa de Garantia da Atividade Agropecuária, PROAGRO) and the rural insurance premium programme (Programa de Subvenção ao Prêmio do Seguro Rural, PSR).

The general PROAGRO programme is designed to help producers who have troubles to finance their rural credit due to heave income losses caused by natural disasters and diseases. Farmers pay a premium fee to this programme based on a variety of indicators (the type of crop, the applied technology, the area of production etc.). When the MAPA decides that the crop failures are significant enough, farmers are exempt from the financial obligations on their rural credit. [64]

The rural PSR programme subsidises the premiums that commercial farms have to pay to the insurance companies authorised by the MAPA. State contributions depend on the type of crop, and vary between 40% (for livestock, forestry and aquaculture) and 70% (for beans, wheat and corn). [65] 

Small-scale agriculture is supported through the family agriculture insurance (PROAGRO-MAIS/SEAF) and the crop guarantee programme (Programa Garantía-Safra, GS). [66]

PROAGRO-MAIS, also called SEAF, is a part of the PROAGRO programme, and also protects farmers against the loss of income as a result of natural phenomena. When the losses of the small-scale farmers participating in this programme exceed 30% of the expected crop revenues, they are exempt from paying their financial obligations for rural credit. This support is limited to a maximum of 660 dollars per farmer. Moreover, the government subsidises 75% of the premium for the programme. [67]

Finally, family farms in specific areas in the Northeastern and Southeastern regions of Brazil can participate in the GS programme. Farmers pay a fixed amount of 225 dollars every year, and can receive compensations if their registered production losses for crops of beans, cassava, cotton, corn or rice are higher than 50%. [68] [69]

In 2014, commercial agricultural producers received 645 million dollars in insurance subsidies through the general insurance programme and 300 million dollars through the rural insurance programme. Support for small-scale family farms under the PROAGRO-MAIS-SEAF programme amounted to more than 1.3 billion dollars. [70]

In short, domestic support to Brazilian agricultural producers is provided mainly through subsidised credit, and complemented by price support measures and insurance policies, which aim at stabilising the prices for agricultural products and protecting the incomes of both large-scale and family farmers.

d) China

China has not only become the largest agricultural producer in the world, but is also a large net importer of agro-food products, as it feeds almost one fifth of the global population. The financial support for its agricultural sector has increased significantly in the last decade and continues to grow every year. [71]

The main instruments of the Chinese agricultural policy consist of minimum guaranteed prices for wheat and rice, and ad hoc market interventions for other agricultural commodities. In combination with tariffs, tariff rate quotas (TRQs), and government controls, these instruments ensure that farmers receive a minimum level of prices for their products. Additionally, a variety of other programmes gives further financial support to Chinese farmers: direct payments for grain producers; subsidies for agricultural inputs (fertilisers and energy), improved seeds, and machinery; and financial contributions to agricultural insurance schemes. [72]

Minimum guaranteed prices for grains are determined by the National Development and Reform Commission (NDRC), in close cooperation with the Chinese Ministry of Agriculture and other state institutions. Price guarantees are limited to the biggest grain-producing provinces and differ for the various types of grain. In 2015, average support prices per tonne are estimated at 384 dollars for wheat, 361 dollars for corn and 438 dollars for rice. [73]

Intervention purchases are made by the state-owned China Grain Reserves Corporation (Sinograin) if the market price for wheat, corn and rice drops below certain levels. This requires large public stocks, which are managed by the State Grain Administration. The current level of grain reserves amounts to 40% of China’s domestic consumption, which is more than in any other country in the world. The cost of maintaining these stocks was 8.8 billion dollars in the year 2013. [74]

For other agricultural commodities, ad hoc market interventions are possible at fixed prices, although these are not always executed and there are significant regional differences. Nevertheless, in recent years policy reforms abandoned the stocks for cotton and soybeans, and replaced them with a system of compensatory direct payments if prices fall below a certain level. This type of reform could be extended to other commodities in the future.

The amount of budget transfers provided through these price interventions has risen significantly since the end of the 1990s, as the minimum prices have been increased every year. [75] In 2014, the Chinese government bought 365 million tonnes of agricultural commodities from its farmers, representing one third of the country’s total agricultural expenditure. As a result of these measures, Chinese farmers receive prices for their products which are 20% higher than those on the world markets. [76]

Furthermore, tariffs on agricultural products amount to 15% on average, and several agricultural products are also subject to tariff rate quotas, including wheat, maize, rice, wool, cotton and certain types of fertilisers. [77]

Grain producers also receive direct payments to support their production and stabilise their incomes. They are paid at a flat rate per unit of land, which consists of 24 or 36 dollars per hectare, depending on the region. Government spending on these direct payments involves 2.4 billion dollars per year.

Subsidies on agricultural inputs are provided to compensate grain producers for increasing prices of fertilisers, energy, and fuel. Again, fixed payments are made based on the amount of land, and they directly support farmers’ incomes.

The Improved Seed Variety Subsidy programme provides subsidies for farmers to enable them to improve the quality of their seeds. The implementation of this subsidy depends on the product: while the national government makes cash payments based on land for rice, maize and rapeseed, the provinces can make direct payments or reductions on the prices of seeds for wheat, soybean and cotton. Farmers receive 24 or 36 dollars per hectare, depending on the commodity. However, it is not monitored if these funds are actually being used for seed purchases.

The purchases of agricultural machinery are also being increasingly subsidised, through a programme that compensates the buyer or seller for 30% of the price. This subsidy programme currently covers 12 categories and 48 sub-categories of machines. In theory, state contributions are limited to 7 900 dollars per single item, but these subsidy ceilings are never enforced in practice.

The budgetary transfers for these programmes involved 17.1 billion dollars for agricultural inputs, 3.5 billion dollars for improving the seed quality, and 3.5 billion dollars for the purchases of machinery in 2014. [78]

Finally, there are several combined insurance schemes for both crops and livestock at the regional level. In 2013, these covered 73 million hectares of agricultural land, which is almost half of the total crop area. The insurances are provided by 25 eligible private corporations, while the costs for the premium are shared between the central government, the regional governments and the agricultural producers themselves. There are some variations in the triggers for payment claims, as these are decided at the regional level (for example, in the Shandong Province the yield losses for wheat should be higher than 40%). [79] The percentage of subsidies also varies for different agricultural commodities, but cover the premiums for a minimum of 60% for crops and 70% for livestock. [80]

Subsidies for agricultural insurance have expanded in recent years, and China has become the second largest agricultural insurance market in the world, after the United States. Contributions of the central government amounted to 3.6 billion dollar in 2013, while 33.7 billion households benefited from these insurance schemes for an amount of 3.4 billion dollars. [81]

e) Australia

Australia is an important producer and exporter of agricultural commodities and has a consistently large surplus for agro-food trade. Since the 1980s, the country’s market price support to its agricultural producers has been gradually eliminated and replaced by more targeted payments. As the tariffs on imports of agriculture and food products are also very low, the Australian farming industry is now strongly market-oriented. [82]

Today, the Australian agricultural policy is mainly focused on assisting farmers to manage several production risks. While half of the agricultural budget is also spent on support to general services, environmental conservation, and R&D programmes, the main policy instruments to prevent severe income losses for farmers consist of disaster assistance and tax concessions. [83]

As Australian farmers are occasionally confronted with extreme weather conditions (such as cyclones, bushfires, hail storms, floods and droughts), these risks are addressed by various disaster assistance programmes implemented by the central and local governments. [84]

The Natural Disaster Relief and Recovery Arrangements (NDRRA) is a long-standing framework that partially reimburses farmers who are confronted with damage resulting from a broad range of natural disasters (excluding droughts). The regional and local governmental levels are given flexibility to develop their own programmes within this framework, while the indemnities themselves are paid by the central government if certain thresholds are exceeded. Reimbursements usually involve 50% of the losses, and are triggered for ‘small disasters’ if the damage in a state exceeds 170 000 dollars, and for ‘severe impact events’ if these are approved by the Australian Prime Minister. [85]

In 2014, a number of additional assistance measures have been introduced through the Intergovernmental Agreement on National Drought Program Reform between the federal, state and territory governments. This new approach replaced the existing arrangements for droughts and is now focused on different causes of financial hardship for farmers. In particular, the Farm Household Allowance programme was created to provide income support payments to farmers who experience financial hardship, regardless of its reasons (so not limited to natural disasters). The reimbursements of this programme do not rely on triggers, but depend on the financial position of each farm, which is determined by a Farm Financial Assessment. [86]

The Intergovernmental Agreement of 2014 also extended several tax concessions to agricultural producers. There is now improved access for farmers to the Farm Management Deposits Scheme, which aims to smoothen income fluctuations for farmers and improve their long-term financial security. The amount of money on these deposits should be at least 700 dollars and not more than 285 000 dollars, and is exempt from several tax obligations. Moreover, the Farm Finance Concessional Loans Scheme was extended, providing additional concessional loans with subsidised interest rates in a number of states. These loans can be used for debt restructuring, to fund operating expenses, and for drought recovery and preparedness activities. Finally, tax incentives are also provided to promote investments and sustainable production systems. [87] [88]

In 2014, the Australian government spent 157 million dollars on disaster assistance programmes and 308 million dollars on tax concessions, and together these programmes amount to more than half of the total agricultural policy budget of 830 million dollars. [89]

  1. Conclusion

Due to market conditions and climatic factors, prices for agricultural products tend to fluctuate significantly, causing a high level of income uncertainty for farmers around the world. These variations in price and income were especially high in the last decade, which triggered a renewed debate on possible ways to tackle these issues.

Against this background, this report focused on the policies and instruments used in the leading agricultural countries and regions to support farmers in managing these risks. This analysis demonstrated that the evolutions in agricultural policies have significantly diverged between the major agricultural countries. [90]

On the one hand, developing countries have generally evolved from taxing their agricultural sector in the 1990s to providing significant levels of support to their farmers. For instance, Brazil eliminated its import substitution policy in the 1980s and 1990s, and now protects its farmers against sharp drops in revenues through rural credit programmes, minimum price guarantees, and agricultural insurance subsidies. China has also significantly increased its agricultural support in the last decade, and currently adopts a broad range of support measures, including minimum guaranteed prices, ad hoc market interventions, tariffs, subsidies, and increasing financial support for insurance schemes.

On the other hand, the historically high level of price support in developed countries has been replaced by less market-distorting policies. In the EU, the traditional price support policy of the CAP was dismantled throughout several reforms, and direct decoupled payments are now the main policy tool that shield European farmers from severe income fluctuations. Initially, the United States underwent the same transformation from price support schemes towards direct payments, yet these were completely eliminated with the Farm Bill of 2014. Instead, the US agricultural policy for the period 2014-2018 continues to promote the use of agricultural insurance through several state-supported programmes. Australia has also gradually adapted a more market-oriented approach, supporting its farmers dealing with production risks through disaster assistance programmes and tax concessions.

Finally, special attention has been devoted in this report to agricultural insurance schemes. While the United States and China currently have the largest agricultural insurance markets in the world, and Brazil and Australia have consistently increased their support for these instruments in the last years, agricultural insurances are still underdeveloped and diverge widely between the EU member states. Despite the fact that the 2009 and the 2014 CAP reforms introduced instruments to reinforce agricultural insurances, these are currently still weak ‘options’ for member states rather than full-fledged programmes. However, this situation might change in the future, as the European Commission has the opportunity to step up these instruments in the context of the mid-term evaluation of the CAP in 2018


ADDITIONAL REFERENCES

AGRI-VIEW, How does the margin protection program impact dairy producers, http://www.agriview.com/news/dairy/how-does-the-margin-protection-program-impact-dairy-producers/article_f57408ae-5f8e-5820-9895-0defc34f2eae.html.

Ahmed, O. and Serra, T. ‘Economic analysis of the introduction of agricultural revenue insurance contracts in Spain using statistical copulas’, Agricultural Economics, Vol. 46, No. 1, 2015, pp. 69-79.

Antón, J. and Kimura, S. ’Risk Management in Agriculture in Spain’, OECD Food, Agriculture and Fisheries Papers, No. 43, pp. 1-63.

Australian Government, Farm Household Allowance, http://www.humanservices.gov.au/customer/services/centrelink/farm-household-allowance.

Australian Government, Natural Disaster Relief and Recovery Arrangements,
http://www.disasterassist.gov.au/FactSheets/Pages/NaturalDisasterReliefandRecovery Arrangements.aspx.

Bielza, M. et al., ‘Risk Management and Agricultural Insurance Schemes in Europe’, JRC Reference Reports, 2009, pp. 1-27.

DG Agriculture, Agricultural Insurance Schemes, 2008.

Dönmez, A. and Magrini, E. ‘Agricultural Commodity Price Volatility and its Macroeconomic Determinants’, JRC Technical Reports, 2013, pp. 1-27.

DTB Associates, Agricultural Subsidies in Key Developing Countries, 2014.

European Commission, ‘Overview of CAP Reform 2014-2020’, Agricultural Policy Perspectives Brief, No. 35, 2013, pp. 1-10.

European Commission, Trends in EU-Third Countries trade of milk and dairy products, 2015.

European Parliament Think Tank, Comparative Analysis of Risk Management Tools supported by the 2014 Farm Bill and the CAP 2014-2020, 2014.

FAO, Food and Nutrition in Numbers, 2014, p. 8.

FAO, Price Volatility in Food and Agricultural Markets: Policy Responses, 2 June 2011.

FAPDA, Country Fact Sheet on Food and Agricultural Policy Trends, April 2014.

Garcia, R. Rural Insurance in Brazil, http://thebrazilbusiness.com/article/rural-insurance-in-brazil.

GFDRR, Coping with losses: options for Disaster risk financing in Brazil, 2014.

Hofstrand, D. ’Can we meet the world’s growing demand for food?’, AgMRC Renewable Energy & Climate Change Newsletter, February 2014.

House of Commons, ‘The Common Agricultural Policy after 2013’, Fifth Report of Session 2010–11, 2011, pp. 1-79.

Jie, C. Li, Y. and Sija, L. ‘Design of Wheat Drought Index Insurance in Shandong Province’, International Journal of Hybrid Information Technology, Vol. 6, No. 4, 2013, pp. 95-104.

Landini, S. Agricultural risk and its insurance in Italy, 2015.

Ministry of Agriculture, Livestock and Food Supply, Brazil Agricultural Policies, 2008.

Nicholson, C. and Stephenson, M. ‘Dynamic Market Impacts of the Dairy Margin Protection Program of the Agricultural Act of 2014’, Working Paper Number WP14-03, 2014, pp. 1-33.

OECD, Agricultural Policy Monitoring and Evaluation 2015, 2015.

OECD, ‘Brazilian Agricultural Policy: Structural Change, Sustainability and Innovation’, OECD Food and Agricultural Reviews, 2015, pp. 83-101.

OECD, Innovation, Agricultural Productivity and Sustainability in Australia, 2015.

OECD-FAO, Agricultural Outlook 2015, 2015.

Swinnen, J., Knops, L. and Van Herck, K. ‘Food Price Volatility and EU Policies’, WIDER Working Paper, No. 32, 2013, pp. 1-33.

Tangermann, S. ‘Risk Management in Agriculture and the Future of the EU’s Common Agricultural Policy’, ICTDS Issue Paper, No. 34, 2011, pp. 1-41.

Tao, L. China’s Agricultural Insurance is Catching Up, July 2014.

World Bank, Government Support to Agricultural Insurance Challenges and Options for Developing Countries, 2010.


Notes

[1] J. Swinnen, L. Knops and K. Van Herck, ‘Food Price Volatility and EU Policies’, WIDER Working Paper, No. 32, 2013, p. 1.

[2] FAO, Price Volatility in Food and Agricultural Markets: Policy Responses, 2 June 2011, p. 6.

[3] FAO, Food and Nutrition in Numbers, 2014, p. 8.

[4] D. Hofstrand, ‘Can we meet the world’s growing demand for food?’, AgMRC Renewable Energy & Climate Change Newsletter, February 2014.

[5] S. Tangermann, ‘Risk Management in Agriculture and the Future of the EU’s Common Agricultural Policy’, ICTDS Issue Paper, No. 34, 2011, p. 11.

[6] Ibid., p. 4.

[7] Ibid., p. 2.

[8] A. Dönmez and E. Magrini, ‘Agricultural Commodity Price Volatility and its Macroeconomic Determinants’, JRC Technical Reports, 2013, p. 1.

[9] European Parliament Think Tank, Comparative Analysis of Risk Management Tools supported by the 2014 Farm Bill and the CAP 2014-2020, 2014, p. 13.

[10] Ibid, pp. 21-22.

[11] FAO, Price Volatility in Food and Agricultural Markets: Policy Responses, p. 11.

[12] Tangermann, op.cit., p. 3.

[13] European Parliament Think Tank, op.cit., p. 21.

[14] Tangermann, op. cit., p. 12.

[15] European Parliament Think Tank, op.cit., pp. 21-22.

[16] Tangermann, op.cit., pp. 21-22.

[17] Swinnen et al., op.cit., p. 33.

[18] European Parliament Think Tank, op.cit., pp. 21-22.

[19] Swinnen et al., op.cit., pp. 35-38.

[20] European Commission, ‘Overview of CAP Reform 2014-2020’, Agricultural Policy Perspectives Brief, No. 35, 2013, p. 4.

[21] European Parliament Think Tank, op.cit., p. 39.

[22] Swinnen et al., op.cit., pp. 61-62.

[23] House of Commons, ‘The Common Agricultural Policy after 2013’, Fifth Report of Session 2010–11, 2011, p. 34.

[24] European Parliament Think Tank, op.cit., p. 39.

[25] Swinnen et al., op.cit., p. 68.

[26] European Parliament Think Tank, op.cit, pp. 55-56.

[27] Ibid., pp. 47-48.

[28] European Parliament Think Tank, op.cit., p. 39-46.

[29] Tangermann, op.cit., p. 21.

[30] J. Antón and S. Kimura, ‘Risk Management in Agriculture in Spain’, OECD Food, Agriculture and Fisheries Papers, No. 43, p. 22.

[31] M. Bielza et al., ‘Risk Management and Agricultural Insurance Schemes in Europe’, JRC Reference Reports, 2009, p. 10.

[32] Ibid., pp. 12-13.

[33] O. Ahmed and T. Serra, ‘Economic analysis of the introduction of agricultural revenue insurance contracts in Spain using statistical copulas’, Agricultural Economics, Vol. 46, No. 1, 2015, p. 70.

[34] Antón and Kimura, op.cit., p. 21.

[35] Ibid., pp. 22-24.

[36] S. Landini, Agricultural risk and its insurance in Italy, 2015, p. 41.

[37] Bielza et al., op.cit., p. 13.

[38] DG Agriculture, Agricultural Insurance Schemes, 2008, pp. 192-200.

[39] European Parliament Think Tank, op. cit., pp. 29-30.

[40] Ibid., p. 19.

[41] Ibid., pp. 33-34.

[42] European Commission, Trends in EU-Third Countries trade of milk and dairy products, 2015, p. 25.

[43] C. Nicholson and M. Stephenson, ‘Dynamic Market Impacts of the Dairy Margin Protection Program of the Agricultural Act of 2014’, Working Paper Number WP14-03, 2014, p. 1.

[44] AGRI-VIEW, How does the margin protection program impact dairy producers, http://www.agriview.com/news/dairy/how-does-the-margin-protection-program-impact-dairy-producers/article_f57408ae-5f8e-5820-9895-0defc34f2eae.html.

[45] European Parliament Think Tank, op.cit., pp. 34-36.

[46] Ibid., pp. 13-14.

[47] FAPDA, Country Fact Sheet on Food and Agricultural Policy Trends, April 2014, p. 1.

[48] OECD, Agricultural Policy Monitoring and Evaluation 2015, 2015, pp. 88-91.

[49] OECD-FAO, Agricultural Outlook 2015, 2015, p. 62.

[50] OECD, op.cit., p. 87.

[51] European Parliament Think Tank, op.cit., p. 37.

[52] OECD-FAO, op.cit., p. 93.

[53] OECD, op.cit., p. 86.

[54] OECD-FAO, op.cit., p. 94.

[55] OECD, ‘Brazilian Agricultural Policy: Structural Change, Sustainability and Innovation’, OECD Food and Agricultural Reviews, 2015, pp. 88-89.

[56] OECD, Agricultural Policy Monitoring and Evaluation 2015, op.cit., p. 218.

[57] European Parliament Think Tank, op.cit., p. 38.

[58] FAPDA, op.cit., pp. 2-3.

[59] OECD, Agricultural Policy Monitoring and Evaluation 2015, op.cit., p. 90.

[60] OECD-FAO, op.cit., p. 94.

[61] DTB Associates, Agricultural Subsidies in Key Developing Countries, 2014, p. 2.

[62] OECD, Agricultural Policy Monitoring and Evaluation 2015, op.cit., p. 91.

[63] OECD, Brazilian Agricultural Policy: Structural Change, Sustainability and Innovation, op.cit., p. 88.

[64] Ministry of Agriculture, Livestock and Food Supply, Brazil Agricultural Policies, 2008, p. 26.

[65] OECD, Brazilian Agricultural Policy: Structural Change, Sustainability and Innovation, op.cit., p. 88.

[66] OECD, Agricultural Policy Monitoring and Evaluation 2015, op.cit., p. 91.

[67] World Bank, Government Support to Agricultural Insurance Challenges and Options for Developing Countries, 2010, p. 106.

[68] R. Garcia, Rural Insurance in Brazil, http://thebrazilbusiness.com/article/rural-insurance-in-brazil.

[69] GFDRR, Coping with losses: options for Disaster risk financing in Brazil, 2014, p. 42.

[70] OECD-FAO, op.cit., p. 95.

[71] OECD, Agricultural Policy Monitoring and Evaluation 2015, op.cit., pp. 113-114.

[72] Ibid., p. 116.

[73] DTB Associates, op.cit., 2014, p. 2.

[74] OECD, Agricultural Policy Monitoring and Evaluation 2015, op.cit., p. 117.

[75] Ibid., pp. 112-119.

[76] Ibid., pp. 114-117.

[77] Ibid., p. 121.

[78] Ibid., p. 119.

[79] C. Jie, Y. Li and L. Sija, ‘Design of Wheat Drought Index Insurance in Shandong Province’, International Journal of Hybrid Information Technology, Vol. 6, No. 4, 2013, p. 100.

[80] L. Tao, China’s Agricultural Insurance is Catching Up, July 2014, p. 17.

[81] OECD, Agricultural Policy Monitoring and Evaluation 2015, op.cit., p. 120.

[82] Ibid., pp. 79-80.

[83] Ibid., p. 82.

[84] OECD, Innovation, Agricultural Productivity and Sustainability in Australia, 2015, p. 109.

[85] Australian Government, Natural Disaster Relief and Recovery Arrangements,
http://www.disasterassist.gov.au/FactSheets/Pages/NaturalDisasterReliefandRecovery Arrangements.aspx.

[86] Australian Government, Farm Household Allowance, http://www.humanservices.gov.au/customer/services/centrelink/farm-household-allowance.

[87] OECD, Innovation, Agricultural Productivity and Sustainability in Australia, op.cit., pp. 110-113.

[88] OECD, Agricultural Policy Monitoring and Evaluation 2015, op.cit., pp. 78-83.

[89] OECD, Innovation, Agricultural Productivity and Sustainability in Australia, op.cit., p. 109.

[90] OECD, Agricultural Policy Monitoring and Evaluation 2015, op.cit., p. 1.

A European policy in need of overhaul or adaptation?

Reformed in 2014 with the aim of greater clarity and in line with the expectations of European society, is the current CAP a robust policy response to the challenges which the European Union must overcome in the next 15 years?

By tying 30% of direct aid to the issues of environmental sustainability and climate, and considering the resources allocated to rural development policy, the reformed CAP aimed to respond to one of the two faces of sustainability, while maintaining optimisation as a central objective.

The second side of the societal challenge is that of food sustainability; in other words, the challenge of global food security and the responsibility that the European Union must assume in overcoming it.

In responding to this issue, those areas of the world with the capacity to do so, including the European Union, are confronted with a number of same challenges:

  • the challenge of sustainable and consistent agricultural and industrial investments
  • the challenge of integrating innovation and effective technologies
  • the challenge of market volatility, and ensuring that it does not interrupt the continued growth of production.

Understanding the inseparability and mutuality of these two components – environmental sustainability on the one hand, and economic sustainability on the other – is the primary condition for ensuring sustainable development and effective public policy.

Without farmers, there can be no effective environmental management in Europe; without the sustainable management of natural resources, there can be no response to the necessary development of agricultural production.

As it exists today, does the Common Agricultural Policy pass the dual test of economic and environmental efficiency necessary to place the agri-food sector on a path to a renewed and sustainable competitiveness, combining growth, conservation, and modernity?

The world in which we live has changed, and our society is characterised by the fragility of limited natural resources, the dangers of climate change, and the globalisation, volatility, and instability growing in our agricultural and food markets.

In this context, our global agricultural partners have adapted the capacity of their public policies to respond to such threats. While the European Union led a reform which is, above all, social, is has yet to fully address the economic component. To date, the European Union remains committed to the principles and tools stemming from the MacSharry and Fischler reforms.

The breakup of world agricultural markets which took place in 2007 has not yet been accounted for in European agricultural policy. Concurrently, European agricultural productivity has stagnated for two decades, leaving in its wake the comparative competitiveness of European industries.

If CAP simplification is bandied as a magic word, would it not be appropriate to target the efficiency of a policy requiring a new lease of life: more European and more united, more sustainable, more economical, and more modern?

In this context, three key words seem pertinent: Resilience, Sustainability, and Investment.

Market Resilience

Insurance tools, financial tools, regulatory tools: Potential solutions for the strengthened resilience of the European agri-food sector

Key issues:

  • sanitary and climatic risks;
  • market risk (strong price variation, sudden closures of markets due to emerges or loss of consumer confidence);
  • Objectives:
    • Foster European growth, unhindered by one or several of these factors.
    • Promote the sustainability of European agriculture:
      • based on a model firmly rooted in local and familial decision-making centres
      • which fulfils the twofold task of food production and the production of public goods demanded by society.
    • Promote an agriculture simultaneously closer to the level of demand, better able to anticipate consumer trends, and supported by forward-looking investment strategies designed to preserve European agriculture’s existing positions and to win new ones on both domestic and international markets.

Which solutions are currently in place?

  • EU: basic direct payments, coupled payments, public intervention and private storage, emergency measures and crisis reserves, risk management in the CAP’s second pillar (insurance and mutual fund for production risks, income stability measures);
  • Other major world regions: support for production centred on insurance products and margin/price insurance; and/or support based on policies of price guarantees, income tax, tax instruments.
  • What is the relative effectiveness of public policies as instruments of reaction/adjustment to shocks in volatile markets?
    • Budgetary efficiency? The ratio of public budget mobilised and money benefiting farm activity:
      • EU direct support, coupled support: partially captured by land prices, inputs (materials and current inputs), costs of services, downstream effects.
      • Insurance systems: lessons from existing systems: CAN, US, ESP, FR
    • Economic efficiency? reactivity to crises
      • EU direct support: distorting effect on economic reality ßà basic direct support (excluding aids for public goods)? Annual income support and lump sum for each farm:
        • Either fully required in average years for the economic stability of the farm, in which case it cannot be described as a ‘reserve margin’ to deal with market crises
        • Or, in some cases, captured in part by the upstream and downstream of farming activity and, in others, as an incentive to adopt systems of farming which are integrated with current income.
      • EU market regulation tools:
        • Intervention price:
          • Beef: system currently inoperative;
          • milk, cereals: highly disconnected from the development of production costs. Activated by significantly lower market prices than anti-crisis systems of EU competitors.
        • Private storage: a palliative to an ineffective system of public intervention if activation by the Commission is realised at a sufficiently high level of market price, with attractive aid to the cost of storage, in the knowledge that its management should avoid paying for usual private storage not linked with crisis.
        • Crisis reserve and crisis measures: significant reaction time; assessment of measures put in place: a decision based on political impact rather than economic effectiveness; reluctance of services of the Commission to activate the crisis reserve and emergency schemes.
        • 2nd pillar crisis management measures: rudimentary implementation. Analysis of obstacles to the implementation of the income stabilisation tool (non-sectoral, threshold of 30% minimum loss on the farm…)

Which tools should be developed for the future?

  • Future markets: overall response, or a response designed on a sector-specific level and for particular types of farmers?
  • Insurance products (climate and health): what are the additional needs?
  • Tools for the analysis of markets and trends, and reinforced tools for promotion and marketing across all markets?
  • tools to address market crises:
    • income insurance/margin insurance and/or physical management of stocks (intervention, private storage aid)?
      • Physical storage: what is its potential in an open market? Can we combine a system of public intervention and intervention price versus world prices, transportation costs, and EU tariff protection?
    • Level 1 – EU : Guaranteed average production costs? Basic insurance by sector (?), European and free? with a guarantee on the basis of what criteria? :
      • Average gross operating surplus – by production plant?
      • margins?
      • or basic prices?
      • Which levels to define at EU-level?
      • on an individual basis? based on regional indicators? national? European?
      • European interannual budgetary flexibility, or creation of a European fund financed each year by a defined portion of the CAP budget (role of funds: management and control of requests?   borrowing capacity?)
      • Interface for farmers? (via Member States, via insurance firms or banks?)
      • How efficient will these measures be in budgetary terms?
    • Level 2 – EU: to guarantee a preselected positive margin (X%) or a certain income level (X EUR).
      • Additional insurance or mutual funds?
      • Sectoral approach? European devices (unitary or regionalised), or rather national or regional?
      • Level of EU co-financing for each additional margin,revenue, EBITDA, or price (according to a set criteria)?
      • EU’s room to manoeuvre in the WTO
  • A reinsurance system for private insurers?
  • tax treatment of savings in mutual funds?
  • Calibrating levels 1 and 2 and budgetary impact of a ‘redistributive’ CAP between Member States?
  • A balanced and responsible food chain:
    • Capacity of upstream agricultural activities to exercise effective bargaining power within the chain
      • critical analysis of the provisions relating to the most advanced sectors
      • Recommendations for greater efficiency: to what extent a commitment by the industry, and to what extent of a legislative nature?

Possible actions for the short term (reaching full capacity in 2018):

  • Improved food chain law, adjustment for milk and sugar, extension for other sectors.
  • Engage the CAP towards a dynamic policy of guaranteed revenues/EBITDA/margins.
    • Readjust the tools of the 2nd pillar regarding risk management: recalibration
    • Decide on funding transfers from the first to the second CAP pillar of X%, dedicated exclusively to financing risk management tools and support tools and/or strategies of investment to achieve a smart agricultural sector.

Sustainability and Remuneration for Public Goods

  • Which public goods are required and expected by society?
    1. Open rural areas
    2. Production: regional growth and jobs
    3. Related impact on growth of other sectors: tourism, services sector, and industry (with common service providers)
    4. ability to increase production in the face of the global food challenge (geopolitical problem of primary importance)
    5. Responses to the highest demands of European society (welfare, social standards, production standards, GMOs, genetics, growth factors…, rural areas for public enjoyment…, healthy food and nutrition education)
    6. Soil/air/water management:
      1. Environmental quality and the fight against climate change
      2. production capacity for future generations
  • Costs and remuneration:
    1. Not remunerated by today’s market
    2. Unlikely to be remunerated in the short- or medium-term. Opposition between need for public goods and market orientation and related competitions between the different regions of global production (with varying expectations, requirements, and standards) which incite a short term vision of profit maximisation and cost minimisation.
    3. The need to provide compensation to the producer: to legislate without compensation will not be an effective and coherent response. It would involve a loss of biodiversity by a dual movement of concentration and abandonment by zone, and/or a drastic decline in production, contrary to contributing to food security requirements.
      1. Role for public authority, which must assume its social and economic choices and its responsibility for territorial management
  • Possible responses
  1. With regard to the “environmental public goods” component, can we address the need to move towards an objectives-based policy ?
    • What are the conditions and steps to move from an obligatory system of methods defined by rules (with all the complexities linked to the ensuing demands for national flexibility) to a policy instead characterised by the results which it hopes to achieve:
    • In this context, two schemes are conceivable (one being exclusive of the other):
      • Either based on the ergonomics of the current greening policy, to recognise the use of smart agriculture techniques as a means of fulfilling all greening requirements,
      • Or abandon the principles of the rules defining which modes of cultivation are permitted, and instead install farm emissions accounts with a definition of outcomes to be achieved but without prescribing the means of implementation required to do so.
  2. For post-2020, the possibility of developing one single scheme which responds to environmental issues, climate change, and the socio-economic sustainability of certain regions/sectors of weak structural competitiveness:
    • one measure to respond to the challenge of providing public goods at the European level, allowing economic actors to decide and to mobilise the most appropriate means of achieving this.
    • one measure to punctually compensate the costs linked to the commitment to going beyond the basic in order to respond to specific regional issues
    • Support for investments for those going beyond (by necessity or by choice), and to provide (?) limited cash flow support (3 years?) during the period of economic adjustment.
    • one measure to address the structural lack of competitiveness of a region or of a specific sector in a region.
    • A measure to extend the concept of sustainability to the sustainability of consumption patterns, in particular by highlighting the educational and nutritional aspects.
  3. Today: greening carrying binding rules on the means of implementation, agri-environment measures, and aid for disadvantaged zones and sectors: payments for crop management to be implemented or maintained
  4. In terms of the CAP, this would imply :
    • Compensating for the additional costs related to:
      • the shortfalls of regional structural competitiveness
      • environmentally-friendly decisions made by companies which are not compensated by the market
    • Providing timely and limited in time responses to meet the additional challenges by support for necessary investments (material, immaterial, adaptation of structures of production)
  5. Recognise that maintaining and developing agricultural production, acting for the environment and for the climate emergency, and maintaining the values of the EU for agriculture and for European territory are three inseparable facets of the same issue, to be treated together in a common and unified European response?
  6. First scheme: farming techniques ensuring a successful agricultural sector which also meets ‘greening’ requirements.
    • In this context, is it possible to quantify the exact environmental benefits of using different techniques of?
    • If yes, could an overall equivalence to the greening requirements be defined and recognised as soon as a farm puts such techniques into practice ?
    • The rationality of the measure requires that the principle of trust in the individual (the farmer) once again becomes the basis of regulation and enforcement: the requirement would be to held these resources (directly or contractually) as it would go against the interests of the farmer not to implement them.
    • Farmers opting not to take part in the scheme would be required to implement the conventional greening measures (cropping patterns to apply as normal). These ‘classic’ measures are to be reduced in number relative to the measures and flexibilities granted by the existing regulation.
    • If the system is to remain based on the existing principles, the debate called for by NGOS (and for different reasons by certain agricultural organisations of the EU) on the environmental efficiency of the current measures should be managed. Some encourage discourse on the efficiency of the CAP budget, with demands for stricter requirements, which will undoubtedly be audible among politicians and opinion makers, even if their implementation contradicts the desperate need for simplification.
  7. 2nd scheme: Alter the paradigm of the CAP’s basic requirements on the environment and climate change, implementing a system based on farm emissions balance sheets. In this context:
    • This would cut short the idea of a ‘Greening 2’ consisting of reinforced constraints on agricultural practices, instead basing the system on its objective (of mastering/reducing the balance sheet of agricultural emissions) and in giving farmers the freedom to choose the means by which to achieve the defined objective. This involves answering a number of questions.
    • Is it possible, following the example of Ireland, to implement before 2020 at EU level a system of (commercial) agricultural emissions balance sheet? This would provide a clear image of the current situation in order to create an account of the emissions relating to the level of production on each farm.
    • What level of emissions or energy/carbon efficiency of production could become the basis of the environmental requirements of the CAP vis-à-vis farmers?
    • If such an option were considered, in light of the guidelines provided by the European Council of October 2013 on climate change:
      • Which criteria would be used to compare the levels reached by different farms: emissions by tonnes produced? Total balance sheet for carbon (emissions and storage) relating to production… ?
      • Which objectives should be assigned to Member States, and which to farms? Should the reduction efforts be assigned to Member States, allowing them to decide how targets may best be attained at farm level? Or should the CAP rather define the rules for the distribution of the reduction effort between farms?
      • If the reduction effort is managed directly by rules applying at farm level:
        • For farms (A) having ratios of emissions/tonne produced lower than the EU average for said production: decrease in the ratio of emissions per tonne produced of X% over the period?
        • For farms (B) with ratios of emissions per tonne higher than the EU average but less than a given ratio: to succeed by 2027 in reducing emissions to the EU average of the start of the period and a fall of X% over the period (the most ambitious clause applying to those ratios closest to the average).
        • For farms (C) falling above this upper limit, the obligation to fall below a maximum ceiling by the end of the period and to lower their ratio by a minimum of X%.
        • Leave it to farmers to decide upon the means to be implemented in order to achieve these objectives.
      • Implications, controls, and sanctions:
        • Level of aids per hectare; “basic compensation for public goods”’ to vary depending on the assigned category (A), (B), or (C)?
        • Is the annual monitoring of the emissions ratio realistic and practical?
        • Should compliance with commitments incorporate naturally occurring variables (weather, pests…) and thus be based on a triennial average?
        • In case of the alteration of the efficiency of a farm from one category to another (established a year in hindsight), implementation of an adjusted level of aid (with the same one-year gap)?
        • For farms remaining above the maximum ceiling at the end of the period, exclusion from compensation for provision of public goods ?
      • Support for investments made by farms to contribute to the reduction of their emissions: throughout the period, such investments should be eligible for support (co-financing), strengthened in the context of the CAP (see ‘Investments’ section below).
  • For the component on the sustainability of consumption patterns, establish programmes of distribution allowing the delivery of real ‘food stamps’ based on the American model, by promoting healthy eating in schools (school canteens) and public services (hospitals, canteen administrations, etc.), and with distribution to organisations for the poor. These food stamps would be subject to criteria of origin for such purchases.

Possible actions for the short term (reaching full capacity in 2018): Prepare the post-2020 system in order to bring greening into the 21st century as a tool reconciling production and environmental issues in the context of existing legislation:

  • simplify the current greening measures by:
    • reducing the number of available options,
    • revisiting the measures retained to make them clearer, less complex (work on proposals still to do), with an exchange:
  • According to the option chosen for the medium term (Scheme 1 or Scheme 2):
    • establish the requirement of a balance sheet of farm emissions (for those above a threshold of X hectares?) for 1 July 20XX (this date should be included in the period of validity of the current CAP) and decide the ‘sustainability’ options for the following CAP.
    • prepare it in such a way as to show the contributions of production techniques and their relevance regarding environmental quality and biodiversity objectives.
    • establish investments in agriculture as a funding priority, with adjustment of rural development programs and affect a portion of new 2nd pillar funds (see ‘Investments’ section below)
  • Decide on a 2 year extension (?) of the existing CAP regulations to allow a credible period for the preparation of the new configuration (durability as well as resilience and investment), and to ensure its consistence with the calendar of the renewal of the Commission and the EP.

An Investment Policy

Means and direction for continuing on a path to sustainable growth

What are the investment shortfalls by sector in the EU:

  • In meeting the challenge of competitiveness ?
  • In meeting the challenge of sustainability ?
  • Where are the laggards in the EU?
  • Analysis of investment required.
    • For increased productivity/competitiveness: is there a need for a European plan in order to stimulate a technological leap?
    • Costs and lifecycle of these investments, expected return on investment (financial conditions and parameters).
  • What is the current capacity of individual sectors to make these investments?
  • Critical analysis of the current system:
    • What are the existing European strategies for investment?
    • Involvement of sectors in the definition of sectoral investment policies?
    • How relevant are current financial incentives?
    • What support for applicants upstream and downstream of investment?
  • Can we define a European strategy for the catalysis of investments constituting levers for growth:
    • Priority sectors?
    • Which types of investments to prioritise?
    • Scale of intensity of public aid and EU co-funding:
      • Productive investments in sustainability
      • Other investments in sustainability
      • Technological leaps
    • Usefulness of short-term cash flow to support those farms investing? If positive, for which investments, and how?
  • Integrating the new economic environment of increased volatility of markets in need of investment:
  • Which financial tools are required for the making of investments?
    • Bank guarantees
    • Insurance ‘income loss, margin loss’? Analysis of the types of potential measures (taking over annuities, end of annuities, redistribution of capital required, and covering of interest charges)? on which criteria?
    • Role of public support via the CAP?
    • Role of the European Investment Bank, commercial banks, and insurance companies?

Short term actions (to reach full capacity in 2018) :

– Focus on investments considered as the priority for European agriculture (method combining performance and sustainability?) and focus extra resources of 2nd pillar (financed by transfer from 1st to 2nd pillar) only support measures for those investments and for reformed 2nd pillar measures for the management of crises.

The EU Food Chain and its Contribution to Health: How to Overcome the Challenges?

Abstract: On October 26, 2015 the WHO’s International Agency for Research on Cancer has announced that it has added processed and red meat on its list of carcinogenic substances. Only three decades ago, read meat was categorised as one of the most valuable foods in most states’ nutritional guidelines. Now it is apparently a risk to human health. 

This discussion paper aims to shed light on the question regarding whether such classifications of regulatory bodies are mere outlier cases, or are part of a wider trend towards increasingly viewing the agri-food chain under the sole perspective of public health and neglecting cultural, economic and leisure aspects of food consumption. A closer look soon reveals the increasing dominance of public health rationales when regulating food.

References from the United Kingdom or Ireland show that alcohol and certain food categories are increasingly treated as hazardous products, like tobacco, proposing “risk management tools” such as labelling standardisation, incl. Health Warning standards, advertising restrictions, taxation and price measures. 

Consequently, the question is to what extent the  EU agri-food chain can be part of the solution, and what can it contribute to balance the debate in order to include economic, cultural and behavioural effects of regulation in the equation? Finally, this paper aims to provide food for thought inter alia, as to how impacts ofregulation on consumer behaviour can be measured in a more comprehensive way, and what the European contribution should be to this issue.

Food is above all a source of life. But, apart from that, food and beverages do much more than simply providing humans the Screen Shot 2015-11-16 at 18.13.24
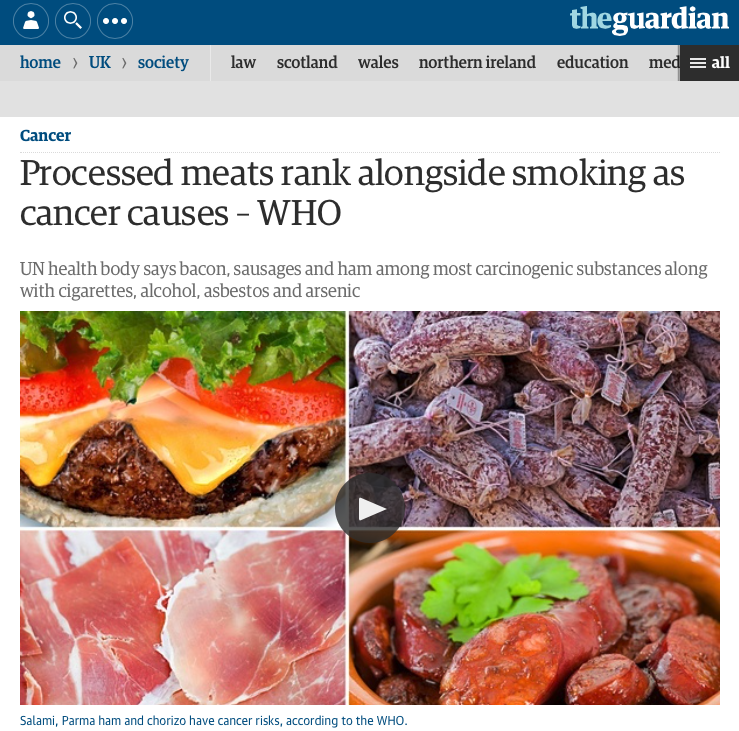
fuel for survival. It offers culture, tradition, one of the most important sources of economic activity, employment and innovation in Europe; it is choice, friendliness, variety…
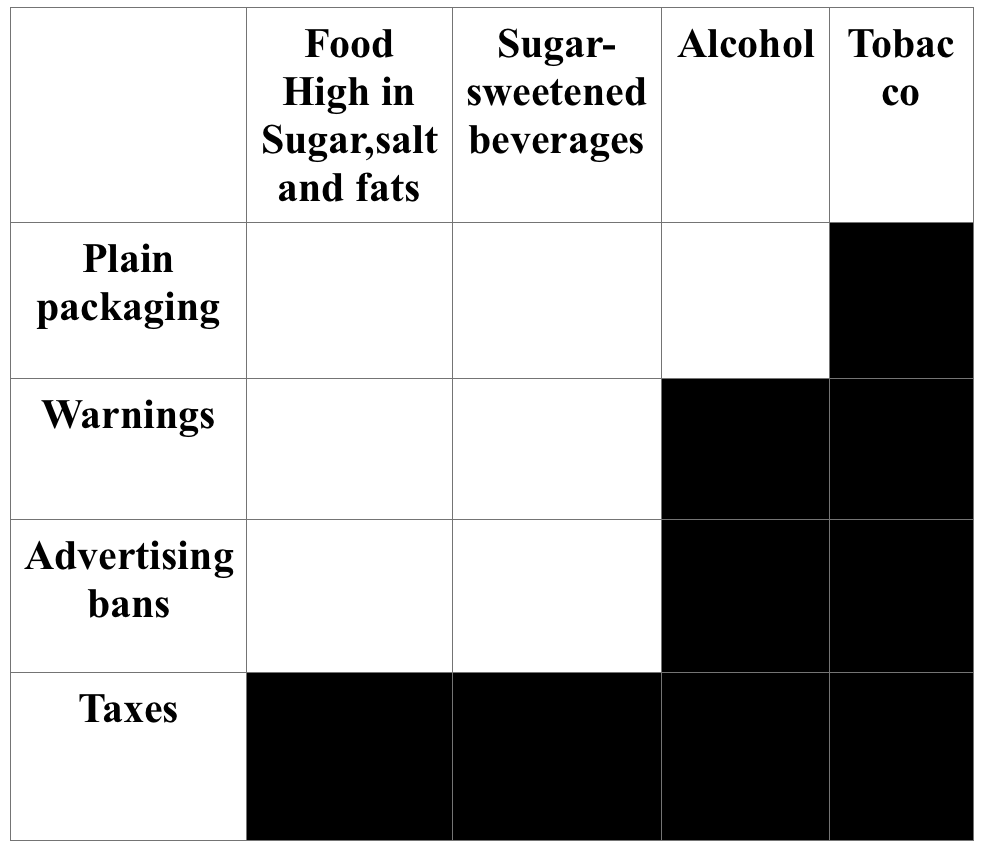
In the last decades, science has shed light on what we eat, and has shown that food is a critical factor for human health. Particular importance has been given to its relationship with Non-Communicable Diseases (NCDs) like obesity, cholesterol, diabetes, cancer, coronary diseases and others related, making diet a priority for public health.

Public authorities all over the world have tried to curb problems related to nutrition – not only through public health, but also via society, economics, finance and politics- through different initiatives.

The most significant, recent, worldwide initiative has been the “Global Strategy on Nutrition, Physical Activity and Health” from the World Health Organization (WHO) approved in 2004. Seven years later, United Nations signed the “Declaration on prevention and control for Non Communicable Diseases” providing both a set on recommendations and action plans to guide and influence national policies against harmful effects of food and drink on human health.

Having in mind this global framework, the European Union has developed its own initiatives in four main areas:

  • Legislation: Even if health is not a fully European policy, the E.U. has the objective of ensuring a high level of human health protection in the definition and implementation of all Union policies and activities. At the same time, Internal Market and Consumer Protection are the basis for regulations in different areas such as labelling and food information to consumer, nutrition and health claims, advertising;
  • Cooperation with stakeholders, through the E.U.platform for Health and Physical Activity and the European Alcohol and Health Forum in order to share best practices, information, data and research, etc;
  • Coordination with national authorities. Initiatives like the Committee on National Alcohol Policy and Action (CNAPA), to encourage cooperation and contribute to policy developments;
  • Support to education programs via the €150 million School Scheme Fund included in the Common Agricultural Policy, focusing on the distribution of fruits, vegetables and milk to children in the EU.

Finally, at national level, Member States are not lagging behind regarding such initiatives, and even go further, offering a wide variety of measures ranging from legislation, to self- regulation codes, taxes, prohibitions… Sometimes going far beyond the common European framework and thus affecting the internal market.

“A short review of the stakeholders may give us a brief idea
of the intensity of the debate – and its polarisation”

The issue of food and health has gained importance on the European political agenda, and, at the same time, is a rather sensitive topic. All stakeholders take active part in the debate, attempting to influence and pass through their visions and positions to the different institutions.

A short review of the stakeholders may give us a brief idea of the intensity of the debate -and its polarisation.

  • The media: in general terms, messages and opinion published around food and drink are mostly negative. Diseases, economic burden, inequality, pandemics… all are issues very often linked to food and beverages in the media, transmitting a somehow distorted vision –or at least unbalanced reality-, which damages the public image and credibility of the whole food chain. There is only one exception: when it comes to gastronomy, it seems that people perceive food and beverages as something positive, enjoyable, and attractive. There is a measure of separation between public and personal perceptions.
  • Science: nutrition has exploded in recent years, making food, its composition, and its effects on health an area of special interest for science. On the contrary, other areas of research, like genetics or the influence of physical activity, or even others like environment, do not attract the same level of interest. It seems clear that good evidence – based policy making depends – at least in part – on good research and evidence. But sometimes it happens that science is mixed with politics, making it harder to reach a consensus on core issues, and contributing to confusion amongst consumers.
    From the Daily Mail, report on Jamie’s Oliver statement asking Cameron to be “brave” and stand up to junk food bosses


  • Economic sectors:  the whole food chain is affected by this issue, from production to industry, to distribution and Horeca. They all take part in the production of food and beverages which are to be consumed by the population, at home or out. Many different initiatives are in place – self-regulation codes, voluntary agreements, information and education campaigns, voluntary labeling schemes, physical activity programs, research funding…-, and continue to undergo development. The industry side is the most active link of the agri-food chain in this sense, even if sometimes their efforts are not fully recognised or are surrounded by scepticism.
  • NGOs and activists: consumer organisations and other NGOs have been traditionally relatively active when it comes to the food sector, but the issue of food and health has attracted its interest and participation in the public debate to an even greater extent. But the “newcomers” are the activists, working individually or in coalitions, with rather new and aggressive communication techniques in search of a place and erupting with extreme proposals, the effectiveness of which have not been proven.

The new transparency policy embraced by the European institutions has opened the way to this new group of stakeholders, even if they raise some doubts about its representativeness amongst the other groups of civil society.

“It is questionable whether health arguments can be assumed
to supersede other (fundamental) rights”

International Organisations continue working on new proposals. One of the most active is WHO,
which recently produced a document on “Sugar intake for adults and children”, and is preparing another one on childhood obesity.

The OECD has been also very active, especially on the side of alcohol, with its recent paper “Tackling Harmful Alcohol Use”, with the collaboration and support of the FAO and WHO, thus showing a new feature of cooperation between international organisations that will be a growing trend in the next future.

Back to the European Union, several issues are on the table and provoking lively debates. On the regulatory side,  application of Regulation 1169/2011 on Information to Consumer via national schemes, like the UK traffic lights system, raises the question of compatibility with EU Law. Nutritional profiles, as conceived by Regulation1924/2006 haven’t seen the light -after six years-, and the European Parliament is divided, with a high number of Members asking the Commission to withdraw this model due to its lack of scientific basis, possible discriminatory effects, and potential dangers to the international market. Similarly, the Danish “fat tax” was unilaterally removed by the local authorities, and subject to an investigation opened by the EC for its possible anti-EU law effects.

With the EU placing great emphasis on the importance of the Intellectual Property Rights (IPRs) – the protection of intellectual property rights is an essential element for the success of the Single Market , not only for promoting innovation and creativity but also for developing employment and improving competitiveness – and some of the proposed public health measures potentially undermining this protection, it is questionable whether health arguments can be assumed to supersede other (fundamental) right.

Finally, it is worth mentioning that twenty public health organisations recently resigned from the European Alcohol and Health Forum, in protest against the European Commission’s refusal to submit a new alcohol strategy.

“In the EU, the most active level is the national one”

But, as it has been said before, the most active level is the national one. Several examples are worth mentioning in order to gain a better idea of what is at stake.

  • France: the draft “Loi Santé” is due to be voted on in the plenary session of the National Assembly in the coming weeks. Its chapter on prevention puts together tobacco, alcohol, and food, with special provisions for each of the sectors heading generally for further restrictions.
  • Ireland: A Parliament Committee on Health and  Children backed last June the government´s approach to introduce a minimum unit price (MUP) for alcohol, as well as other measures like a “social responsibility levy” to capture some of the profit that may arise from introducing a MUP to fund awareness and addiction programs, health warnings on alcohol packaging with similar rules to those controlling tobacco labels, bans on the advertising of either retail discounting or multi-buy alcohol promotions, etc.
  • Scotland has already voted in similar laws, but they are being fought through the EU Court of Justice after challenges from the Scotch Whisky Association and several major wine-producing countries and Associations. In the General Advocate’s opinion a member State can impose a minimum price, which restricts trade and distorts competition, only if this system is superior to an alternative measure (increase taxation)
  • Latvia has become the latest EU country to ban      trans fats, joining ranks with Austria, Hungary, and Denmark. The prohibition will enter into force in 2018, for both domestically produced and imported food. In the same line, but on a voluntary basis, BEUC, EPHA, CPME, EHN and four major food companies have sent a letter to the Commission requesting a legislative limit to TFAs in food.

“The European food chain is facing one of its most important challenges, if not the greatest it has seen”

There is no doubt that the European food chain is facing one of its most important challenges, if not the greatest it has seen.

In search of a solution, many theories have been applied, from the “Nanny State” –prohibition, taxes and minimum unit pricing, restrictions to advertising and communication- to self-regulation measures –EU pledge, voluntary measures on reformulation, warnings,…- and new proposals like behavioral science –“nudge theory”. But one thing seems clear, and that is that “business as usual” is not the right way to overcome the challenge.

Amongst others, some questions need to be answered if the food chain wants to be not only part of the problem, but also contribute to the solution. In order to participate and enrich the debate, Farm Europe will propose in the coming weeks key questions to be answered to have a coherent and efficient policy in Europe with regard health and labelling.

table public health policy path

How will we feed the world in the next decades? An analysis of the demand and supply factors for food

There have always been predictions and concerns about the ability of agriculture to meet the global demand for food. In as early as 1798, Thomas Malthus made a pessimistic analysis of this issue in his groundbreaking ‘Essay on the Principle of Population’. He started from the observation that the global population would continue to rise exponentially, while the production of food could only be increased in a more limited way. As a result, he predicted that mankind would eventually be unable to feed an increasing number of people, leading to famine, war and misery. [1]

Fortunately, this ‘Malthusian catastrophe’ never took place on a global scale. Because of an increase in agricultural productivity due to technological innovations, the production of food was able to keep pace with demographic growth in the last two centuries. [2]

However, today there are renewed concerns that global food production will be increasingly challenged by a growing demand for agricultural products.

This revived interest in the resilience of the agricultural sector was driven by several recent events and phenomena, such as increasingly variable weather conditions due to global warming and large variations in food and energy prices. These are only some of the factors which could place an unprecedented pressure on the global food system in the future. [3] Within this context, it is important to gain a better understanding of how we may achieve food security for the next decades.

This article aims to offer insights into this topic by providing an overview of the major factors which will drive the global demand and supply for food, as well as some of the obstacles for the agricultural sector to respond to these challenges. In order to do this, it will present an analysis of data and projections provided by several researchers and international organisations, and in particular the Food and Agriculture Organisation of the United Nations (FAO).

In the first chapter, the two key drivers for food demand will be discussed, namely global population growth and changing consumption patterns. As these two developments will significantly increase the worldwide need for food, an estimate will be made on how much additional production of agricultural commodities these evolutions would require.

The second part will examine how the supply of food could be increased in order to respond to this surge in food demand. The three possible solutions which will be considered are an expansion of the land for food production, an increase in the agricultural productivity, and further investments in the agricultural sector.

Finally, some additional issues will be addressed that could impact the ability of agriculture to meet the future food needs. These include the limited access of farmers to finance, the fluctuations in the prices for agricultural commodities, and food wastage.

  1. Rising food demand and its driving forces

Population growth

The main evolution that will increase the demand for food is a continued rise in the number of people on our planet. While the world’s population consists of 7.3 billion people today, the UN projects that this number will increase by 1.2 per cent annually, amounting to 8.5 billion people in 2030 and almost 10 billion people in 2050 (see Graph 1). [4]

Screen Shot 2015-11-17 at 12.15.16

Most of this population growth is projected to occur within the developing countries, and especially in Africa and Asia (see Table 1). [5] Of the additional 1.15 billion people that will be added to the global population between now and 2030, 46% will be added in Asia and 42.79% in Africa. In the longer term, Africa is expected to be the largest contributor, accounting for more than half of the global population growth by 2050.

Screen Shot 2015-11-17 at 12.15.33

Additionally, Latin America and the Caribbean, Northern America, and Oceania are expected to have only minor increases, while Europe is the only continent that will see its population decrease in the future.

Because these demographic projections have a high degree of certainty, it is inevitable that the world’s population will grow rapidly in the short to medium term. As a result, this will lead to a major increase in the consumption of food in the coming decades and will impose profound challenges to meet the global demand for agricultural products. [6]

Consumption patterns

Global population growth will be accompanied by a change in consumption patterns of people worldwide, and especially of those living in developing countries. The two major factors driving this transformation in food consumption will be the rising incomes of these individuals and a trend towards increased urbanisation. [7]

First, the rising incomes of the people living in developing countries will stimulate dietary change, as they will be increasingly capable of buying high-quality food. [8] Secondly, urbanisation is expected to accelerate in both the developed and developing world, in the sense that there will be large movements of people moving from rural to urban areas. Between now and 2050, the share of the world’s population living in urban areas is expected to rise from 50% to 70%. [9] This increased urbanisation will prompt additional transformations in the lifestyles and consumption patterns of people. [10]

As a result of these two developments, global diets will become increasingly similar, since people who were living mainly on vegetable diets will now consume more meat, fish, dairy products, fruits and vegetables. This pattern is already emerging in the Asian developing countries today. [11]

Screen Shot 2015-11-17 at 12.16.27In terms of protein consumption, this will imply a global shift from plant-based to animal-based sources of proteins (see Figure 1). In this respect, a report made by BIPE argues that the developing world will continue to undergo a ‘first dietary transition’ in the next 15 years. This means that the overall demand for proteins will continue to increase in these regions. Initially, this will be caused by a higher consumption of plant-based proteins, but these will be increasingly replaced by more animal-based protein sources. On the other hand, the developed world will experience a ‘second dietary transition’: their demand for proteins has already stabilised and their consumption of plant-based proteins is expected to increase again. However, it is difficult to predict how the demand for animal-based proteins will evolve within these developed regions, as there will be diverging national trends. While the consumption of meat will stabilise in some high-income (the ‘US transition’), the demand for animal-based proteins might decline in others (the ‘French transition’) (see Figure 2). [12]

Screen Shot 2015-11-17 at 12.17.23

In general, however, it is expected that these dietary transitions will lead to a significant increase in the global demand for meat by 2030, as growing parts of the global population will be living in developing countries and/or urban areas. Since a rise in meat consumption requires higher inputs of feed grains and oilseeds, this transformation will also fuel the demand for other agricultural commodities. [13] As most of the developing regions do not currently have the means to realise this increase in meat consumption by themselves, global agricultural output will need to keep up with this surge in demand if food security is to be achieved.

The necessary increases in the production of agricultural commodities

As a consequence, a growing population with changing consumption patterns will result in a sharp growth in the future demand for food. [14] According to several estimates (see Table 2), the global supply of food will have to increase by almost 30% by 2030 and around 50% by 2050 if it wants to equal the rise in global demand.[15]

Screen Shot 2015-11-17 at 12.17.57

In terms of the main agricultural commodities, the additional volumes which will be required to feed the world’s population are substantial. The table below lists the expected change in demand for food for the next 15 years. Among others, global production will have to increase with 18% for cereals, 21% for sugar, 26% for vegetable oil, 25% for meat and 23% for dairy products between now and 2030. [16]

Screen Shot 2015-11-17 at 12.18.30

  1. Possibilities for additional food supply

Expanding the amount of agricultural land for food production

On the supply side of the equation, the first possibility to increase food production is by expanding the amount of farmland. According to global estimates made by the FAO, between 2010 and 2030 52 million hectares (Mha) of arable land will be added to the 1534 Mha which are already being exploited. This will amount to a rise in agricultural surfaces of 3.4% in 20 years.

However, the FAO also expects significant geographical divergences in the evolution of these farmlands. The mobilisation of additional land will mainly take place in the developing countries: there will be an increase of 53 Mha in Sub Sahara Africa, 31 Mha in Southern and Central America, 22 Mha in South East Asia and 5 Mha in Oceania. However, this expansion will be partly offset by a decline in agricultural surfaces in the developed countries: these will diminish by 32 Mha in Northern America, 13 Mha in Europe and 14 Mha in Southern Asia (see Figure 3). [17]

Screen Shot 2015-11-17 at 12.19.08

Therefore, the possibilities for further increases in arable land appear to be rather limited, since less additional land can be brought into production than in the past (see Figure 4). This means that an expansion in production area alone will probably not be
sufficient to meet the increasing demand. [18]

Screen Shot 2015-11-17 at 12.19.37

Moreover, it is likely that the agricultural surfaces in developing countries will be adversely affected by climate change. Since these countries are situated in zones where food production is rather vulnerable to variable weather conditions, the impact of climate change on temperatures, rainfall and weather disasters could pose a serious threat to their agricultural production capacities. On the other hand, the agricultural sector in developed countries, where farmland is expected to diminish, will be less susceptible to the effects of climate change due to better natural conditions and the use of up-to-date technologies. [19]

In short, while climate change will disadvantage the regions where more suitable land can be exploited, agricultural surfaces will shrink in the areas where weather conditions produce a higher stability. Therefore, the geographical shift in farmland could make the food supply more variable, resulting in a bigger volatility in the prices of agricultural products. This will especially be the case if developing countries are unable to improve their technologies and developed countries fail to increase their agricultural productivity growth. [20]

Increasing agricultural productivity

Meeting the future demand for food will also depend to a large extent on our ability to maintain or increase the current levels of agricultural productivity. Essentially, an increase in productivity is achieved when less agricultural input is needed to produce the same amount of agricultural output. In other words, improved agricultural productivity means a rise in the amount of agricultural output per unit of agricultural input. [21]

A common indicator for agricultural productivity is the agricultural Total Factor Productivity (TFP), which describes the ratio of agricultural output (crops and livestock) to their input (such as land, labour and machines). Similarly, an increase in TFP means that with the same amount of agricultural input, more agricultural output can be produced. [22]

More specifically, if the global food supply has to increase with 50% by 2050, as estimated by the FAO, this would imply an annual TFP growth of 2% for the next 35 years, provided other elements remain equal. However, this seems to be a difficult task if we look at the annual rates in TFP growth for the last decades.

As the tables below indicate, the world’s agricultural Total Factor Productivity only had an annual growth rate of 0.99% from 1961 until 2007. Moreover, this global estimate involved diverging trends between the global regions. For instance, the transition countries of the former Soviet Union only experienced marginal increases in TFP growth until the end of the 1990s, followed by a strong rise in growth rates of 1.92% from 2000 until 2007. On the contrary, in developing countries the annual TFP growth rate experienced a constant increase until the 1990s, after which it slowed down to almost 2% per year for 2000-2007. The developed countries also peaked in the 1990s, achieving an annual growth of more than 2%, but slowed down afterwards to 0.86% for 2000-2007 (with annual growth rates of only 0.59% in Europe and 0.33% in the US and Canada). In general, this means that in nearly every region of the world, past TFP growth rates fell short of the expected annual 2% productivity rise in the future. [23]

Screen Shot 2015-11-17 at 12.20.37

Screen Shot 2015-11-17 at 12.21.38Apart from Total Factor Productivity rates, some estimates have also expressed the
necessary short-term productivity rise in terms of the yields per agricultural area. According to the FAO, each hectare of agricultural surface has fed an additional 0.4 people per decade since 1960, and this trend should continue in the future to meet global demand for food. Since each hectare of farmland was feeding 4.5 people in 2010, this means that one hectare should provide enough food for 4.9 people by 2020 and 5.3 people by 2030 (see Figure 5). [24]

Screen Shot 2015-11-17 at 12.22.05

However, past performances do not guarantee that agricultural productivity will continue to rise at the same pace in the future. On the contrary, it is likely that productivity rates of developed countries will continue to grow more slowly than in the 20th century. [25] For example, data provided by DG Agriculture and Eurostat shows that while annual agricultural TFP growth was still 1.6% in the European Union between 1995 and 2002, productivity rates stagnated in the last decade, growing only by 0.6% per annum over the period 2002 to 2011. Only the new EU member states managed to achieve a significant TFP growth rate (1.6%) within this period, yet they account for only a minor share of total agricultural output in the EU. [26]

If agricultural TFP continues its sluggish growth in the European Union and the developed world, this could result in shortfalls for the necessary supply of agricultural products. Since the long term agricultural TFP growth is mainly determined by the level of private and public investment in agriculture, this will be an important element in meeting the growing global food demand by 2050.

Further investments in agriculture

Agricultural investments have played an important role in the growth of the food supply through technological progress, and they will be crucial for achieving a sustainable food production in the future. [27]

Screen Shot 2015-11-17 at 12.22.45

The majority of investments in agriculture are made by farmers, who purchase machinery, buy and/or raise animals, plant crops, improve their land, etc. The next largest source of investment are national governments, followed distantly by foreign private and public investors (see Figure 6). [28] Data made available by the FAO shows that in developing countries, investments by farmers are more than three times larger than the other sources of investment combined. [29]

Essentially, when farmers make investments, they give up certain things now (such as money and time) in order to build up capital that will allow them to become more productive in the future. As a result, these investments are a crucial determinant for agricultural productivity and production. [30]

A useful proxy for these private agricultural investments is the agricultural capital stock (ACS) per worker. In this sense, a higher rate of agricultural productivity can only be achieved through an increase in the amount of capital per worker. [31]

Yet according to the FAO, global ACS per worker has declined at an average annual rate of 0.5% in the last decades (from 1980 until 2007). This was caused by a slower growth in the agricultural capital stock (+ 0.6% per year) than the increase in agricultural workers worldwide (+ 1.1% per year) (See Table 6). [32]

Screen Shot 2015-11-17 at 12.23.27

In high-income countries, the ACS per worker has increased rapidly at an average annual rate of +3%. This was not the result of a rapid increase in capital investments (+ 0.2% per year), but rather due to a large decline in the number of workers in the sector (- 2.9%). On the other hand, the capital-labour ratio diminished at an annual rate of 0.3% in low- and middle-income countries. In particular, Sub Sahara Africa experienced declining capital levels per worker (- 0.6%) as a fast growth in its agricultural labour force outpaced its increases in agricultural capital stocks. Moreover, there was a stagnation of the capital-labour ratio in South Asia since the capital stock and labour force were rising at more or less the same rate. This indicates that investments have been stagnating in absolute terms in high-income countries, while they have declined in relative terms in the lower and middle-income countries, and especially in Sub Sahara Africa and Asia.

This suggests that investments have been in relative decline in the lower and middle-income countries, and especially in the regions with the highest rates of undernourishment today, Sub Sahara Africa and Asia. The amount of agricultural investments should be increased significantly in order to boost food production and to eradicate hunger in these regions in a sustainable way. [33]

Moreover, not only has there been a small relative decrease in global private agricultural investments, but the worldwide growth in public spending on agricultural research and development (R&D) is also slowing down. As the figure below indicates, the annual growth rate in global public agricultural R&D spending has been diminishing steadily for the last four decades. In most of the regions of the world, this growth fell from rather high rates in the 1970s to significantly lower rates in 1991 to 2000, often close to zero. [34]

Screen Shot 2015-11-17 at 12.23.50

This is rather surprising, since many economic studies have concluded that agricultural R&D investments can have high economic and social returns, as they are able to increase productivity and reduce poverty over time. [35]

For instance, in 2014 Terrence Hurley and his colleagues conducted a meta-study in which they re-examined 2 242 investment evaluations made for different countries since 1958. They underlined that the internal rate of return (IRR) has been the predominant indicator to measure the returns on agricultural R&D investments, despite the fact that its methodology has been criticised by economists for decades.[36]

By using the modified internal rate of return (MIRR), which gives a more credible estimate on the annual interest rate paid by investments and corrects several methodological shortcomings of the IRR, they found an average annual return rate of 13.6% for agricultural R&D investments. [37]

Screen Shot 2015-11-17 at 12.24.11

If we look at this high return rate, it should be questioned why public agricultural R&D spending has been scaled back in many countries. The authors of this study state that if the growth rate in public spending continues to decline, the growth in agricultural supply will fail to meet growing food demand, which will put upward pressure on the food prices and further stress the world’s most vulnerable populations. [38]

To conclude, higher levels of investments by farmers and the public sector will be necessary to achieve global food security in a sustainable way. [39] Without these additional expenses, the production of food will probably not be able to keep up pace with a rising demand, especially in developing countries. [40]

Providing precise numbers of the necessary financial inputs to secure the global food supply is a difficult task. However, a set of reports made by the FAO estimated that, for developing countries alone, a net annual private investment of 83 billion dollars until 2050 would be necessary to strike a balance between the demand and supply for agricultural products. Additionally, the eradication of hunger by enhancing the resilience of the agricultural sector in these countries would require an extra public expenditure of 750 billion dollars in the next 15 years. [41]

Moreover, it should be noted that these figures do not even include the public and private investment needed to adapt to the effects of climate change and to achieve an environmental sustainable production system. Since it often takes a considerable amount of time before the impact of investments for agricultural productivity is fully realised, these expenditures need to be made soon in order to secure the global food supply by 2050. [42]

  1. Limiting factors for the balance between food demand and supply

Access to finance for small-scale farmers

Globally, around 500 million people can be categorised as small-scale farmers, since they possess not more than two hectares of arable land. As these smallholders constitute the vast majority of farmers in developing countries and feed a large part of the rural poor, global food security will continue to depend on their ability to supply agricultural products. [43]

However, small-scale farmers, and in particular those living in developing countries, face numerous challenges, such as low levels of productivity, restricted access to markets for their products, and especially the limited availability of finance. [44]

The two figures below, which are based on data provided by the World Bank, illustrate the limited access to finance of people living in developing countries. While these data represent the general access to finance across different regions and are therefore not specific to farmers and agriculture, they can nevertheless serve as a good indicator. They show that the presence of financial institutions and the utilisation of financial services is significantly lower in Sub Sahara Africa and South Asia, especially in comparison with high-income countries. [45]

Screen Shot 2015-11-17 at 12.24.55

Additionally, when farmers in developing countries do have the possibilities to lend money, they are often forced to do so at very high interest rates, since financial institutions face several risks in providing their services there. Furthermore, loans for agriculture are severely underrepresented in the lending activities of commercial banks in these regions. For example, while agriculture is a key economic activity in Africa, employing more than half of the population, only 1% of commercial lending is used for the agricultural sector. [46]

Screen Shot 2015-11-17 at 12.25.19

Improving the access to finance for small-scale agriculture in developing countries is therefore an important challenge for the future, since the lack of funds prevents farmers from investing in technologies which could make their production more efficient and could reduce the levels of hunger and poverty within these regions. Better financing possibilities for these farmers could also help them to adapt to the effects of climate change and increase the resilience of their agriculture, which would contribute to global food security in the long run. [47]

This raises important practical questions on how we should improve this access to finance in these regions. How can we mobilise investments in developing countries in order to build value chains to the benefit of rural economies and local farming? How can we make the contributions of private investors, public development aid and (pan-)regional investment banks compatible? And how should we promote good governance practices to ensure a stable investment environment in these countries?

Price fluctuations for agricultural commodities

In the last two decades, food prices have been more volatile than in the preceding two decades, and these high fluctuations are likely to continue in the future. Indeed, as the graph below [48] shows, the prices of most agricultural commodities have been increasingly volatile in the last decade. [49]

Screen Shot 2015-11-17 at 12.25.46

Similarly, Figure 11 indicates that the implied volatility, which is a measure for the expected price volatility among market participants, has increased significantly for the major crops in this period. [50]

Screen Shot 2015-11-17 at 12.26.10

These large variations in prices have a number of negative consequences, as they create a high level of uncertainty among producers and consumers. Moreover, they are especially problematic for farmers and households in low income countries. Since food accounts for a large proportion of their income and budget, both the welfare of these households and the viability of their agricultural production can be threatened by excessive price volatility. On the one hand, producers are more concerned about the prospect of low prices, since a lower income may threaten their viability in the long term. On the other hand, the ability of poor households to ensure their nutrition and other basic needs (such as education and health care) can be compromised when food prices are high. [51]

Additionally, farmers are less willing to invest in productivity-raising assets when prices are unpredictable, and this may encourage them to take sub-optimal investment decisions in the long term. [52] [53] Periods of price depression are a major problem for farmers who have recently made investments, both in developing and developed countries, and these may prevent them from making the necessary contributions to tackle the global food security challenge.

It is likely that these high variations in agricultural prices will persist in the future, as they will be influenced by the changes in the demand and supply factors described in the previous chapters of this article. Additionally, climate change may result in worsening production conditions for the most vulnerable regions, which could lead to even higher levels of price volatility. [54] As these developments are likely to increase the frequency of future crises in the agricultural sector, policy responses should be initiated at the macro-level, and they will need to include tools to help stabilise agricultural revenues and install a favourable climate for sustainable investments.

Food waste and food loss

A final issue that affects the supply-demand balance is food wastage, which refers to the decrease in the amount of food throughout the food chain. The FAO makes a distinction between ‘food loss’, which occurs at the production and processing level, and ‘food waste’, which takes place at the final stages of the food chain, namely the retail and consumption level. Food waste and loss have various causes and occur in many ways, but the general outcome is a lower availability of food for all people. [55] [56]

In 2011, the FAO gave significant visibility to this issue by estimating that around one third of the food produced is lost or wasted worldwide, amounting to 1.3 billion tons per year. In terms of each commodity group, 20% of dairy products and meat, 30% of cereals, 30% of fish and almost half of fruit and vegetables are produced, but never consumed. [57]

Screen Shot 2015-11-17 at 12.26.44

While these rates are as high in industrialised countries as in developing countries, these two types of countries also differ in important ways. On the one hand, food losses occur more in developing countries: they mainly face post-harvest and production losses because of insufficient infrastructures, poor storage facilities and lower technological capacities. On the other hand, food waste mainly takes place within industrialised countries. In these parts of the world, restaurants, households and stores are primarily responsible for these losses, because of plate waste and throwing away food which is spoiled or does not meet aesthetic standards.

Nevertheless, in both types of countries food is wasted between the initial agricultural production and the final consumption. [58]

The magnitude of this problem should not be underestimated, and is it not only an ethical issue. It also leads to a major squandering of limited natural resources and needless greenhouse gas emissions, which contribute to climate change and global warming. This means that eliminating waste could significantly reduce the existing pressures on the earth’s resources, such as land, water, and soil. [59]

Moreover, it is an obstacle for global food security. If food wastage can be reduced, a smaller increase in production would be needed to meet the rising demand in the next decades. For example, if we would reduce half of the food wastage by 2050, agricultural production would only need to rise with 25 percent by 2050, instead of the 50% estimated by the FAO. [60]

In short, reducing food waste and food loss could help to improve food security and diminish the pressure on the environment. In this respect, there is a shared responsibility for the actors who produce and process the food (such as farmers and food processors), those who make them ready for consumption (such as the retail sector), and finally the consumers themselves.

Surmounting the challenge of food losses and food waste will require significant investments in infrastructure, as well as increased agricultural know-how in developing countries and major changes in consumer behaviour in developed countries. Even so, the question remains how we can determine realistic targets for the reduction of food wastage which could help us to address the food challenges in the near future.

  1. Conclusion

This article examined some of the dimensions that will determine the ability of agriculture to respond to the future demand for food. It should be highlighted that this overview is not exhaustive, as several relevant aspects (such as biofuels) have been excluded from the analysis. Nevertheless, it aims to provide enough elements to stimulate a discussion on how the demand and supply factors for food may evolve in the next decades.

This study began by observing that the two major drivers of future food demand, namely a growing population and changing consumption patterns, will significantly increase the demand for food in the coming decades. This will require a substantial additional production of agricultural commodities, as the global supply of food will have to increase by almost 30% by 2030 and by around 50% by 2050 if it wants to meet the rise in global demand.

Since the possibilities for further increases in farmland appear to be rather limited, expanding the food production will largely depend on our ability to maintain or increase the current levels of agricultural productivity. This proves to be a difficult task, as historical growth rates in productivity have been lower than the expected productivity rise in the future. Moreover, it is unlikely that this productivity growth can be achieved if private investments keep declining relatively and public spending on agricultural R&D continues to slow down worldwide.

Additionally, some elements have been highlighted that could further hinder the balance between food demand and supply. As small-scale farmers have limited access to finance, fluctuations in agricultural prices remain high, and the amount of food wasted and lost is substantial, tackling these obstacles will determine our ability to realise global food security.

This raises the question of how Europe can take its responsibility and shape the outcomes of these global evolutions. The findings of this article suggest that it should not act as a helpless bystander, but rather play the role of an active participant by promoting public and private investments in agriculture, taking policy measures to manage price volatility, and increasing its efforts to reduce global food waste.

Furthermore, we should also consider how we can produce enough food for more than seven billion people without putting unsustainable pressures on our planet. A significant growth in the supply of agricultural products should be realised, but this will put increasing strains on our natural resources, which are already severely degraded. This issue becomes even more compelling if we take into account the effects of climate change on food production, such as higher temperatures, more variable weather conditions, and a higher occurrence of floods and droughts.

Meanwhile, as the regions most vulnerable to the impact of climate change continue to have the highest levels of undernourishment and are expected to have the largest increase in population growth, ensuring the food supply should also involve efforts to eradicate hunger in these parts of the world. While this does not mean that we are expecting a Malthusian catastrophe to occur in the next decades, it underlines how important it will be for agriculture to meet these daunting challenges.

References

Alexandratos, N. and Bruinsma, J. ‘World Agriculture Towards 2030/50: The 2012 Revision.’, ESA Working Paper, No. 12-03, 2012.

Bagherzadeh, Inamura, M. and Jeong, H. ‘Food Waste Along the Food Chain’, OECD Food, Agriculture and Fisheries Papers, No. 71, 2014.

Beintema, N. and Elliott, H. Setting meaningful investment targets in agricultural R&D: Challenges, opportunities, and fiscal realities, 2009.

BIPE and Avril, The Oil and Protein Sectors as a Solution for Meeting Global Challenges in 2030, December 2014

Conforti, P. ‘Looking ahead in World Food and Agriculture’, FAO Report, 2011.

European Commission, Food Waste,
http://ec.europa.eu/food/safety/food_waste/index_en.htm.

European Parliament, Options for Sustainable Food and Agriculture in the EU, November 2013.

FAO, Food and Nutrition in Numbers, 2014.

FAO, Global agriculture towards 2050, 2009.

FAO, Price Volatility in Food and Agricultural Markets: Policy Responses, 2 June 2011.

FAO, Save Food: Global Initiative on Food Loss and Waste Reduction, http://www.fao.org/save-food/resources/keyfindings/infographics/fish/en.

FAO, The state of food and agriculture: investing in agriculture for a better future, 2013.

Fuglie, K. ‘Total factor productivity in the global agricultural economy: Evidence from FAO data’, in J. Alston, B. Babcock and P. Parday (Eds.), The Shifting Patterns of Agricultural Production and Productivity Worldwide, Ames, Midwest Agribusiness Trade and Research Information Center, Iowa.

Gardner, B. Global Food Futures: Feeding the World in 2050, London, Bloomsbury, 2013.

Hofstrand, D. ‘Can we meet the world’s growing demand for food?’, AgMRC Renewable Energy & Climate Change Newsletter, February 2014.

Hofstrand, D. ‘More on feeding nine billion people by 2050’, AgMRC Renewable Energy & Climate Change Newsletter, January 2012.

Hurley, T. et al., ‘Re-examining the reported rates of return to food and agricultural research and development’, American Journal of Agricultural Economics, Vol. 96, No. 5, 2014, pp. 1312-1323.

International Finance Corporation, Access to Finance for Smallholder Farmers: Learning from the Experiences of Microfinance Institutions in Latin America, 2014.

Keating, B. et al., ‘Food wedges: Framing the global food demand and supply challenge towards 2050’, Global Food Security, Vol. 3, No. 3-1, p. pp. 125-132.

Maggio, N. et al. Global Food Security 2030: Assessing trends with a view to guiding future EU policies, 2015.

Matthews, A. What is happening to EU agricultural productivity growth, 4 May 2014.

Pardey P. et al., Investments in and the Economic Returns to Agricultural and Food R&D Worldwide, Academic Press, New York, 2014.

Rosegrant, M. ‘Global Food Security: Challenges and Policies’, Science, Vol. 302, No. 5652, 2003, pp. 1917-1919.

 The Telegraph, Gloomy Malthus provides food for thought as world’s appetite builds, http://www.telegraph.co.uk/finance/comment/liamhalligan/8363500/Gloomy-Malthus-provides-food-for-thought-as-worlds-appetite-builds.html.

 United Nations, World Population Prospects: the 2015 Revision, New York, United Nations, 2015.

World Bank, ICT in Agriculture: Connecting Smallholders to Knowledge, Networks, and Institutions, November 2011.


[1] The Telegraph, Gloomy Malthus provides food for thought as world’s appetite builds, http://www.telegraph.co.uk/finance/comment/liamhalligan/8363500/Gloomy-Malthus-provides-food-for-thought-as-worlds-appetite-builds.html.

[2] M. Rosegrant, ‘Global Food Security: Challenges and Policies’, Science, Vol. 302, No. 5652, 2003, p. 1917.

[3] P. Conforti, ‘Looking ahead in World Food and Agriculture’, FAO Report, 2011, pp. 1-2.

[4] United Nations, World Population Prospects: the 2015 Revision, New York, United Nations, 2015, p. 2.

[5] Ibid.

[6] B. Gardner, Global Food Futures: Feeding the World in 2050, London, Bloomsbury, 2013, p. 7.

[7] Rosegrant, loc. cit.

[8] D. Hofstrand, ‘Can we meet the world’s growing demand for food?’, AgMRC Renewable Energy & Climate Change Newsletter, February 2014.

[9] FAO, Global agriculture towards 2050, 2009, p. 1.

[10] D. Hofstrand ‘More on feeding nine billion people by 2050’, AgMRC Renewable Energy & Climate Change Newsletter, January 2012.

[11] Gardner, op. cit., p. 4.

[12] BIPE and Avril, The Oil and Protein Sectors as a Solution for Meeting Global Challenges in 2030, December 2014, pp. 6-7.

[13] Gardner, op. cit., p. 68.

[14] A. Maggio et al., Global Food Security 2030: Assessing trends with a view to guiding future EU policies, 2015, p. 9.

[15] N. Alexandratos and J. Bruinsma, ‘World Agriculture Towards 2030/50: The 2012 Revision.’, ESA Working Paper, No. 12-03, 2012, p. 7.

[16] B. Keating et al., ‘Food wedges: Framing the global food demand and supply challenge towards 2050’, Global Food Security, Vol. 3, No. 3-1, p. 128.

[17] BIPE and Avril, op. cit., p. 14.

[18] Alexandratos and Bruinsma, loc. cit.

[19] Maggio et al., op. cit., p. 6.

[20] FAO, Price Volatility in Food and Agricultural Markets: Policy Responses, 2 June 2011, p. 11.

[21] European Parliament, Options for Sustainable Food and Agriculture in the EU, November 2013.

[22] Hofstrand, 2012, loc. cit.

[23] K. Fuglie, ‘Total factor productivity in the global agricultural economy: Evidence from FAO data’, in J. Alston, B. Babcock and P. Parday (Eds.), The Shifting Patterns of Agricultural Production and Productivity Worldwide, Ames, Midwest Agribusiness Trade and Research Information Center, Iowa, pp. 85-89.

[24] BIPE and Avril, op. cit., p. 16.

[25] FAO, op. cit., p. 2.

[26] A. Matthews, What is happening to EU agricultural productivity growth, 4 May 2014.

[27] P. Pardey et al., Investments in and the Economic Returns to Agricultural and Food R&D Worldwide, Academic Press, New York, 2014, p. 79.

[28] FAO, The state of food and agriculture: investing in agriculture for a better future, 2013, p. 9.

[29] FAO, op. cit., p. 11.

[30] Pardey et al., op. cit., p. 95.

[31] FAO, op. cit., p. 15.

[32] FAO, op. cit., p. 18.

[33] FAO, op. cit., p. 19.

[34] N. Beintema and H. Elliott, Setting meaningful investment targets in agricultural R&D: Challenges, opportunities, and fiscal realities, 2009, p. 7.

[35] FAO, Price Volatility in Food and Agricultural Markets: Policy Responses, 2 June 2011, p. 16.

[36] T. Hurley et al., ‘Re-examining the reported rates of return to food and agricultural research and development’, American Journal of Agricultural Economics, Vol. 96, No. 5, 2014, pp. 2-3.

[37] Hurley, op. cit., pp. 4-12.

[38] Ibid., p. 12.

[39] FAO, The state of food and agriculture: investing in agriculture for a better future, 2013, pp. 36-37.

[40] Gardner, op. cit., p. 13.

[41] FAO, Price Volatility in Food and Agricultural Markets: Policy Responses, 2 June 2011, p. 16.

[42] Pardey, op. cit, p. 79.

[43] International Finance Corporation, Access to Finance for Smallholder Farmers: Learning from the Experiences of Microfinance Institutions in Latin America, 2014, p. 5.

[44] Ibid.

[45] World Bank, ICT in Agriculture: Connecting Smallholders to Knowledge, Networks,

and Institutions, November 2011, p. 153.

[46] World Bank, op. cit., pp. 152-153.

[47] International Finance Corporation, Ibid., p. 1.

[48] FAO, The state of food and agriculture: investing in agriculture for a better future, 2013, p. 99.

[49] FAO, Price Volatility in Food and Agricultural Markets: Policy Responses, 2 June 2011, pp.7-9.

[50] Ibid., p. 8.

[51] Ibid., p. 6.

[52] FAO, Food and Nutrition in Numbers, 2014, p. 8.

[53] Hofstrand, 2014, op. cit.

[54] FAO, Price Volatility in Food and Agricultural Markets: Policy Responses, 2 June 2011, p. 11.

[55] FAO, Food Loss and Food Waste, http://www.fao.org/food-loss-and-food-waste/en.

[56] European Commission, Food Waste, http://ec.europa.eu/food/safety/food_waste/index_en.htm.

[57] FAO, Save Food: Global Initiative on Food Loss and Waste Reduction, http://www.fao.org/save-food/resources/keyfindings/infographics/fish/en.

[58] FAO, Price Volatility in Food and Agricultural Markets: Policy Responses, 2 June 2011, p. 28.

[59] M. Bagherzadeh, M. Inamura and H. Jeong, ‘Food Waste Along the Food Chain’, OECD Food, Agriculture and Fisheries Papers, No. 71, 2014, p. 6.

[60] Hofstrand, 2012, op. cit.

TTIP: outline of a possible negotiation strategy for EU agri-food sector

The Transatlantic Trade and Investment Partnership (TTIP) negotiations were launched on June 17, 2013. 

TTIP aims at creating the largest Free Trade Area in the world, and at setting a host of harmonized standards between the two largest trading blocks. These common standards could, by the sheer size of the trade affected, become the de facto new world standards.

TTIPs expected level of ambition surpassed anything achieved so far, setting the pace for further trade deals and hopefully prompting other countries to move forward in the stalled WTO negotiations.

The impact of TTIP on the agriculture sector could be large, larger than any other free trade deal negotiated so far, and larger than what was expected out of the WTO Doha round (with the exception of domestic subsidies).

It is therefore hardly surprising that the reactions to the TTIP in the EU agricultural sector have been mostly cautious, defensive. The sector by and large fears the impact of concessions that could be made to a more competitive US agriculture.

Farm Europe attempts to go beyond the usual positioning, and to provide a more focused and realistic assessment of the deal. This paper also explores the dynamics of the negotiation. Some sectors might benefit, others will face additional competition. In particular with regard to those facing additional competition, Farm Europe outlines what could be done to improve the EU position.

The state of negotiations

Tariff offers were exchanged on February 10, 2014. However the initial drive to quickly conclude the TTIP negotiations (“in one tank”, as it was put at the time) has faced a set of roadblocks in a number of areas since 2014.

There were misunderstandings on what the level of ambition of the tariff offers exchanged should be, with the EU accusing the US of presenting an offer that could hardly be accepted as a basis for negotiation.

Also, a high-stake political controversy arose on the ISDS (Investor-State Dispute Settlement) chapter, with very active and vocal opponents within the EU to be found in some NGOs, and even in some mainstream political groups. That controversy found an echo across the Atlantic, with strong opposition to ISDS heard also from sectors in the US Congress.

The EU also felt a lack of commitment from the US side, explained by the fact that the US would have prioritised the conclusion of the TPP (Trans Pacific Partnership) negotiations.

The result of these drawbacks was that progress in the negotiations was lacklustre, to say the least.

Agricultural issues remain contentious, particularly those perceived as consumer safety issues – e.g. hormone treated meats, GMOs. The EU, at its highest level, was obliged to reaffirm that it would never accept imports of hormone treated meat, nor lower high EU safety standards.

Following the change in the Commission in late 2014, there was a new push to inject fresh momentum into the talks. It is still early days to evaluate the success of the new attempts to revive the talks, but there are indications that prospects are brightening.

The US President has finally obtained TPA (Trade Promotion Authority), which is seen as essential to conclude TPP and TTIP. TPA gives Congress the authority to only accept or reject in block a trade deal, preventing cherry-picking of parts, which was clearly a great concern for countries negotiating with the US.

The US and her TPP partners are now moving to the end game of the negotiation, which would free the US to turn its eyes towards the EU.

It is also to be expected that President Obama would like to leave these two very large trade deals as part of his legacy.

Therefore there are strong indications that TTIP negotiations are bound to resume and accelerate by the end of 2015, with a view to some form of conclusion in 2016.

Agricultural market access and regulatory issues will continue to be a major challenge for US and EU negotiators as they embark on more intensive negotiations.

Also of interest to these negotiations are recent farm policy reforms in both the EU and the US.

The results of EU CAP reforms, which have increased EU’s competitiveness for certain commodities (e.g., dairy and sugar), as well as the outcome of other EU FTA negotiations, in particular with Canada, are of significance to TTIP.

How far these developments will inform the EU negotiating position is an open question. It could be expected that they do not guarantee an ambitious result, in part due to concerns that further liberalisation might jeopardise the EU’s still fragmented farm sector. Moreover, EU farm organisations have taken keen note of the results of the recently agreed FTA with Canada (CETA), in particular with respect to beef and pork market access. When they extrapolate CETA to what might be the potential outcome of a FTA with the United States, a bigger and more powerful partner, they become more wary about providing additional concessions.

To compound these anxieties, and likely fierce resistance to any ambitious deal, these groups are also taking into account the offers exchanged with Mercosur, another big agriculture player. While conclusion of the Mercosur negotiations is not expected any time soon, there is a strong concern that, in the future, a deal might be reached at least with Brazil, a top agricultural exporter and competitor.

In this context, the negotiations with Japan could provide some breathing space for the most affected sectors, and help to counterbalance the impact of TTIP to a certain extent. Japan is a significant importer of meat and grain products, and the EU will play an offensive role on agriculture in this FTA.

In March 2013, the United States adopted a new farm bill, which modifies support programs for most field crops (wheat, maize, oilseeds, cotton, peanuts) by eliminating decoupled direct payments and introducing new risk management programs and encouraging the use of crop insurance, coupled with conservation requirements. US dairy support has become more market-oriented, reflecting the increasing competitiveness of this sector in world markets. Possible changes to US biofuel policy, in the form of a reduced renewable fuel standard, could also impact US crop production trends. While these policy reforms are unlikely to drastically change US market conditions, they are worth considering in the context of US farm sector expectations for these negotiations, particularly given EU largely higher tariffs and regulatory barriers.

Both the United States and the EU have complex domestic support systems, but neither side has agreed to negotiate domestic support policies in FTAs. Ironically, the U.S. justification for not negotiating on domestic support is that it will not agree to new disciplines if the EU is allowed to continue to support at high levels. While this objection could be addressed in a negotiation, neither side is likely to be motivated to negotiate domestic support.

The following summary identifies some of the key sectorial issues facing the agricultural negotiation and outlines Farm Europes positions and recommendations. It highlights the practical difficulties facing negotiators and the basic questions posed to policy-makers: how far will this Free Trade Agreement actually free up trade in protected agricultural sectors? Where do the most important EU offensive interest lie? And where is the EU more vulnerable? What are the most significant challenges and how can they be accommodated? 

General overview of Trade in Agriculture Products

In 2014, the EU had a nearly Euro 6 billion trade surplus in agriculture with the US.[1] This reflected a long-term trend of expanding exports of EU products and stagnant US imports, with the EU achieving a neutral trade balance in 1998, growing and maintaining a surplus for the next 8 years with no sign of change. In contrast, the United States has an almost $40 billion global agricultural trade surplus, while the EU has traditionally had a balanced trade account across the agricultural sector, with a very small trade deficit in 2012, the latest year for which data are available (Source: WTO).

In 2014, top US imports from the EU were spirits (Euro 3.3 billion), wine (Euro 2.8 billion), beer (Euro 1.2 billion), cheese and nonalcoholic beverages (Euro 0.7 billion each), and olive oil (Euro 0.7 billion). These are top EU exports globally, building on high quality food processing and strong brands.

Top US exports to the EU were led by oilseed products (Euro 2.3 billion), fruits and nuts (Euro 2.0 billion), spirits (Euro 0.7 billion), and wine and miscellaneous food preparations (Euro 0.4 billion each). Leading global US agriculture exports, such as beef, pork, poultry, dairy, maize, rice, and various fruits and vegetables were all less than Euro 200 million.

The simple average of US MFN agricultural tariffs is around 12%. The EU average is around twice that level (precise calculations are difficult, due to calculation methodologies for converting specific (e.g., Euro x/MT) tariffs into ad valorem equivalents (e.g., y %)). Studies generally show the average EU tariff to be two to four times the average U.S. tariff for agricultural products.

The EU has also to address a more diverse and fragmented sector than the US. A particular case at hand is that of the ultra-peripheral EU regions, where the economic and social fabric is particularly exposed to external pressures.

The EU is thus facing a paradox in TTIP: it benefits from a large and stable trade surplus with the US, but it has in general a less competitive and more protected agriculture.

Meat Products

The EU and the United States are roughly in trade balance in beef, pork and poultry products. Globally, the United States has exported over Euro 13 billion in these products per year, but exports to the European Union have never exceeded Euro 400 million. EU meat exports into the United States in 2014 were around Euro 600 million. While the US industry is a global leader in competitiveness, the EU focuses its exports on certain niches that exploit a strong reputation for high quality. In spite of the economic fundamentals, the surprising result of near trade balance in this sector is explained by high EU tariffs, low U.S. tariffs, gourmet consumers in the United States and SPS regulatory barriers.

US tariffs are relative low for these products (26% for beef outside of the large TRQ, and substantially lower for pork and poultry). EU tariffs are substantial, ranging from 40% to over 100% for most products. In addition, all three of these products face serious trade restrictions through sanitary barriers: the European Union bans beef treated with growth hormones (despite CODEX approval of these products and a WTO panel finding against the EU), bans pork treated with ractopamine (a growth promoter used in the United States and other meat exporters that has also been approved by CODEX), and bans U.S. poultry treated with pathogen reduction treatments, such as chlorine. Nevertheless, exporters in both the EU and the US have an interest in updating the bilateral veterinary equivalence agreement signed over 15 years ago.

The EU is eager to see BSE-related restrictions removed on its exports of beef products from all EU Member States, and for the US to recognise the EU as a single entity. US sanitary requirements are strong for pork and poultry also, but the EU has managed to service U.S. pork market niches with high priced products and is not considered competitive in poultry exports.

Different standards on animal welfare, which concern in particular the poultry and eggs sectors, are also an issue in the EU, where producers face higher standards and the related higher costs.

Tariff elimination in the meat sector would create a huge challenge for the EU meat and livestock sector, in particular if sanitary barriers were removed as well. The Commission (DG Agri) has estimated the elasticity of the European market to be around -5; a 20% reduction in tariffs could result in an increase in imports of approximately 100%.

As noted above, high tariffs are a constraint for US exporters, but sanitary barriers have effectively banned pork and poultry exports and limited beef exports to non-hormone production.

The EU has aggressively protected this sector in other FTAs, including in the recently-concluded agreement with Canada, but that did not prevent granting Canada preferential duty-free TRQs for pork (80,000 tons), beef (50,000 tons), and bison (3,000 tons). It is worth noting that these volumes were only reached at the last minute, and they do incorporate payment for Canadian concessions on GIs.

It should be underlined that although the EU is adamant not to accept imports of hormone-treated beef, it has accepted a TRQ for hormone-free beef. It should be expected that in TTIP the EU will also be obliged to grant significant market access to hormone-free US beef. No single sector will be excluded from the negotiations, and it is illusory to think that the beef sector, or other meat sectors, would be the odd exception. On the contrary, inclusion of beef and other meats is a necessary condition for the conclusion of TTIP from the US side, and the EU knows it.

Therefore, TTIP will inevitably have a significant impact on the EU meat sector, and in particular to the more exposed and fragmented beef production chain. The EU will have to open her beef market for hormone-free US beef, for volumes that will certainly not be lower than those agreed with Canada.

Any increase in imports will have a multiplied effect on the suckler cow sector: dairy cows constitute two-thirds of European supplies of beef to the common market. The supply of meat from the dairy cow herd is linked to the evolution of the milk market, the elasticity of this supply to the EU meat market being weak. Henceforth, the adjustments caused by the results of the TTIP negotiations will be above all bearing by the European industry of suckling cows.

The EU should rather anticipate the shock than pretend that it will not happen and try to manage its consequences ex-post. It is far better to prepare the sector to face more competition than to mend its consequences.

Farm Europe believes the key is to negotiate TRQs instead of accepting tariff elimination, and to buy enough time, through a long implementation period, to better structure the sector. In this context, the European Commission should be called to present a comprehensive plan without delay with appropriate financing means, to improve the structure of the sector, including producers and processors. 


Dairy Products

Dairy products are one of the leading EU exports to the United States, led by cheese (Euro 0.8 billion in 2014). US dairy exports to the EU totaled just over Euro 0.2 billion in 2014. Both sides have market access through lower duties on tariff-rate quotas, with the EU having substantial access to the US market through country-specific quotas obtained through the WTO. Out-of-quota duties in the United States generally range from 30% – 50%, while EU out-of-quota duties are generally in the 50% – 150%, with some as high as 250%.

Non-tariff measures are a key problem to EU exports (Grade A certification, and other US food safety rules). TTIP should be the opportunity to address these issues and find simpler and better solutions. The EU is also critical of the role played by CWT (Cooperatives Working Together) on supporting US exports. Possibly the most contentious part of the dairy negotiation, after tariff negotiations, will be EU requests for the United States to claw-back the use of six common cheese names in the US market, such as parmesan or feta cheese, and to accept to market only geographic indications (GIs) made in Europe.

The EU has consistently pushed for the widest possible recognition of its GIs, particularly in the dairy sector. The EU has shown that she is prepared to pay for the recognition of its GIs through additional concessions in other sectors, as evidenced in the recent EU-Canada agreement where the EU obtained additional protection to its GIs by accepting larger concessions in the meat sectors. The value of recognising the six GIs, which are already exported to the US market lies in balance with the additional concessions that should most probably be given in exposed sectors, like beef and other meats.

The United States is a competitive dairy exporter, pushing other countries to remove tariffs aggressively in previous Free Trade Agreements. The EU, in the aftermath of the abolition of the milk quota, should also show now a more offensive stance in this sector to expand exports of its high value added products.

Farm Europe believes that TTIP should lead to free trade in dairy products and to the elimination of regulatory trade barriers. The value of additional protection to some EU GIs should be assessed through the lens of economic criteria to make sure that the benefits outweigh the costs. 

Grains and oilseeds

Grain trade is largely composed of US exports to the EU. The United States is a leading global exporter and imports only limited quantities, usually specialty grains or product from Canada. The EU is also a leading wheat exporter, but imports rice and coarse grains and protects all grain markets with substantial tariffs. One should note, however, a gap in competitiveness in these sectors between the US and the EU which has tended to widen in recent years, and which is linked to the evolution of input costs and the stagnation of European yields.

Some access is afforded to the EU market through WTO commitments under TRQs and limits on the ‘margin of preference’ afforded to EU product compared to imports. US exports to the EU have fallen substantially from thirty years ago. In 2014, US exports were just over Euro 400 million. US tariffs on grain are low, whereas EU tariffs range from 40% to 90% (except for husked rice, which are 10% – 20%).

US maize and maize by-product exports are constrained by the EU GMO policy. This has reduced the largest U.S. grain export and limited the ability of the United States to compete for the EU’s WTO TRQ for maize established as compensation for loss of access during the Spanish and Portuguese accession to the EU.

US rice access to the EU has also benefited from terms negotiated in the Uruguay Round and the accession of the EFTA countries to the EU. Similarly, US wheat exporters have been able to gain some access to the EU market, in particular for high protein and durum wheat. However, the EU soft wheat and rice markets are both protected by high tariffs and reference price schemes. Elimination of these tariffs in a bilateral agreement would be a substantial advantage to U.S. exporters. 

In the case of wheat, the results of the EU FTA with Canada, a direct competitor to the United States for this product, are particularly relevant as EU tariffs will be eliminated. This indicates that the EU can now compete on a stronger footing. But regarding the US an issue of concern to the EU producers remains, as the new Farm Bill offers price coverage to US farmers, whereas the CAP relies on decoupled support, which is a disadvantage when prices are low.

Turning to oilseeds, the EU is a significant importer of soybeans and soybean meal, driven by structural deficits in the EU animal feed sector and a MFN tariff bound at zero in the WTO. US soybean oil exports face moderate tariffs, less than 10%, enough to slow US exports. The United States imports negligible quantities of EU vegetable oils (other than olive oil, reported with the fruit and vegetable sector.)

Despite the zero or relatively low tariffs, US soybean and products exports are restricted by EU GMO policy, as noted above. This policy could also negatively affect the EU farming sector, as GMO-free imports are more costly, thus adding to the feed costs in the EU.

The EU biofuel policy is an even bigger issue in the oilseed sector for biodiesel. Production of biodiesel is an important outlet for the EU oilseed sector, and adds a significant amount of protein as a by-product, which is beneficial to the EU feed sector that suffers from a large protein deficit. For the EU sector to compete with the US it should benefit from a regulatory framework that provides stability and room for expansion.

Farm Europe expects that the TTIP could result in the elimination of tariffs in the grains and oilseeds sector. In this case, the EU biofuels policy should enable the EU biodiesel production to expand, rather than serve to constrain it, to allow the EU to compete on an equal footing with the US. The internal distortive mechanisms in force in the Farm Bill should be taken into account by EU negotiators for any concessions such as for wheat, to ensure a level playing field for the EU sector, and specific protections should be maintained for certain highly sensitive products, like rice.


Starch and Ethanol

The EU starch industry has been constrained by a number of factors, unlike the US industry: the sugar regime limitations on the production of isoglucose, the higher maize and energy prices, and the lesser scale.

TTIP could bring about similar maize prices in the EU and the US. The end of the sugar quotas in 2017 will lift the limitations on the production of isoglucose. However, the other factors hampering the EU industry will remain intact.

The EU sector needs therefore time and investment to rise to the challenge of the competition from the US.

The same can be said about the EU ethanol sector, which relies more heavily on sugar beet as raw material, whereas in the US ethanol is made mostly out of maize. Previous and running US programmes have greatly helped the sector develop, whereas in the EU development is still at early stages. Farm Europe is therefore of the opinion that the EU industry needs time and an appropriate regulatory framework and safeguards to meet US competition.

Biofuels can be an important outlet for the EU grains and sugar producers. As biofuels production generates protein rich products, it has the potential to reduce the large EU deficit. Farm Europe believes it is time to objectively evaluate the costs and benefits of producing biofuels in the EU, and factually assess its impacts including the mitigation of the EU protein deficit, instead of succumbing to prejudice and targeted campaigns.

Fruit and Vegetables, Nuts and Olive oil

The United States has a growing trade surplus with the European Union in this sector. In 2014, U.S. exports were led by nuts, in particular almonds, pistachios, walnuts), and dried fruits.

Leading EU exports are olive oil at over Euro 0.7 billion and olives at over Euro 250 million in 2014. Some leading global US exports, such as oranges, orange juice, apples, grapes, and stone fruits have limited exports to the EU so far.

US tariffs in this sector are generally low, but a few products are still sensitive to import competition (including olive oil and olives). Olive oil standards could, however, be a sticking point in the negotiations, as US olive oil producers push for the approval of US-specific standards, which EU exporters believe will disadvantage their exports.   EU tariffs are moderate in general, but are substantial for some import sensitive products that are export priorities for the United States, such as citrus (30% tariff), apples and pears (40%), and fruit juices (50 – 150%). In addition, the application of the EU entry price system to these products effectively raises the tariff on low-priced imports to protect high prices in the EU, and reduces imported quantities even as it helps to preserve high prices in the EU market.

The sector is highly diversified, but it can be argued that the EU has its own strengths and competition from the US is cushioned by the fact that the US production is concentrated in the west coast, increasing transport costs to the EU.

There are fewer high profile SPS barriers in this sector, although food safety laws are of growing complexity and concern on both sides. A genuine regulatory cooperation and simplification could bring tangible benefits for the EU sector. While in past FTAs the EU has protected the entry price system for these products, it is possible that the EU could view resolution of SPS issues affecting their products as a trade-off for the entry price system, which targets low price imports from other origins.

Farm Europe expects that free trade and the elimination of non-tariff barriers could be, in general, beneficial to this highly diversified sector, as long as rules of origin are strictly respected.


 Wine and beer

The EU has a substantial trade surplus in wine and beer trade. US wine exports to the EU have increased, but still lag significantly behind US imports. Beer tariffs are zero in both countries (which is also the case for distilled spirits), but US wine tariffs (around 20%) are higher than in the EU (10% or less).

Trade in alcohol products is highly regulated in both countries. Eliminating non-tariff barriers is important to boost the benefits of trade. The bilateral wine agreement of 2006 envisioned further negotiations to align the two markets, which may occur in the FTA.

A package of import duties and taxes, from which US wines are largely exempt, apply to European wine exports to the US. While wines imported to the US are subject to a tax which varies depending on alcohol content, many US producers benefit from tax cuts in this area. This distortion in treatment is found on the state-level as well, where taxes and excise duties are applied to imported wines, while local producers have access to tax breaks and credits.

At the same time, the negotiations are also an opportunity for the EU to raise concerns regarding additional GI protection. However, the GI issues which remain (use of some generics and semi-generics) appear pale as compared to the value of eliminating tariffs and other barriers.

Farm Europe defends that the EU should be offensive in this sector, building on the renewed competitiveness of its sector, and concentrate its efforts at eliminating tariffs and non-tariff barriers in the negotiations.

Sugar and other Processed Products

The EU has a positive trade balance in processed products with the US. EU Exports are led by snack foods, roasted and instant coffee, spices and other consumer oriented products. US exports are led by snack foods, pet foods, and other consumer oriented products. The trade flows reflect the strength of EU brands for quality and niche products and relatively open US market for processed products.

US tariffs on processed products are generally low, unless there are dairy or sugar components in the product. EU tariffs can be substantial, as duties are based on a complex formula takes into account sugar, dairy, and starch components and calculates a duty designed to ensure the level of protection for these base products remains high. This system is generally referred to as the “Meursing Table”, and its reform has been a long-standing US objective.

As with reforms of the entry price system, the EU has been reluctant to reduce protection for processed products in bilateral FTAs. This impulse may be shared in the United States with respect to sugar-containing products, an area traditionally protected in the United States, where both the EU and US tariffs exceed 100% and where both will be concerned about importing third-party sugar incorporated into sugar-containing products.

However, for Farm Europe, the elimination of EU sugar production quotas after 2017 points to a more ambitious EU position for sugar and sugar-containing products over the longer term, as more competitive sugar production should expand as a result of this reform.  Nevertheless, special attention should be paid to specific sugar products, given their vital role in the economic development of some less favoured areas. This is the case, for example, with the EU’s outermost region and the production of so-called “raw brown sugar intended for direct consumption”, and for rum production, taking into account the very high level of subsidies in the US. In addition to that the EU should strive for strict rules of origin, as the US market is to a degree open to NAFTA (Mexico) and in the future TPP (Australia) exports.


Sanitary and Phytosanitary issues (SPS)

It is the inclusion of SPS issues that separates TTIP from other trade negotiations in agriculture. The problem is that the EU and the US maintain fundamentally different approaches to risk management. The EU follows the “precautionary principle” which in its eyes justifies banning growth promoters or GMOs (now in many EU member states). The US asserts that it applies a science-based approach.

It is difficult to conceive that the EU and the US will be able to agree on this entire chapter. But it is equally difficult to conceive that SPS issues will be left aside in TTIP. The reason is quite straightforward: tariff concessions can be voided by SPS barriers. But issues like hormones and GMOs have proven far more resilient to agreement.

What are the potential consequences? The case of hormones in beef is illustrative. The EU lost the WTO case, and is now paying compensation to the US. But the compensation deal is being contested in the US, as the benefits have diminished (due to the increased exports of other countries). Beef is one of the sectors where the EU shows a significant gap of competitiveness vis-a-vis the US. Tariff discussions will already be of great consequence. The hard stance of the EU on banning hormone beef makes it even harder for the EU sector to limit concessions in access to non-hormone treated beef.

Farm Europe expects that with the exclusion of hormones and GMOs, other SPS issues can be addressed and a mutually agreed solution found.

[1] All 2014 data is for the EU-28.