There have always been predictions and concerns about the ability of agriculture to meet the global demand for food. In as early as 1798, Thomas Malthus made a pessimistic analysis of this issue in his groundbreaking ‘Essay on the Principle of Population’. He started from the observation that the global population would continue to rise […]
Our Works
What should the EU’s Plant Protein Strategy do?
A review of existing CAP measures for protein, oil protein and oilseed crops and market trends What lessons? What next?
Policy Briefing, October 2017.
In the European Union, the goal of ‘protein independence’, or rather the EU’s heavy reliance on plant protein imports ‒ mainly in the form of soybean meal ‒ which are used to feed livestock, is a recurring theme.
Over the last three decades, the EU has made independence a strategic priority at every major policy review: the Blair House negotiations, the CAP reforms of 1992, 2000, 2003, 2008, & 2013, and in the European Strategy for Biofuels from agricultural sources. This has given varying degrees of satisfaction and has had varying degrees of success.
Commissioner Hogan has decided to revisit this goal. And the context is a busy one: the CAP’s greening measures are being modified, there is a proposal to revise the REDII Directive, the business outlook in the agricultural sector is manifestly depressed and preparatory discussions are underway for the post 2020 EU budget, including the CAP. It is therefore a good time to consider the lessons from the measures that have already been implemented, and to use them to outline what an effective growth plan might look like.
Over the last 30 years, European support has come in three main forms:
– voluntary coupled support (VCS) for protein and oil-protein bearing crops, with Member States (MS) having been asked to decide on the adoption of this type of voluntary support measure in 2003, 2008 and 2013;
– biofuels targets in the EU transport sector’s energy mix;
– the requirement, introduced by the CAP in 2013, which obliges farmers to put 5 % of arable land into Ecological Focus Areas (EFAs) and to be able to grow nitrogen-fixing plants and catch crops in them.
In light of the objectives of increasing both the ‘area under cultivation’ (AUC) and the quantity of protein and oilseed crops produced in the EU, this study analyses the impact of these three principle policy measures in two main Parts.
Part 1 outlines the current situation for protein and oil-protein bearing crops:
– section 1 analyses of how the CAP and the incentives for these crops have changed over time;
– section 2 attempts to identify the extent to which there is a correlation between
CAP incentives and trends in the AUC/quantity metrics for protein and oil- protein bearing crops.
Part 2 analyses the changes in EU oilseed production and the extent to which these are attributable to the EU’s biofuels policy.
This analysis shows the positive outcome of the 2013 reforms, which doubled the production of protein and oil-protein crops, principally through the introduction of greening and Ecological Focus Areas (EFA) but also by retaining the discretionary option for MS to allocate coupled support to these crops.
I- Protein and oil-protein crops (peas, broad beans & field beans, and soya beans)
1) Changes in the CAP and incentives for protein-bearing crops
– 1999: Agenda 2000
Following the Berlin Agreement, the “Agenda 2000” CAP reform package was adopted. Among its key provisions were the principle of eco-conditionality for direct support schemes, and common regulations for field crops (cereals, oilseeds and protein-bearing crops).
In 1999 and 2000, a direct support payment was created based on: a single all-crop rate of 63 euros/t and the historic yields of specific production zones. A protein- bearing crop premium was also introduced. The payment for protein-bearing crops was initially set at 78.5 euros/t, and reduced in 2000-2001 to 72.5 euros/t, which amounts to a premium of 9.5 euros/t for protein-bearing crops.
– 2003: The Luxembourg Agreement
A new CAP reform, part of the mid-term review, initiated the decoupling of support with a 75% reduction in the amount of coupled support and the shift to a “single farm payment” scheme. In addition to this single payment scheme, based on hectarage, a premium of 55.57 euros/ha was introduced for protein-bearing crops.
– 2008: The CAP Health Check
2007-2013 saw the opening of a fresh programming round for the CAP. In 2010, 6 MS made use of article 68 (possibility for MS to use Pillar 1 funds for specific objectives, drawn from the country’s Pillar 1 decoupled support budget) to support protein-bearing crops: Finland, France, Lithuania, Poland, Slovenia and Spain (source: EC-DG Agri 2010).
|
Member State (MS) |
Details |
|
Finland |
6.5 M euros for protein and oilseed crops in 2011; 83 000 ha or approx. 78 euros/ha |
|
France |
80 M euros in 2010-2011; peas, field beans, lupins: 100 euros/ha in 2010 and 140 euros/ha in 2011 |
|
Poland |
21.6 M for 2010-2011; 163 euros/ha in 2012 |
|
Spain |
1 M euros/year in 2010 and 2011 |
Table 1: amount of CAP article 68 support for protein-bearing crops in 2008 (Sources: European Parliament, The Environmental Role of Protein Crops in the New Common Agricultural Policy, 2013)
– 2013: CAP reform
The 2013 CAP reform gave MS a discretionary option to reallocate 13 % of their Pillar 1 direct support budget to voluntary coupled support (VCS) measures. This 13% could be raised to 15% if the MS decided to devote 2% or more of their VCS budget to the production of protein crops (including soya).
On the 1st August 2014 MS notified the European Commission of their VCS measures for protein-bearing crops. 11% of this VCS support was allocated to protein-bearing crops ‒ within a quantitative limit of 4.3 million hectares and an annual total budget at EU level of 441 million euros (or 102 euros per hectare on average). The figures mean that the protein-bearing crop sector has been the fourth most supported sector in terms of VCS support, lagging behind the livestock rearing sector. VCS measures came into force in 2015 and will run until (end) 20201.
1 Source: Commission Information Note, 30 July 2015.
The 16 MS that opted to support protein-bearing crops through VCS were:
|
Member States |
Details (amounts in millions of euros) |
|
Bulgaria |
16 M euros |
|
Czech Republic |
17 M euros |
|
Greece |
7 M euros |
|
Spain |
45 M euros (209 euros/ha) |
|
Finland |
6 M euros |
|
France |
146 M euros (187 euros/ha) |
|
Hungary |
27 M euros |
|
Croatia |
4 M euros |
|
Ireland |
3 M euros |
|
Italy |
36 M euros |
|
Lithuania |
14 M euros |
|
Luxembourg |
– |
|
Latvia |
4 M euros |
|
Poland |
68 M euros (266 euros/ha) |
|
Romania |
49 M euros |
|
Slovenia |
3 M euros |
Table 2: VCS for protein-bearing crops, entry into force in 20152.
With the 2013 reform, which included the objective of increasing the EU’s independence in Protein-Rich Materials, soya production became eligible for voluntary coupled support (VCS). In 2015, in the MS that adopted VCS for these crops, their rate fluctuated between 96 and 419 euros/ha.
The 9 MS that did so (amount in euros/ha) were: Bulgaria: 156; Croatia: 260; Czech Republic: -; France: 100 with a limit of 12.5 ha per farm; Hungary: 150-200; Italy: 96; Poland: -; Romania: 325; and Slovenia: 419.
Moreover, the 2013 CAP reform linked 30% of Pillar 1’s direct payments to greening measures, which included creating Ecological Focus Areas (EFA) on at least 5 % of each farm’s arable land. This obligation has been largely fulfilled by the EU’s farmers: 15%, or 8 million hectares, of arable land was put into EFAs by 2016. Nearly 40% of total EFA land area has been planted with nitrogen-fixing crops. With respect to soya, out of the 12 MS that produce it, 10 made it eligible for planting in EFAs.
2 Source: Commission Information Note, 30 July 2015.
2) Trends in area under cultivation (AUC) and production quantities in the EU
– High-protein peas
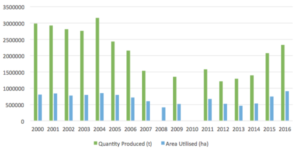
Figure 1: Trends in production and AUC for high-protein pea crops from 2000 to 2016 (source: Eurostat database)
Due to successive falls in yields, the production of high-protein peas in the EU fell progressively from 2000 to 2003. However, the AUC remained stable at around 750,000 ha.
With the accession of 10 additional countries to the EU in 2004, production picked up again. This spike would only be a temporary reprieve, however, as the falling trend for AUC/quantity produced returned in 2005 and continued until 2009. The low yield problem (and thereby mediocre profitability compared to the alternative field crops available) persisted, and the AUC fell markedly year on year, despite the coupled support of 55.57 euros/ha. Up to and including 2009, European high-protein pea production seemed to be fighting a losing battle with AUC collapsing from 851 290 ha in 2004 to 411 930 ha in 2008, in other words a reduction of 51.61%.
Between 2009 and 2011, the AUC began to grow again, only to fall back in 2012 and 2013. It is possible to posit a correlation between the end of the fall in production and ‒ and even a modest recovery ‒ with the application of the new article 68 introduced following the 2008 CAP Health Check, however, this measure was unable to prevent fresh falls in the AUC in 2012 and 2013.
Since 2014 the trend has reversed and high-protein pea production has enjoyed continued growth both in terms of quantity and AUC. 2015 and 2016 saw strong growth with, respectively, 2,076 million tonnes and 744 260 hectares and 2,329 million tonnes and 911 690 hectares ‒ in other words the highest levels since 2000. Between 2013 and 2015 production increased by 60.83% and AUC by 60.70%. Between 2013 and 2016 production increased by 80.49% and AUC by 96.85%.
This growth occurred after the 2013 reform. There are two types of support for protein crops: on the one hand, voluntary coupled support, and on the other hand, the discretionary option of planting protein crops in the EFA.
Now, by examining the situation for high-protein peas in Germany, where voluntary coupled support has not been applied to protein crops, we get an interesting perspective on which support has driven this growth.
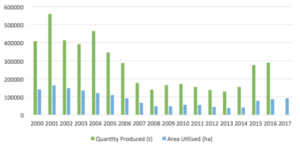
Figure 2: Trends in production and AUC for high-protein pea crops in Germany from 2000 to 2017 (Source: Eurostat database).
In Germany, the AUC and quantities of production for high-protein peas fell each year from 2000 to 2008. From 2008 to 2014 both metrics stagnated. However, in 2014 and 2015 they increased significantly (+78.23% for production and +89.68% for AUC). Growth between 2013 and 2016 was 124.09% for quantity and 130.87% for AUC.
What we see here is that in Germany, as in the whole of the EU (and without prejudice to (any potential) differential impact of voluntary coupled support in the MS that have deployed it), by opening up the EFA to protein crops the ‘greening’ measure has clearly been the main driver of the return to rising AUC & quantity of production for high-protein peas.
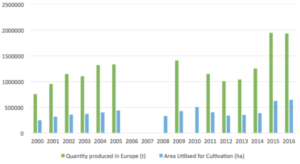
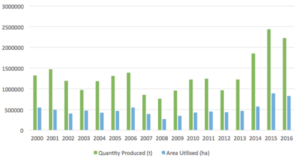
Figure 3: Trends in production and AUC for broad beans and field beans from 2000 to 2016 (source: Eurostat database)
The trend for broad beans & field bean crops mirrored that of high-protein peas over the 2000-2013 period. Despite the different measures implemented between 2000 and 2013, production struggled to grow and the small rise in 2009-2010 petered out quickly.
Having said this, as for high-protein peas, from 2014 to 2017, broad bean and field bean crops have grown both in terms of AUC and production quantity ‒ and experienced extremely high growth in 2014 and 2015. In 2016 production levels stabilised at the 2015 level, and 2017 has seen a fresh increase in AUC. Through 2014 and 2015 production grew by 55 % and AUC by 61 %.
As for high-protein peas, the hypothesis of causality between the increase in EU broad bean and field bean production from 2014 to 2017 and the support introduced by the 2013 reform, appears a convincing one.
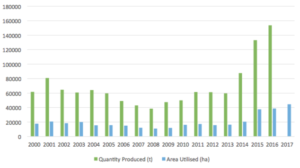
Figure 4: Trends in production and AUC for broad beans and field beans from 2000 to 2017 in Germany (source: Eurostat database)
As for high-protein peas, the trends observed in Germany from 2014 to 2017 tend to show a very positive impact from the EFA greening measure for nitrogen-fixing crops (including protein-rich varieties). This can be seen clearly in Figure 4, which shows a constant increase in both quantities produced and AUC from 2014 onwards, whereas levels had previously been stable. In percentage terms, from 2013 to 2016, growth was 157.45% for quantity of production, and 135.15% for AUC. And, as for protein peas, this increase was especially pronounced between 2014 and 2015 (+52.05% for quantity of production and +83.41% for AUC).
The measure promoting nitrogen-fixing crops in EFA has therefore clearly encouraged the growing of broad bean and field bean crops in the EU.
– Soybean Production
Figure 5: Trends in production and AUC for soybean from 2000 to 2016 (source: Eurostat database)
The graph shows fluctuations in the AUC and quantities produced for soybean crops in the EU up to and including 2013. With the exception of 2007-2009 (a noticeable dip) production held up, but was hardly buoyant.
In 2015 and 2016 both metrics showed a significant increase, reaching a new level substantially above the previous average, including 2013. In 2015 production increased by 112.34% and AUC by 103.21% relative to the previous average up to and including 2013.
Even if the 2016 levels are slightly lower than in 2015, a clear correlation between MS implementing the 2013 CAP reform (entry into force in 2015) and the positive progression in soybean production is apparent. In implementing the 2013 reforms, the EU’s main soybean producing countries chose to encourage production with coupled support and by choosing to plant soybean crops in their EFA. However, conclusions about the relative weight of these two measures in the strong soybean growth figures since 2014 cannot be drawn at this point.
In summary:
During the 2000-2013 period, the reformed CAP’s new measures and policy adjustments were unable to turn around what had been a negative or stagnating trend. Only the improvement for high-protein peas from 2009 to 2011 could be interpreted as a ‒ temporary ‒ impact of the measures adopted following the 2008 Health Check.
However, in the wake of the 2013 reforms, the increasing AUC and production quantities for high-protein peas, broad and field beans and soybeans, appears highly correlated with the double decision to require 5% of arable land to be put into EFA and to allow nitrogen-fixing crops in them. This double decision had the positive outcome of enabling EU protein and soybean production to jump to a new level ‒ and has also led to (the EU) having not just 5% of arable land in EFA, as regulations require, but 15 %.
In the absence of coupled support and therefore with the double EFA measure as the sole incentive, Germany has experienced similar growth to that described here for the EU as a whole. However, we cannot rule out there being a correlation between coupled support and the newly positive trends in protein crop production in the other MS on the basis of the German case alone.
There is, however, an important question mark now hanging over the immediate future: will the Commission’s recent total ban on the use of pesticides for nitrogen-fixing crops grown in the EFA bring to a halt or even reverse the positive progression of EU protein crop production? By opting for a blanket ban rather than require ‘reasonable use’, has the Commission carefully assessed the risks, which may be the end of production of this type of crop in the EFA as farmers weigh up the opportunity costs between:
- – the cost of sowing and growing their crops without the ability to control damage from pest invasions;
- – and the option of reducing EFA area to the regulatory minimum, or even of not growing crops in them at all (thus opening the door to additional protein crop imports into the EU and undermining both European and global food security)?There is another under-explored area where progress could be made: improving crop technology and achieving more stable yields ‒ even in a context of climate/weather variability. This can be achieved through research to help farmers optimise crop management, combined with substantial investment in variety research. Seed companies abandoned variety research for protein crops because in the EU their production had either been stagnant or in the worst cases were falling, so they have not been seen as attractive business prospects.The conditions for investment in improved varieties will return when the outlook for production is positive and levels reach a critical threshold to become credible markets. These basic conditions have been emerging during the 2014-2017 period but the positive outlook could easily be broken. The (policy) goal is not so much to invest public money in variety research but to create the conditions in which it can take place. The EU can do this via the CAP, but also by taking, as it will have to, responsible positions, for example, on the subject of new variety selection technologies.
On the question of the CAP, the changes affecting the conditions for greening measures discussed above raise the question of what the CAP is seeking to achieve: is it a policy that seeks to achieve results and which empowers farmers, as business entrepreneurs who are able to take decisions ‒ and allocate resources effectively ‒ or a policy that dictates the agronomic approach that farmers should follow in order to respond to what ‘public opinion’ is thought to want?
II- Rapeseed oil crops
1) The EU’s biofuels policy
In the 1990s the EU launched a policy to stimulate biofuel production. The aim was to reduce energy dependence on imported fossil fuels and to strengthen the resilience of the agricultural sector. Objectives for a biofuels contribution to energy use in the transport sector were set: in 2003, an objective of 2% was set, then in 2009, an objective of 5% by 2010 and 10% by 2020 was set. Following the 2003 Biofuels Directive, and the reform of the CAP taking place in parallel, a financial subsidy for energy crops of 45 euros per hectare was introduced and this ran until the CAP Health Check in 2008. A biofuels industry was thus born, was favourably received in general and benefited from EU regulatory and financial incentives.
Following the 2007 food riots and intense lobbying by certain organisations, the public perception of biofuels changed, that is, for conventional biofuels, even though the arguments made were false and have since been formally discredited by institutions such as the FAO, by the science community and by the Commission itself (DG Agri, JRC). The goals were nonetheless revised downwards, with the objective of a 7% contribution by 2020 set in 2015, and MS were encouraged to redirect their subsidies to so-called ‘advanced’ biofuels.
2) Rapeseed: AUC and production trends
Rapeseed is the most used agricultural product in biodiesel production in the EU. It is ahead of palm oil (which is imported) and far ahead of soybean and sunflower oils (the share of the latter remaining limited throughout the period in question).
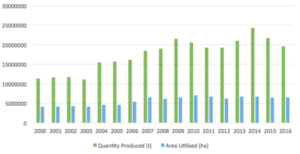
Figure 6: Trends in production and AUC for rapeseed from 2000 to 2016 (source: Eurostat database)
Figure 6 shows a clear jump in the quantity of rapeseed produced from 2004 to 2009 (+35% compared to the average of previous years). In 2004 the AUC increased by a smaller percentage (9%) but from 2003 to 2007 it increased by 57%, and has remained relatively stable since.
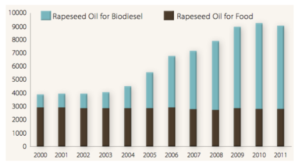
Figure 7: Supply of rapeseed oil to the food and biofuel markets (Source: calculations by FEDIOL, using Oil World Annual data 2000-2011)
Figure 7 shows that the increased production of rapeseed oil in 2004 was driven by its use as an energy source, so, we can say that in the EU, the increase in AUC for rapeseed is directly correlated with the progression of rapeseed-based biodiesel.
The financial support measures for energy crops adopted in 2003 before being abandoned in 2008 therefore seem to have, in parallel with tax incentives introduced in different MS, successfully spurred rapeseed production.
The production of biodiesel from EU oilseed crops has generated the production of high-protein oilseed meal as a co-product, reducing the EU’s dependence on imported soybean meal. The emergence of these new energy markets for European oilseeds (especially rapeseed) in fact sustains an additional annual production of 9.3 MT of European rapeseed meal, reducing imports on which the EU depends.
Biodiesel production in the EU was, initially, almost exclusively rapeseed-based. And in 2008 rapeseed’s contribution to biodiesel was still 72% although it has subsequently lost market share to competition from imports of palm oil ‒ and this has occurred despite the serious questions about the environmental and economic record of biodiesels made from imported palm oil (see our report « producing fuel and feeds – a matter of security and sustainability for europe» http://www.farm- europe.eu/travaux/poducing-fuel-and-feeds-a-matter-of-security-and-sustainability-for- europe/ ).
In summary:
Rapeseed meal production has doubled since 2004. 9.3 million tons of rapeseed meal are directly attributable to biodiesel production in the EU. Rapeseed oil is used to produce biodiesel, and the high-protein co-product of this process is available to EU farmers as an animal feed.
This greater availability of plant protein within the EU market directly reduces the quantity of primary agricultural produce for use in animal feed imported into the EU. Setting this in context, Europe is structurally deficient in protein and imports 70 % of its protein crops and meal from third countries. A recent report of the European Parliament has estimated the EU’s ‘protein gap’ at 20 million tonnes[24].
In light of this, both the European Parliament and Member States, “Calls on the Commission swiftly to submit to Parliament and to the Council a report on the possibilities and options for increasing domestic protein crop production in the EU by means of new policy instruments (also taking into account the use of oil seeds and their by-products and the potential extent for substituting imports), the potential effect on farmers’ revenues, the contribution it would make to climate change mitigation, the effect on biodiversity and soil fertility, and the potential for reducing the necessary external input of mineral fertilisers and pesticides”.
The increase in the production of rapeseed and sunflower meal (the seed is made up of approx. 60 % protein-rich meal and 40 % oil) has given the EU a minimum of independence. Imports of soybean meal have reduced, especially compared to the peak import levels of 2007.
While the use of rapeseed oil in food consumption has been stable for several decades, the emergence of a growing European supply in protein-rich meal has only been possible by developing alternative commercial uses for the oil.
It is therefore clear that the production of biofuels from European plant and cereal oils is essential if (and is today the only option offering sufficient scale) the EU is to improve and secure a domestic (EU grown) supply of plant protein that can be used as an animal feed, thereby limiting imports.
Biofuels based on palm oil – even those based on imported used cooking oil – do not make sense for the EU, both in environmental and economic terms. It should be noted that this report does not deal with the subject of the sustainable use of palm oil in the EU food industry, which is one that would benefit from greater clarity.
The question that arises today is therefore that of the appropriateness of the EU’s REDII proposal which is currently on the table and which would eliminate much of the production of conventional biofuel, with no justification.
The absence of a strategic EU vision raises questions. Are we still applying terms such as ‘growth’, ‘profitability’ and ‘competitiveness’ to our food production system and to our agriculture, or have we replaced them with the term ‘decline’?
Do we want to grow forests rather than crops across the entire EU and limit agriculture to, at best, the domestic supply of food, using imports to meet a host of EU citizens’ other needs, such as green chemistry and green energy, to name just a few?
Do we want to use EU agriculture as a driver for the green economy or do politicians in fact have other economic priorities, such as, for example, protecting the position of fossil fuels and encouraging biofuels based on used cooking oil (palm)?
If it is the latter then we will need to prepare for a constantly increasing CAP budget. Not only this, we will also be completely abandoning the goal of a market-oriented agriculture, with dependence on imports in its place. Such an approach would also generate additional fluctuations in the world’s agricultural markets.
If, on the other hand, the objective is to be serious and have genuine ambition for our agriculture and our related ‘green growth’ industries; then it needs to be recognized that conventional biofuels, made from EU grown primary agricultural materials, have a key role to play in the development of the EU’s food system.
The Commission’s REDII proposal3, currently being debated in the European Parliament and in the Council, would lead, in the short term, to a drastic reduction of the European production of oilseed-based biodiesel.
3 A new Renewable Energy Directive for the period after 2020.
In practice, the consequences of this would be:
– greater consumption of fossil fuel energy and imported biofuels, which have questionable environmental records (2nd generation European biofuels are emerging more slowly than the somewhat pious hope evident in Commission statements);
– but also a greater quantity of imported plant protein due to the fact that the proposal sounds the death knell for the annual 9.3 million tons of rapeseed meal produced to supply the biodiesel industry.
***
The present analysis of changes in (plant-based protein) policy has discussed the relative effectiveness of the different initiatives implemented by the EU following the European Commission’s decision to initiate a debate on the content of a new Protein Strategy, the aim of which is to reduce Europe’s dependence on imports of soybean and soybean meal from the Americas.
Since 2000, the EU has launched more than half a dozen initiatives to increase protein and oil-protein crop production. Analysis of market trends over the 2000-2016 period clearly shows that two approaches in particular have been effective in boosting production in a significant way:
- – first, expanding the biofuels industry, which today offers the best route to a Protein Strategy with sufficient scale and ability to reduce Europe’s dependence on soybean imports.
- – second, and more recently, the CAP’s 2013 greening initiative, and in particular the authorisation of nitrogen-fixing crops in Ecological Focus Areas, which led to the doubling, at least, of the quantities of peas, broad beans and field beans and soybeans, that are produced in Europe.It is surprising to see that these two pillars of European policy, which have unquestionably given tangible results, are today being undermined by the European Commission itself.By banning the use of pesticides in the Ecological Focus Areas the Commission risks undermining the progress made since 2013. Moreover, in their current proposals for revising the Directive on the promotion of the use of energy from renewable sources (REDII), the Commission completely omits any reference to the benefits of having an agriculture-based biofuels industry, which it now risks crippling, despite the fact that this industry contributes both to more sustainable transport and to the resilience of the EU’s agricultural sector overall.
Looking to the future, any ambitious Protein Strategy should include:
– the ability of the biofuels industry to play its role to the full; and, in a complementary manner,
– continuing to green the CAP in an intelligent, pragmatic and proactive way ‒ putting ideology to one side ‒ and reconciling business and environmental approaches. It is clear that nitrogen-fixing crops have a key role to play in such a strategy.
